

This is a preprint.
Analysis of 6.4 million SARS-CoV-2 genomes identifies mutations associated with fitness
- PMID: 35194619
- PMCID: PMC8863165
- DOI: 10.1101/2021.09.07.21263228
Analysis of 6.4 million SARS-CoV-2 genomes identifies mutations associated with fitness
Update in
-
Analysis of 6.4 million SARS-CoV-2 genomes identifies mutations associated with fitness.Science. 2022 Jun 17;376(6599):1327-1332. doi: 10.1126/science.abm1208. Epub 2022 May 24. Science. 2022. PMID: 35608456 Free PMC article.
Abstract
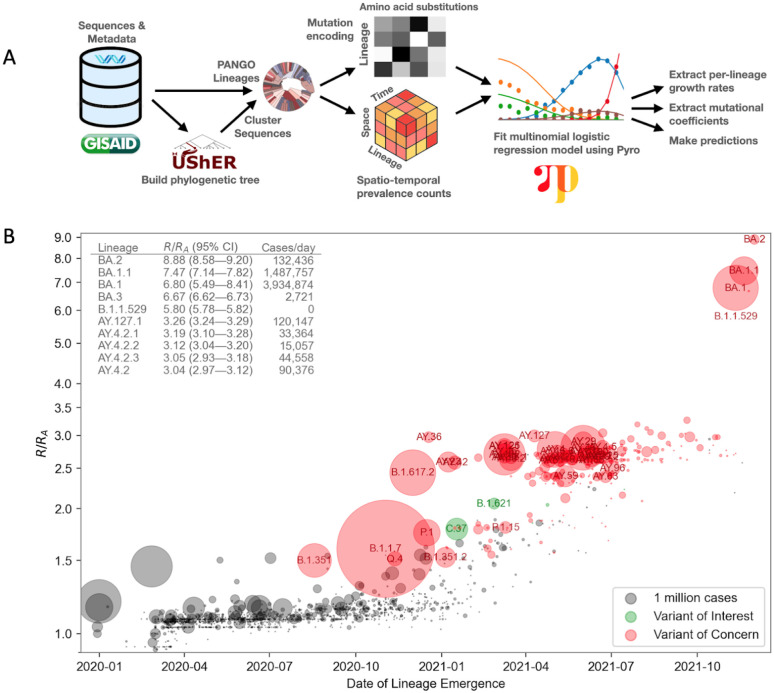
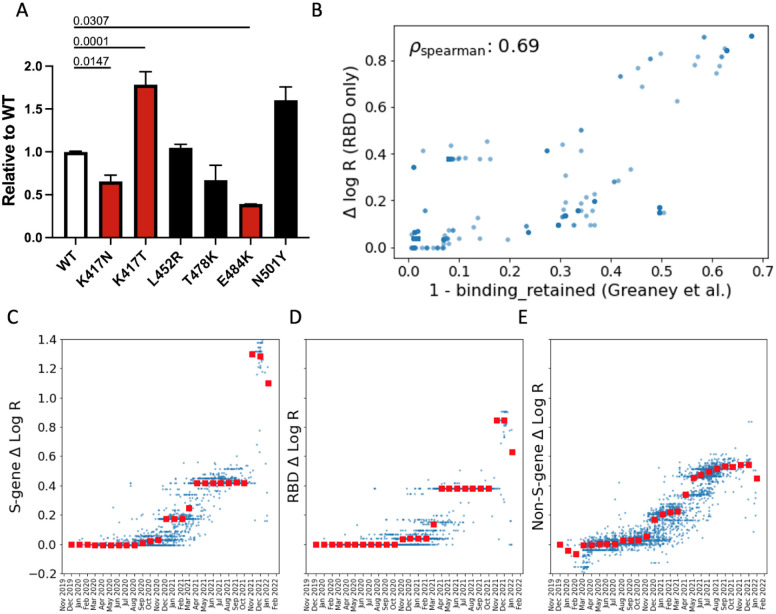
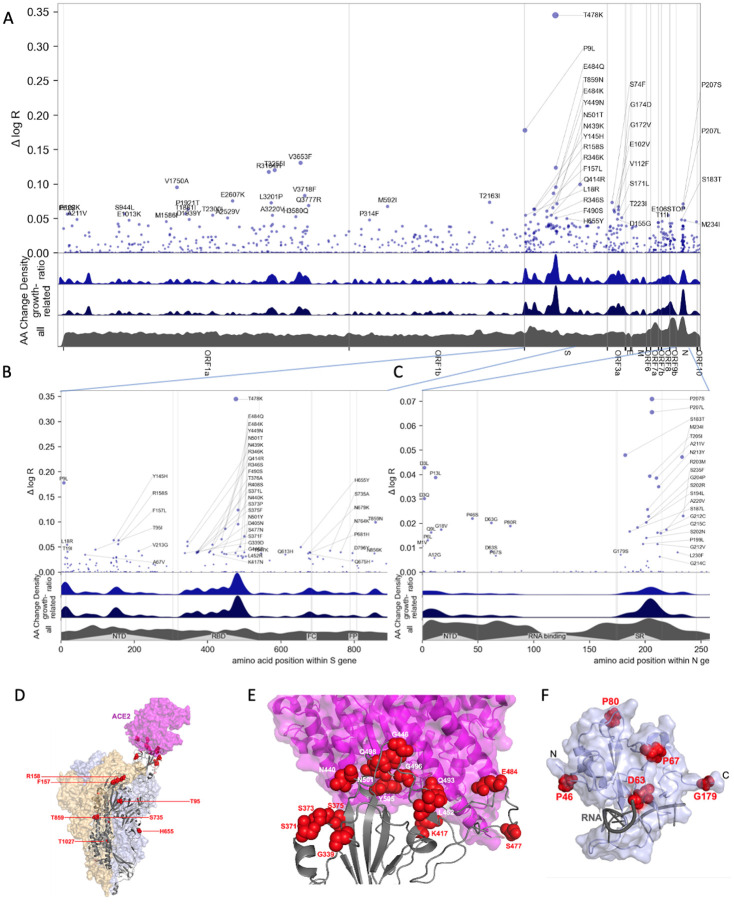
Repeated emergence of SARS-CoV-2 variants with increased fitness necessitates rapid detection and characterization of new lineages. To address this need, we developed PyR 0 , a hierarchical Bayesian multinomial logistic regression model that infers relative prevalence of all viral lineages across geographic regions, detects lineages increasing in prevalence, and identifies mutations relevant to fitness. Applying PyR 0 to all publicly available SARS-CoV-2 genomes, we identify numerous substitutions that increase fitness, including previously identified spike mutations and many non-spike mutations within the nucleocapsid and nonstructural proteins. PyR 0 forecasts growth of new lineages from their mutational profile, identifies viral lineages of concern as they emerge, and prioritizes mutations of biological and public health concern for functional characterization.
One sentence summary: A Bayesian hierarchical model of all SARS-CoV-2 viral genomes predicts lineage fitness and identifies associated mutations.
Conflict of interest statement
Authors have no competing interests.
Figures
References
-
- Davies N. G., Abbott S., Barnard R. C., Jarvis C. I., Kucharski A. J., Munday J. D., Pearson C. A. B., Russell W., Tully D. C., Washburne A. D., Wenseleers T., Gimma A., Waites W., Wong K. L. M., van Zandvoort K., Silverman J. D., CMMID COVID-19 Working Group, COVID-19 Genomics UK (COG-UK) Consortium, Diaz-Ordaz K., Keogh R., Eggo R. M., Funk S., Jit M., Atkins K. E., Edmunds W. J., Estimated transmissibility and impact of SARS-CoV-2 lineage B.1.1.7 in England. Science. 372 (2021), doi: 10.1126/science.abg3055. - DOI - PMC - PubMed
-
- Volz E., Mishra S., Chand M., Barrett J. C., Johnson R., Geidelberg L., Hinsley W. R., Laydon D. J., Dabrera G., O’Toole Á., Others, Assessing transmissibility of SARS-CoV-2 lineage B. 1.1. 7 in England. Nature, 1–17 (2021). - PubMed
-
- Stefanelli P., Trentini F., Guzzetta G., Marziano V., Mammone A., Poletti P., Grané C. M., Manica M., del Manso M., Andrianou X., Others, Co-circulation of SARS-CoV-2 variants B. 1.1. 7 and P. 1. medRxiv (2021) (available at https://www.medrxiv.org/content/10.1101/2021.04.06.21254923v1.abstract). - DOI
-
- Vöhringer H. S., Sanderson T., Sinnott M., De Maio N., Nguyen T., Goater R., Schwach F., Harrison I., Hellewell J., Ariani C., Gonçalves S., Jackson D., Johnston I., Jung A. W., Saint C., Sillitoe J., Suciu M., Goldman N., Birney E., Funk S., Volz E., Kwiatkowski D., Chand M., Martincorena I., Barrett J. C., Gerstung M., The Wellcome Sanger Institute Covid-19 Surveillance Team, The COVID-19 Genomics UK (COG-UK) Consortium, Genomic reconstruction of the SARS-CoV-2 epidemic across England from September 2020 to May 2021. bioRxiv (2021),, doi: 10.1101/2021.05.22.21257633. - DOI
-
- Korber B., Fischer W. M., Gnanakaran S., Yoon H., Theiler J., Abfalterer W., Hengartner N., Giorgi E. E., Bhattacharya T., Foley B., Hastie K. M., Parker, Partridge D. G., Evans C. M., Freeman T. M., de Silva T. I., McDanal C., Perez L. G., Tang H., Moon-Walker A., Whelan S. P., LaBranche C. C., Saphire E. O., Montefiori D. C., Angyal A., Brown R. L., Carrilero L., Green L. R., Groves D. C., Johnson K. J., Keeley A. J., Lindsey B. B., Parsons P. J., Raza M., Rowland-Jones S., Smith N., Tucker R. M., Wang D., Wyles M. D., Tracking changes in SARS-CoV-2 Spike: evidence that D614G increases infectivity of the COVID-19 virus. Cell (2020), doi: 10.1016/j.cell.2020.06.043. - DOI - PMC - PubMed
Publication types
Grants and funding
LinkOut - more resources
Full Text Sources
Miscellaneous