. 2022 Feb 23:11:e74773.
doi: 10.7554/eLife.74773.

Identification of electroporation sites in the complex lipid organization of the plasma membrane

Affiliations

Identification of electroporation sites in the complex lipid organization of the plasma membrane

Lea Rems et al. Elife. .

Abstract

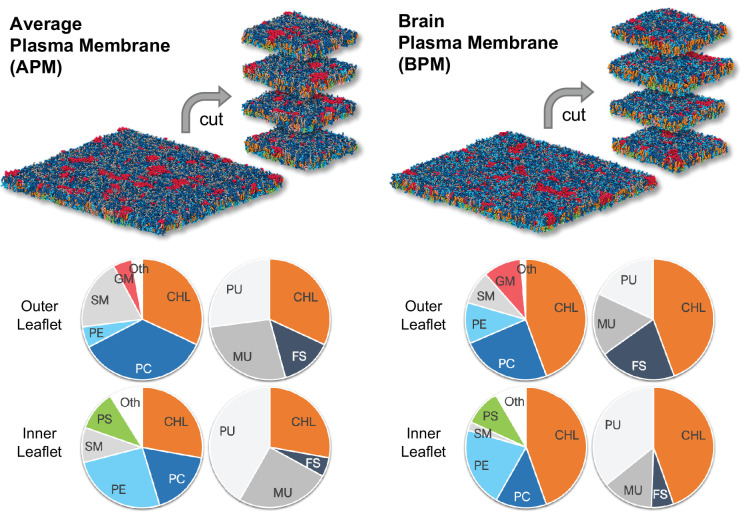
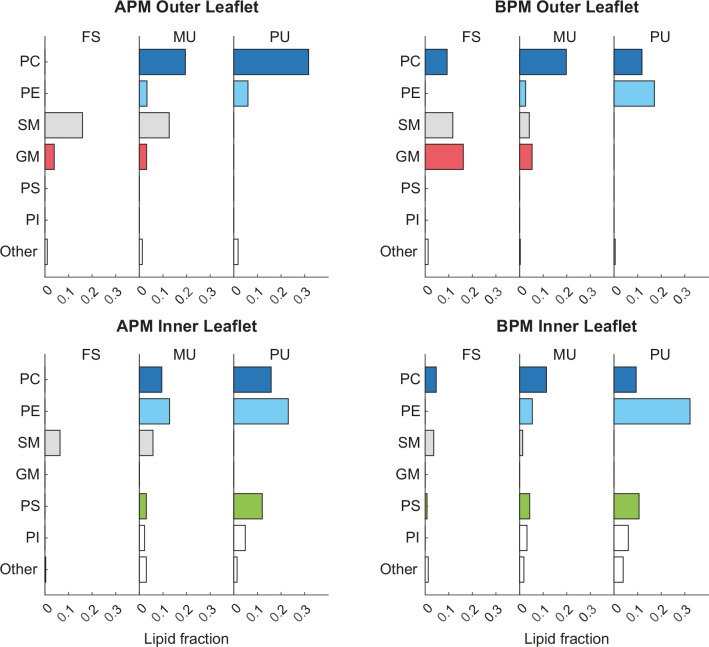
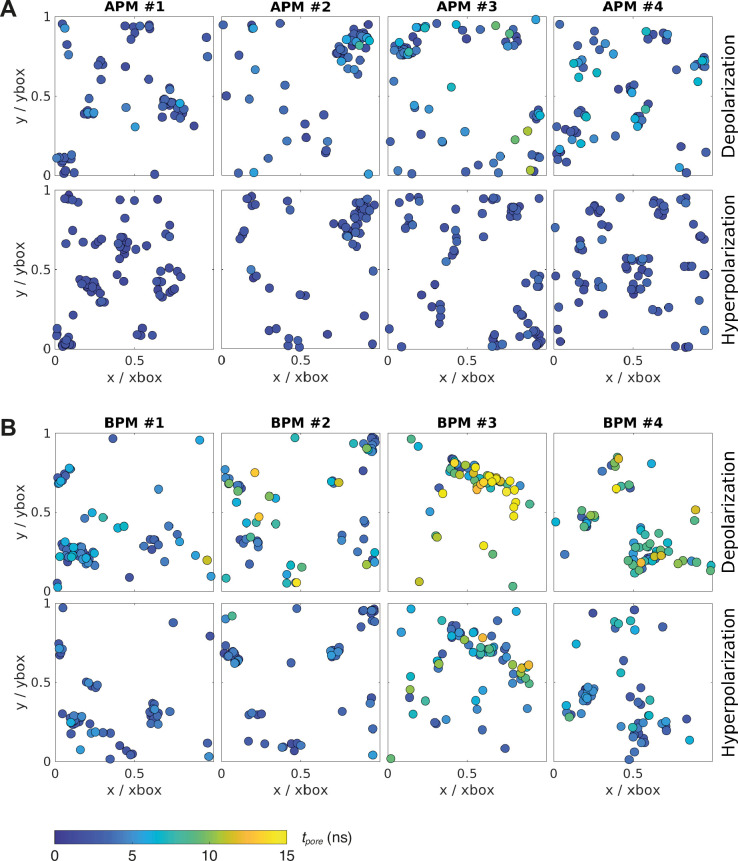
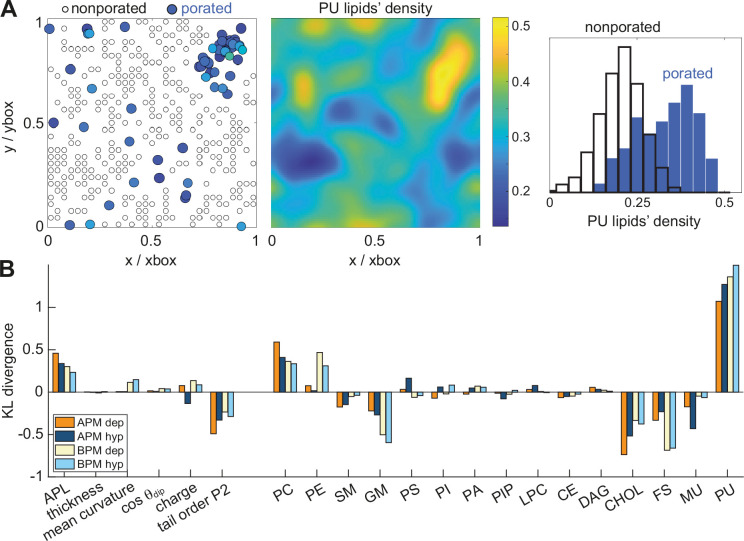
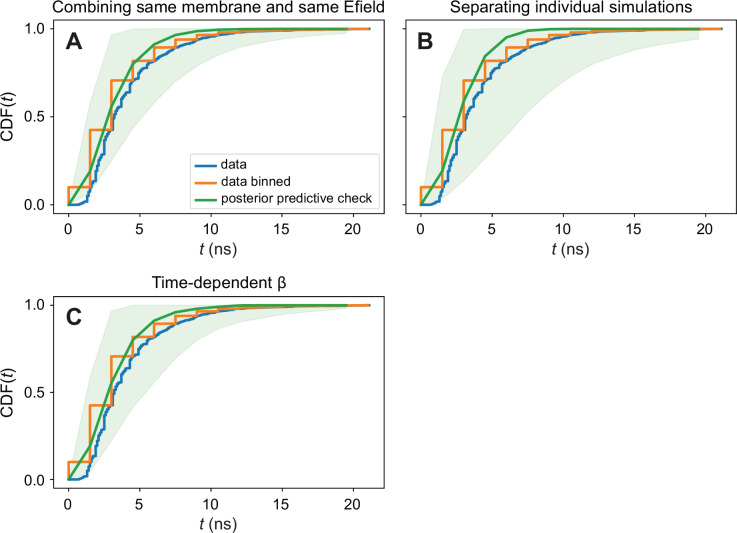
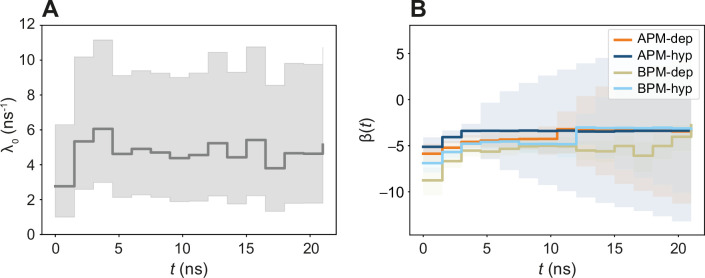
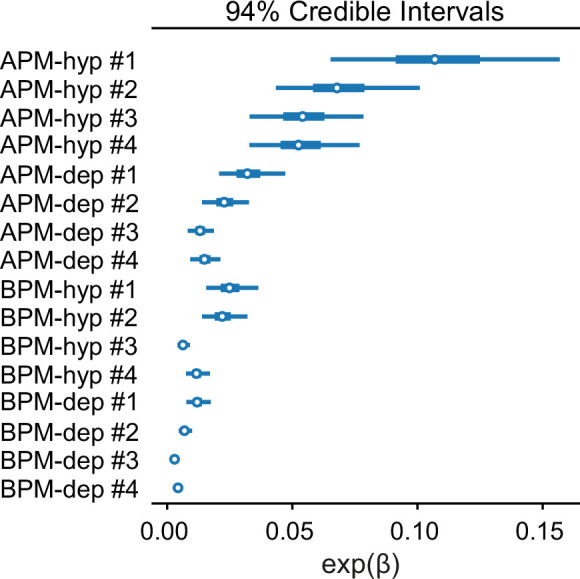
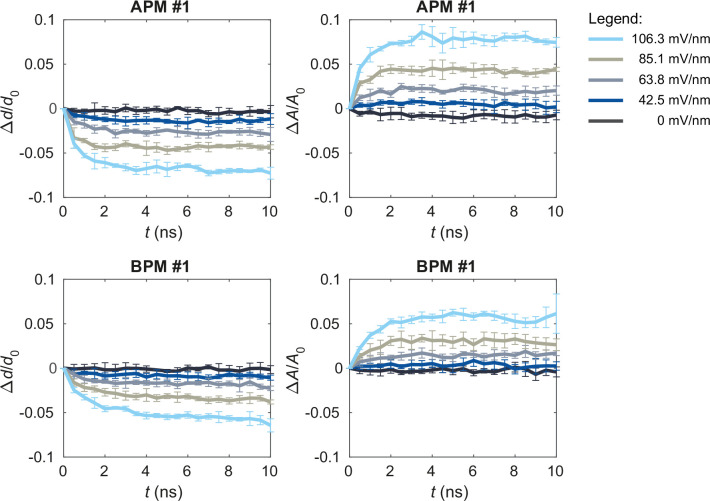
The plasma membrane of a biological cell is a complex assembly of lipids and membrane proteins, which tightly regulate transmembrane transport. When a cell is exposed to strong electric field, the membrane integrity becomes transiently disrupted by formation of transmembrane pores. This phenomenon termed electroporation is already utilized in many rapidly developing applications in medicine including gene therapy, cancer treatment, and treatment of cardiac arrhythmias. However, the molecular mechanisms of electroporation are not yet sufficiently well understood; in particular, it is unclear where exactly pores form in the complex organization of the plasma membrane. In this study, we combine coarse-grained molecular dynamics simulations, machine learning methods, and Bayesian survival analysis to identify how formation of pores depends on the local lipid organization. We show that pores do not form homogeneously across the membrane, but colocalize with domains that have specific features, the most important being high density of polyunsaturated lipids. We further show that knowing the lipid organization is sufficient to reliably predict poration sites with machine learning. Additionally, by analysing poration kinetics with Bayesian survival analysis we show that poration does not depend solely on local lipid arrangement, but also on membrane mechanical properties and the polarity of the electric field. Finally, we discuss how the combination of atomistic and coarse-grained molecular dynamics simulations, machine learning methods, and Bayesian survival analysis can guide the design of future experiments and help us to develop an accurate description of plasma membrane electroporation on the whole-cell level. Achieving this will allow us to shift the optimization of electroporation applications from blind trial-and-error approaches to mechanistic-driven design.

Keywords: electroporation; glycolipids/gangliosides; machine learning; membrane structure; molecular biophysics; molecular dynamics simulations; none; phospholipids; structural biology.


Conflict of interest statement

LR, XT, FZ, SP No competing interests declared, IT, LD Reviewing editor, eLife

Figures

Figure 1.
Figure 1.. The average mammalian and human brain plasma membranes.
Two equilibrated membranes taken from the study of Ingólfsson et al., 2017 were cut into four 30 nm x 30 nm large pieces each. The pie charts show the fraction of lipid subgroups in the inner and outer leaflets of the membranes. CHL, cholesterol; PC, phosphatidylcholine; PE, phosphatidylethanolamine; SM, sphingomyelin; GM, gangliosides; PS, phosphatidylserine; FS, fully saturated lipids; MU, monounsaturated lipids; PU, polyunsaturated lipids. Figure inspired by Ingólfsson et al., 2017.
Figure 1—figure supplement 1.
Figure 1—figure supplement 1.. Fraction of different lipidsin the inner and outer membrane leaflets.
Lipids are separated based on both their headgroup architecture and tail saturation. Cholesterol is not included in the graphs. Graphs on the left and right, respectively, correspond to average plasma membrane (APM) and brain plasma membrane (BPM).
Figure 2.
Figure 2.. Location and kinetics of pore formation in each membrane upon depolarization and hyperpolarization.
The pore locations are expressed relative to the dimensions of the simulation box at the poration time, to correct for the natural fluctuations in the membrane area during the simulation. All data points correspond to the first poration event. The colour of the circle codes for poration time according to the colour bar. (A) Average plasma membranes. (B) Brain plasma membranes.
Figure 3.
Figure 3.. Membrane features that favour and disfavour poration.
(A) (Left) Definition of porated and non-porated locations in one of the membranes; (middle) most pore locations colocalize with increased polyunsaturated lipids density; (right) the corresponding histogram of polyunsaturated lipids density values in porated and non-porated locations. (B) Distances (KL divergence) between probability density estimates of individual features in porated and non-porated locations. The higher the bar, the more the feature influences poration. Positive and negative bars show whether a feature favours or disfavours poration, respectively. APL, area per lipid; PC, phosphatidylcholine; PE, phosphatidylethanolamine; SM, sphingomyelin; GM, gangliosides; PS, phosphatidylserine; PI, phosphatidylinositol; PA, phosphatic acid; PIP, phosphatidylinositol phosphate; LPC, lysolipids; CE, ceramides; DAG, diglycerol; CHL, cholesterol; FS, fully saturated lipids; MU, monounsaturated lipids; PU, polyunsaturated lipids.
Figure 3—figure supplement 1.
Figure 3—figure supplement 1.. Membrane surface fitting with MemSurfer.
(A) Points corresponding the lipid headgroups. (B) Delaunay triangulations. (C, D) Surface smoothed through a Poisson reconstruction approach. (E) Top view of the triangulated surface. (F) Determination of the area per lipid (shaded part).
Figure 3—figure supplement 2.
Figure 3—figure supplement 2.. Kullback–Leibler divergence.
Distances between probability density estimates (KL divergence) of individual features in porated and non-porated locations, calculated according to Equation 7. Graphs are shown separately for the outer and inner leaflet and for the mean of both leaflets, see the titles above each graph. The higher the bar, the more the feature influences poration. Positive and negative bars show whether a feature favours or disfavours poration, respectively. The graphs on the left side correspond to values extracted from a 10-ns-long trajectory before electric field application. The graphs on the right side correspond to values extracted from a 10-ns-long trajectory, where a non-porating electric field of +106.3 mV/nm (analysis for depolarization) or −106.3 mV/nm (analysis for hyperpolarization) was applied.
Figure 4.
Figure 4.. Random forest output.
(A) Comparison between the predicted poration sites (red dots) and real poration sites (yellow dots). Only locations that were classified as porated in >90% of the trajectory frames are shown. (B) Feature importance score for average plasma membrane (APM) and brain plasma membrane (BPM) obtained under hyperpolarization and depolarization. The feature importance score quantifies how much each feature is used in each tree of the random forest.
Figure 5.
Figure 5.. Kinetics of membrane poration.
(A) Probability distribution of the first poration times, sampled from 60 simulations, and approximated with kernel density estimation. (B) The time course of λ0(t). (C) Credible intervals of exp(βi) for average plasma membrane (APM) and brain plasma membrane (BPM) under depolarization and hyperpolarization. (D, E) Correlation between βi and the steady-state relative change in membrane thickness Δd/d0 and projected area ΔA/A0 normalized by E2, extracted from least-square fits presented in Figure 5—figure supplements 5 and 6. Square symbols show the average over all four membranes, whereas the error bars show the range of values in four membranes. The ratio ΔA/A0 / E2 is inversely proportional to the area compressibility (or stretching) modulus (Needham and Hochmuth, 1989).
Figure 5—figure supplement 1.
Figure 5—figure supplement 1.. Posterior predictive checks of the Bayesian inference procedures.
Graphs show the cumulative distribution function of poration times, grouped from all membranes together. We compare the observed data (blue), the observed data with the time discretized in order to be able to use stepwise defined functions in the model (orange), and the data that the model is able to generate (green). The agreement between the input data and the data generated by our modelling is satisfactory. The presented posterior predictive checks are done for (A) combining the different membrane patches of the same membrane type and polarity in the same group; (B) having each membrane fragment as a different group; and (C) for the time-dependent β model.
Figure 5—figure supplement 2.
Figure 5—figure supplement 2.. The time-dependent βi(t) model.
(A) Time evolution of λ0(t). (B) Time evolution of βi(t). Note that the value of βi(t) is slightly different from the ones obtained in the time-independent model in Figure 5. Since all coefficients are parametrized simultaneously with all the data, different combinations of magnitudes of λ0(t) and βi can result in an equivalent λi(t). Therefore, in order to compare how rates increase or decrease in two different systems i and j, only the relative change can be studied λi(t)/λj(t) = exp(βi)/exp(βj).
Figure 5—figure supplement 3.
Figure 5—figure supplement 3.. Credible intervals of exp(βi) separately for each of the eight membranes considered and both electric field polarities.
Figure 5—figure supplement 4.
Figure 5—figure supplement 4.. Upon exposure to electric field, the membranes thin and increase their area.
The graphs show the time courses of the relative changes in average thickness Δd/d0 and projected area ΔA/A0 in one of the average plasma membrane (APM) membranes (first row) and one of the brain plasma membrane (BPM) membranes (second row) when applying non-porating electric fields E of 0, 42.5, 63.8, 85.1, or 106.3 mV/nm. Each curve shows mean ± standard deviation (SD) of 5 simulation runs. The average membrane thickness was obtained by averaging the thickness values computed at all lipid positions by MemSurfer.
Figure 5—figure supplement 5.
Figure 5—figure supplement 5.. Relative change in membrane thickness under non-porating electric fields.
The relationship between the steady-state relative change in the average membrane thickness Δd/d0 and E2, determined from Figure 5—figure supplement 4. Each graph corresponds to one of eight simulated membranes; hyp, hyperpolarization; dep, depolarization.
Figure 5—figure supplement 6.
Figure 5—figure supplement 6.. Relative change in the projected membrane area under non-porating electric fields.
The relationship between the steady-state relative change in the membrane area ΔA/A0 and E2. Graphs were obtained in the same way as for the relative change in membrane thickness, presented in Figure 5—figure supplement 5. The relative increase in the membrane area in steady state is linearly proportional to E2, as expected for Maxwell stress.
Author response image 1.
Author response image 1.. Correlation between membrane thickness and the free energy barrier for creating a 3-nm-radius pore in a lipid bilayer.
Each dot corresponds to one of 18 monocomponent coarse-grained Martini membranes, made from fully saturated and monounsatured lipids with different chain lengths and different headgroups (PC, PE, PS, and PG). Reproduced from data tabulated in (Hu et al., 2015).
Author response image 2.
Author response image 2.. Time course of the induced transmembrane voltage, pore density, and membrane conductivity at the cell pole (q = 0) upon exposure to 1-ms-long electric pulse.
Only the first 10 ms after the onset of the electric pulse are shown for clarity. The results are reproduced from the paper by DeBruin and Krassowska 1999, doi: 10.1016/S0006-3495(99)76973-0.

References

    1. Abraham MJ, Murtola T, Schulz R, Páll S, Smith JC, Hess B, Lindahl E. GROMACS: High performance molecular simulations through multi-level parallelism from laptops to supercomputers. SoftwareX. 2015;1–2:19–25. doi: 10.1016/j.softx.2015.06.001. - DOI - PubMed
    1. Algazi A, Bhatia S, Agarwala S, Molina M, Lewis K, Faries M, Fong L, Levine LP, Franco M, Oglesby A, Ballesteros-Merino C, Bifulco CB, Fox BA, Bannavong D, Talia R, Browning E, Le MH, Pierce RH, Gargosky S, Tsai KK, Twitty C, Daud AI. Intratumoral delivery of tavokinogene telseplasmid yields systemic immune responses in metastatic melanoma patients. Annals of Oncology. 2020;31:532–540. doi: 10.1016/j.annonc.2019.12.008. - DOI - PubMed
    1. Atilla-Gokcumen GE, Muro E, Relat-Goberna J, Sasse S, Bedigian A, Coughlin ML, Garcia-Manyes S, Eggert US. Dividing Cells Regulate Their Lipid Composition and Localization. Cell. 2014;156:428–439. doi: 10.1016/j.cell.2013.12.015. - DOI - PMC - PubMed
    1. Batista Napotnik T, Polajžer T, Miklavčič D. Cell death due to electroporation - A review. Bioelectrochemistry (Amsterdam, Netherlands) 2021;141:107871. doi: 10.1016/j.bioelechem.2021.107871. - DOI - PubMed
    1. Bennett WFD, Sapay N, Tieleman DP. Atomistic Simulations of Pore Formation and Closure in Lipid Bilayers. Biophysical Journal. 2014;106:210–219. doi: 10.1016/j.bpj.2013.11.4486. - DOI - PMC - PubMed

Publication types

MeSH terms