

Spatial Distribution of Mortality for Heart Failure in Brazil, 1996 - 2017
- PMID: 35195207
- PMCID: PMC8959057
- DOI: 10.36660/abc.20201325
Spatial Distribution of Mortality for Heart Failure in Brazil, 1996 - 2017
Abstract
Background: Heart failure (HF) is a leading cause of mortality and morbidity worldwide, and is associated with the high use of resources and healthcare costs. In Brazil, the HF prevalence is around 2 million patients, and its incidence is of approximately 240,000 new cases per year.
Objective: The present investigation aimed to analyze the spatiotemporal trend of mortality caused by HF in Brazil, from 1996 to 2017.
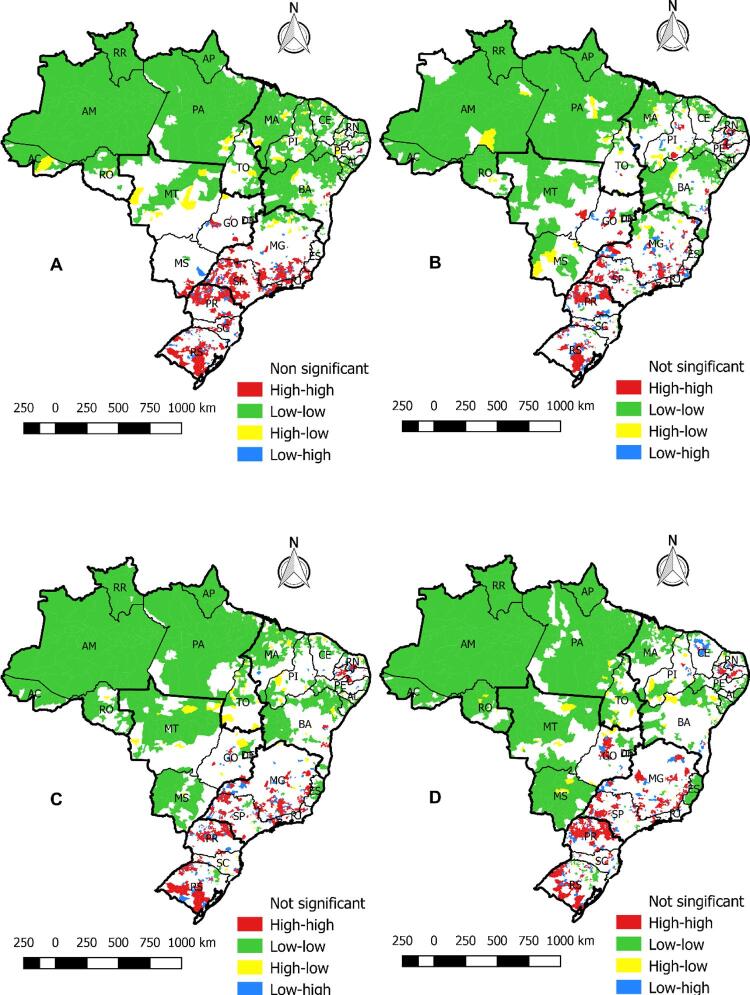
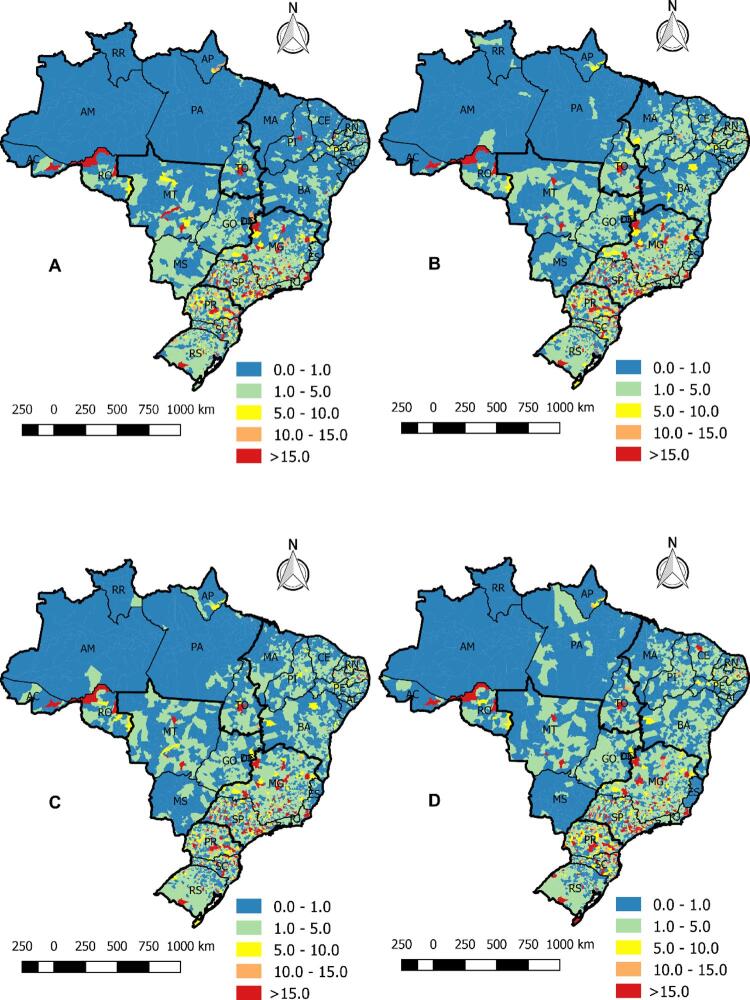
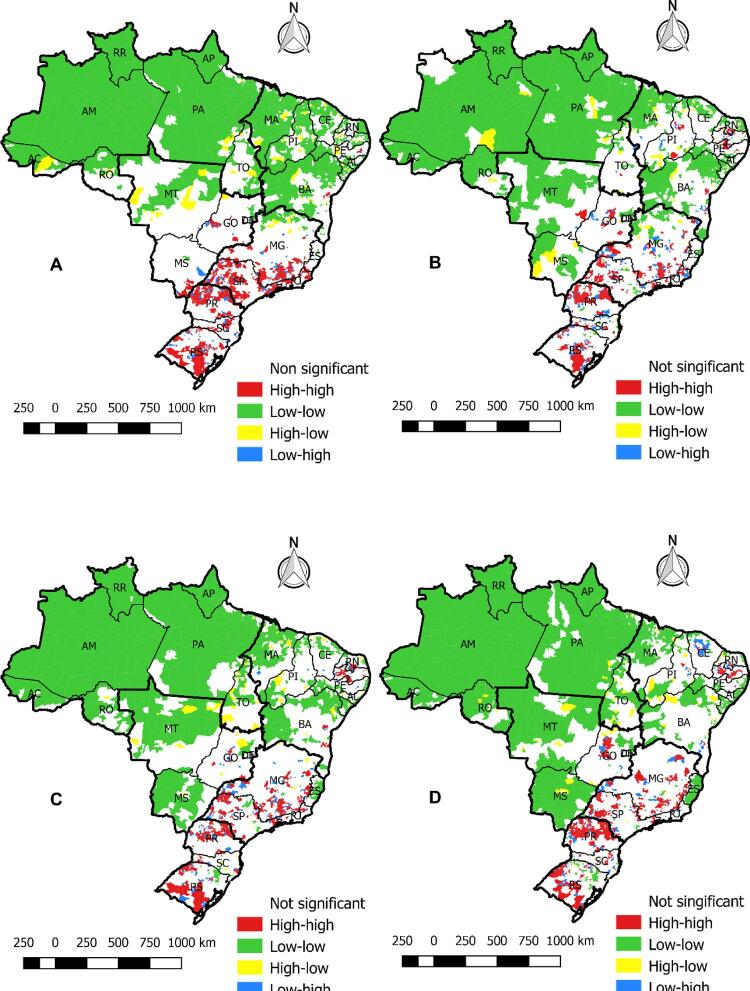
Methods: This is an ecological study developed with secondary data on HF mortality in Brazil. During the period, 1,242,014 cases of death caused by heart failure were analyzed. The existence of spatial autocorrelation of cases was calculated using the Global Moran Index (GMI) and, when significant, the Local Moran Index, considering p<0.05. The relative risk of the clusters was calculated.
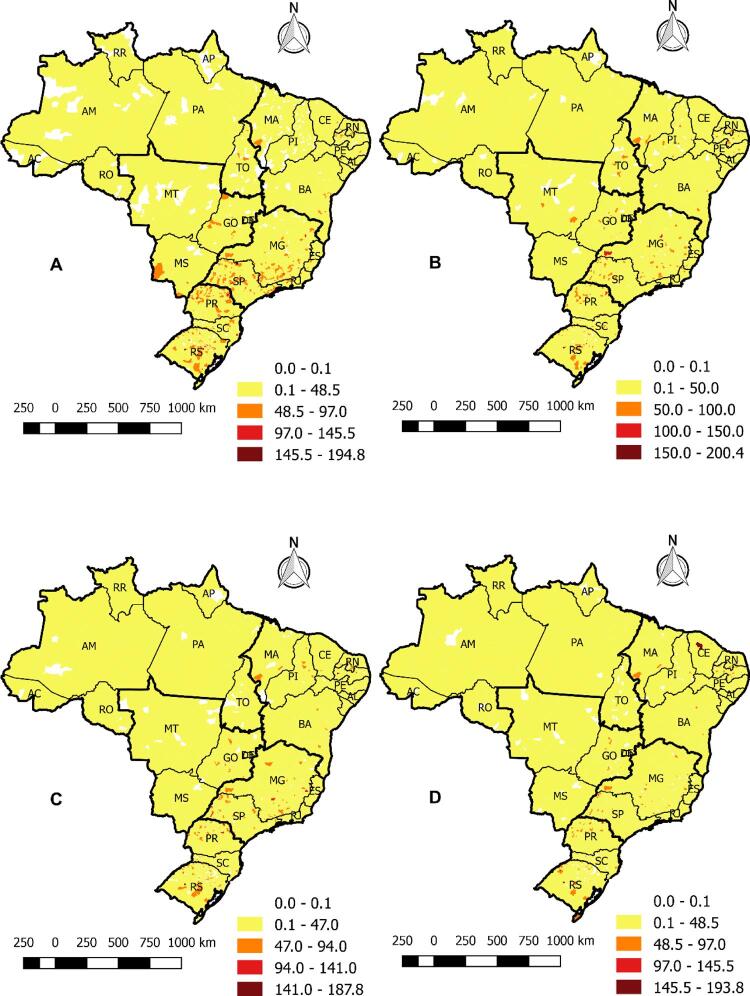
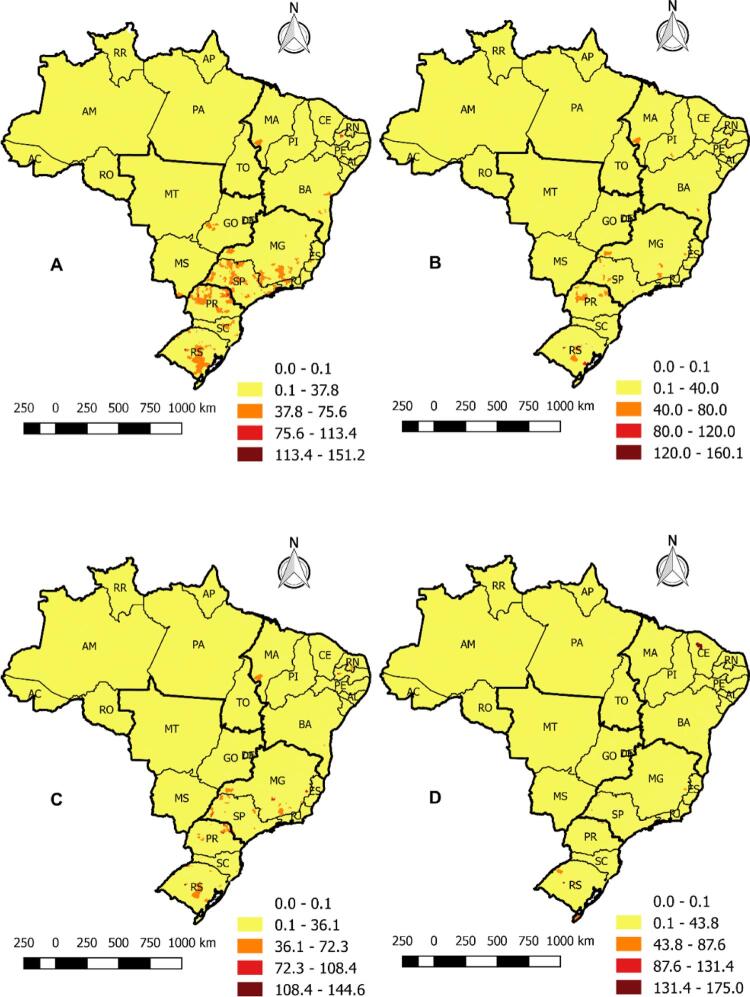
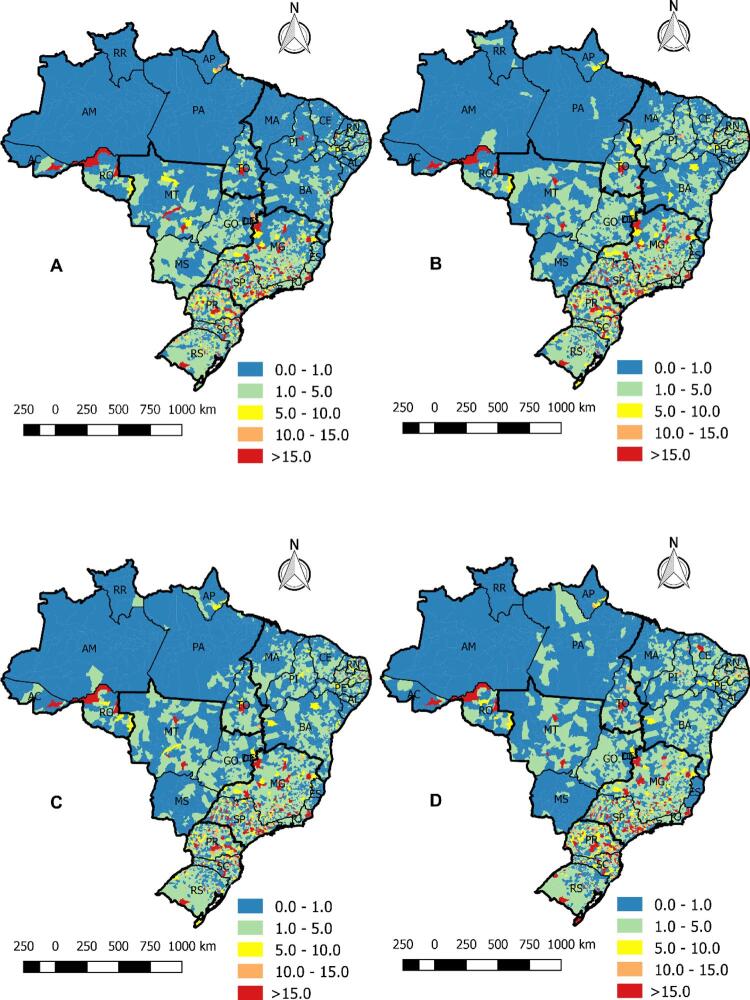
Results: The mortality rate due to HF was diversified in all Brazilian regions, with an emphasis in the South, Southeast, and Northeast. The GMI indicated positive spatial autocorrelation (p=0.01) in all periods. Municipalities located in the South, Southeast, Northeast, and Midwest showed a higher Relative Risk for mortality from HF, and most municipalities in the North were classified as a protective factor against this cause of death.
Conclusions: The study showed a decline in mortality rates across the national territory. The highest concentration of mortality rates is in the North and Northeast regions, highlighting priority vulnerable areas in the planning and controlling strategies of health services.
Fundamento: Insuficiência cardíaca (IC) é uma das principais causas de mortalidade e morbidade no mundo, e está associada ao alto uso de recursos e custos com saúde. No Brasil, a prevalência de IC é de aproximadamente 2 milhões de pacientes, e sua incidência é de aproximadamente 240.000 novos casos por ano.
Objetivo: A investigação objetivou analisar a tendência espaço-temporal da mortalidade causada por IC no Brasil, de 1996 a 2017.
Métodos: Este é um estudo ecológico desenvolvido com dados secundários sobre mortalidade por IC no Brasil. Durante o período, 1.242.014 casos de morte causada por IC foram analisados. A existência da autocorrelação espacial de casos foi calculada utilizando o Índice de Moran Global (IMG) e, quando significativo, o Índice de Moran Local, considerando p <0,05. O risco relativo dos grupos foi calculado.
Resultados: A taxa de mortalidade causada por IC foi diversificada em regiões brasileiras, com ênfase no sul, sudeste e nordeste. O IMG indicou autocorrelação espacial positiva (p=0,01) em todos os períodos. Cidades localizadas no sul, sudeste, nordeste e centro-oeste mostraram maior risco relativo para mortalidade causada por IC, e a maioria das cidades do norte foi classificada como um fator protetivo contra esta causa de morte.
Conclusões: O estudo demonstrou declínio nas taxas de mortalidade no território nacional. A maior concentração de taxas de mortalidade está nas regiões norte e nordeste, enfatizando as áreas prioritárias de vulnerabilidade no planejamento e estratégias de controle de serviços de saúde.
Conflict of interest statement
Potencial conflito de interesse
Não há conflito com o presente artigo
Figures


References
-
- Aoyanagi H, Nochioka K, Sakata Y, Miura M, Shiroto T, Abe R, et al. Temporal Changes in Left Ventricular Ejection Fraction and Their Prognostic Impacts in Patients with Stage B Heart Failure. Int J Cardiol. 2020;306:123-32. doi: 10.1016/j.ijcard.2020.02.040. - PubMed
MeSH terms
LinkOut - more resources
Full Text Sources
Medical
Research Materials
Miscellaneous
