. 2022 May;9(13):e2104888.
doi: 10.1002/advs.202104888. Epub 2022 Feb 23.

Discovery and Application of Postnatal Nucleus Pulposus Progenitors Essential for Intervertebral Disc Homeostasis and Degeneration

Affiliations

Discovery and Application of Postnatal Nucleus Pulposus Progenitors Essential for Intervertebral Disc Homeostasis and Degeneration

Bo Gao et al. Adv Sci (Weinh). 2022 May.

Abstract

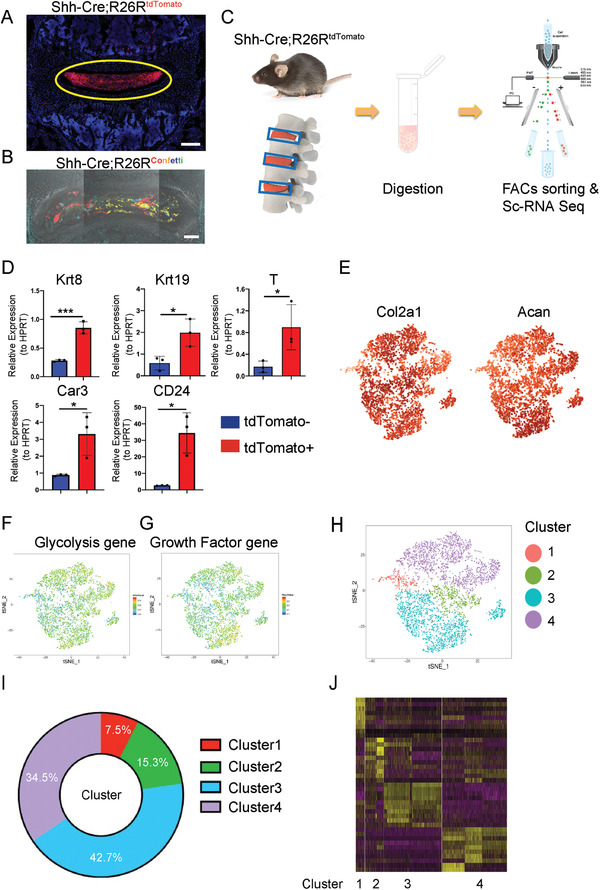
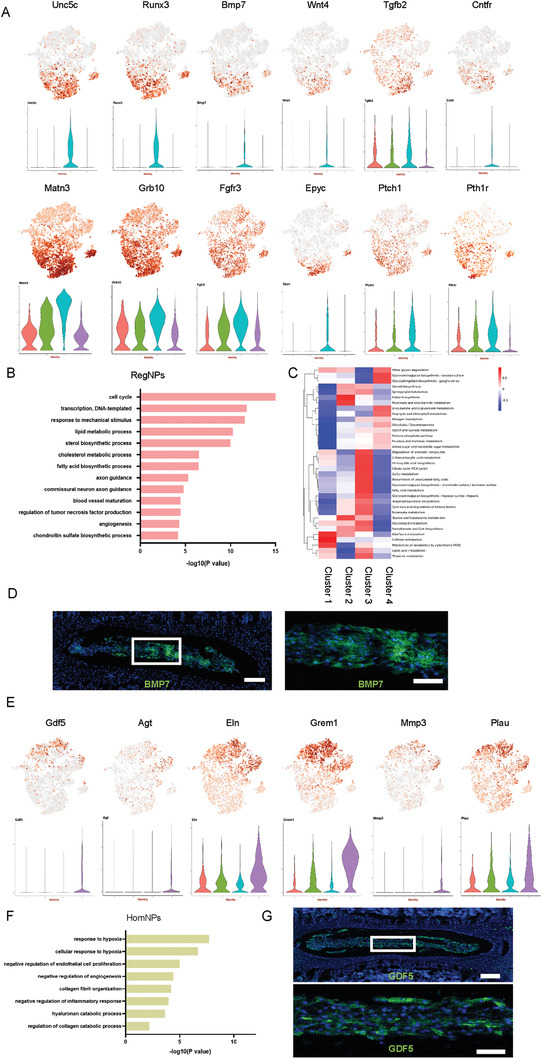
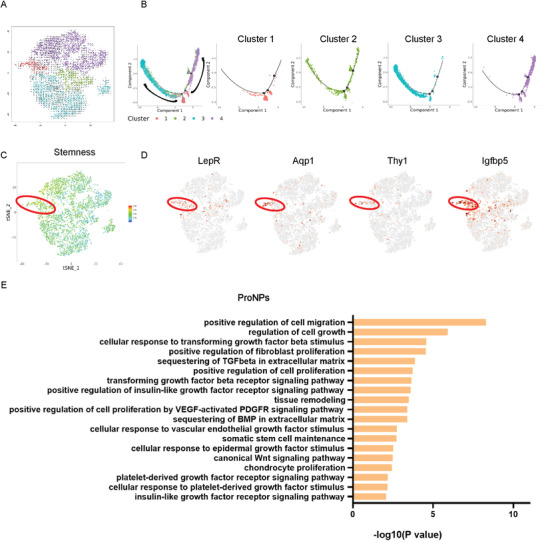
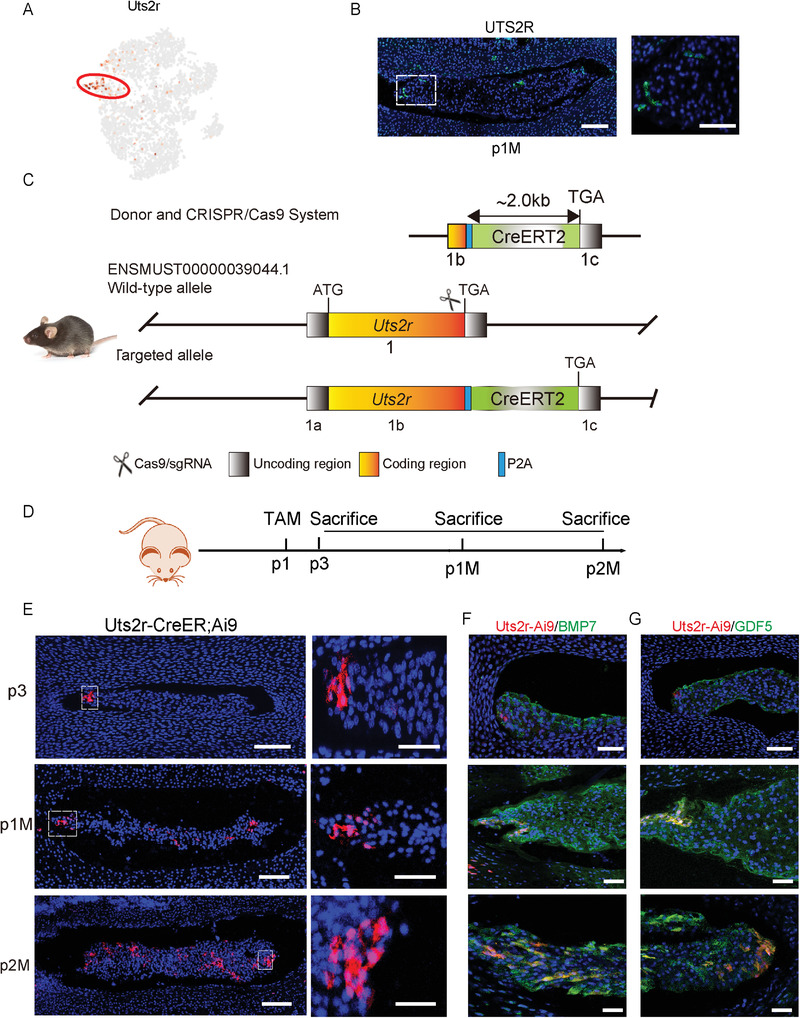
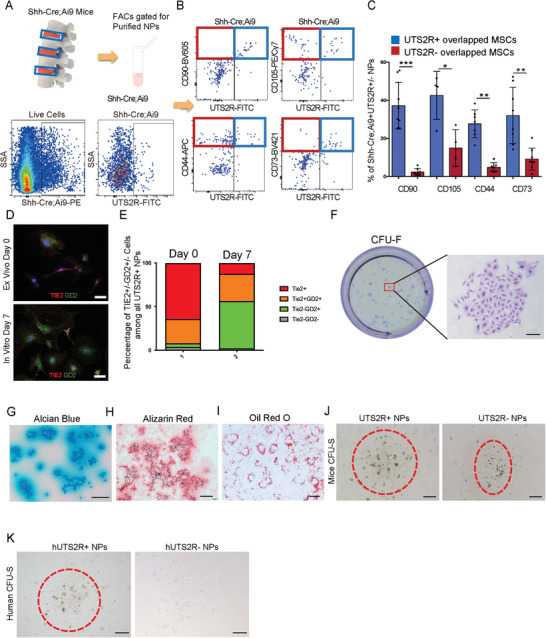
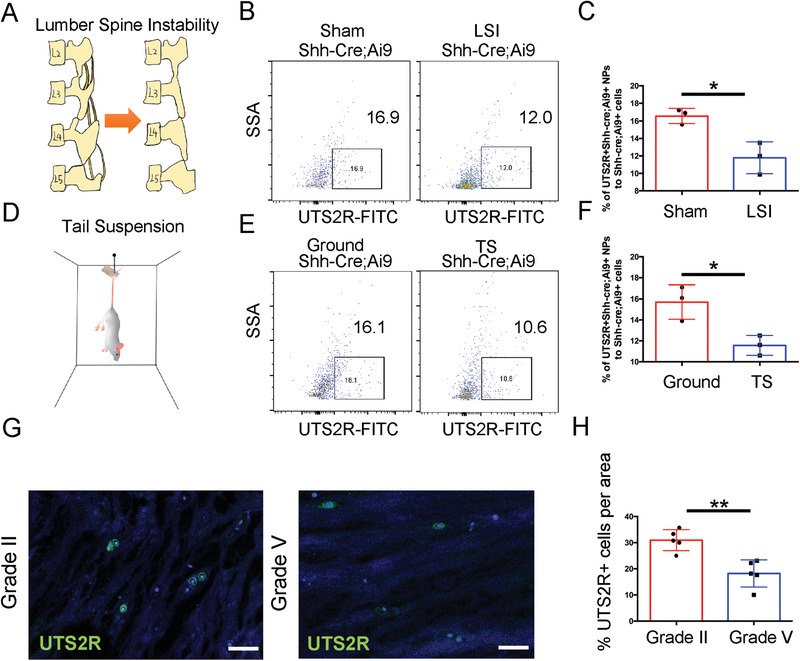
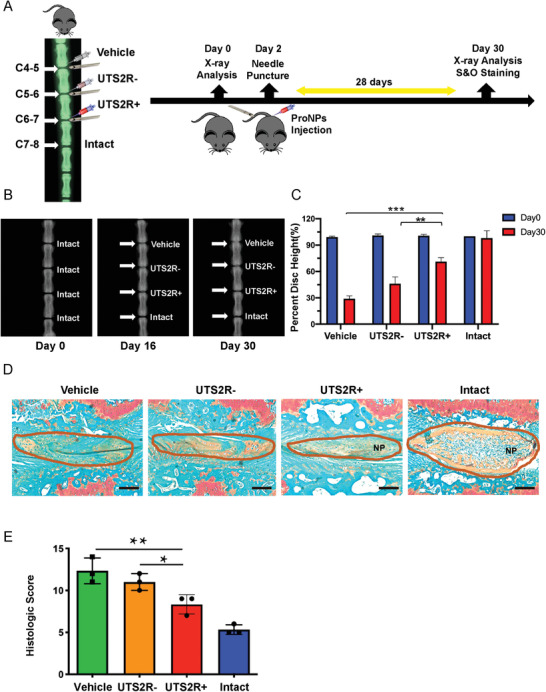
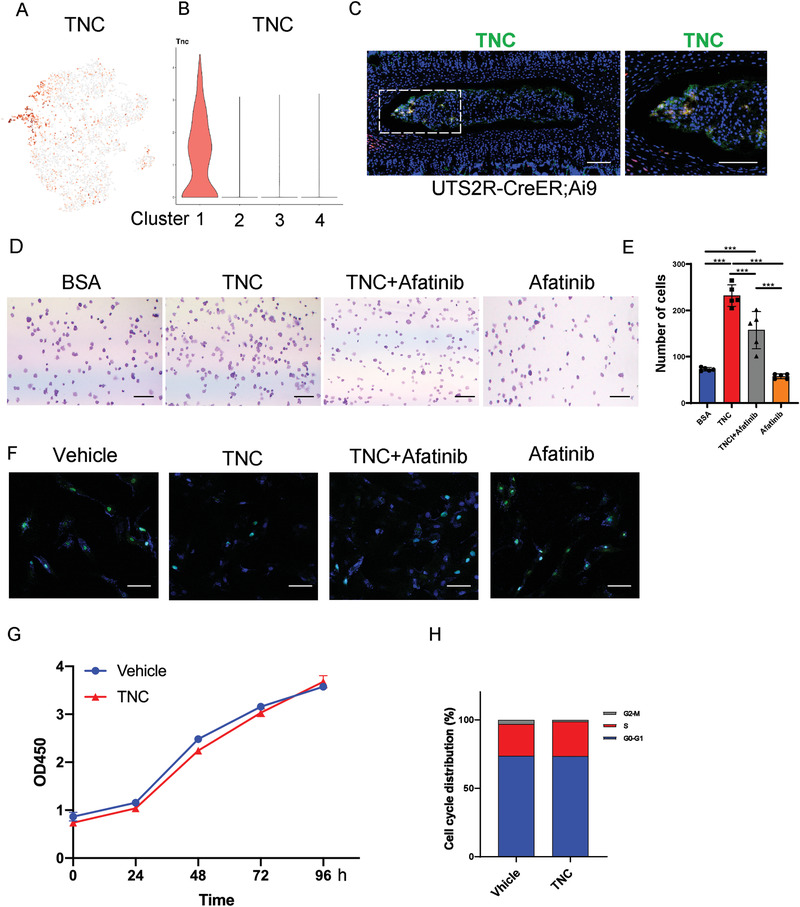
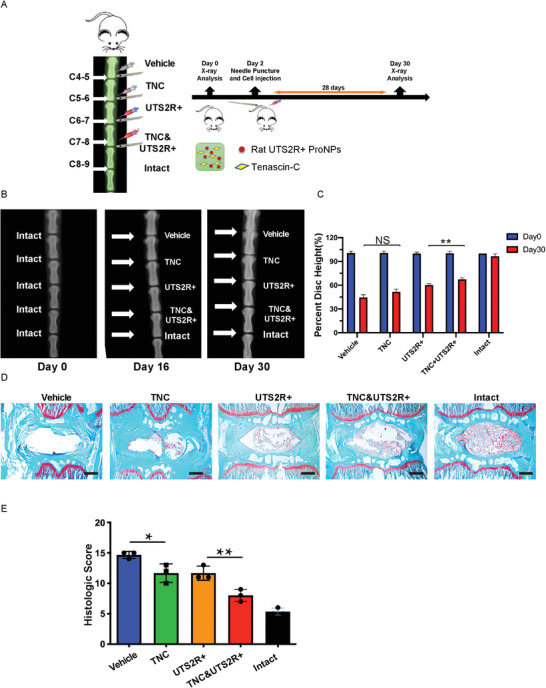
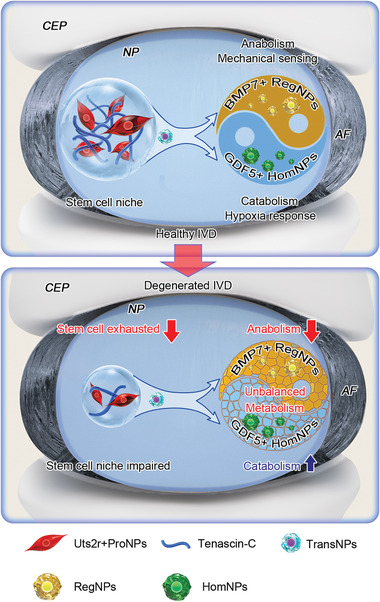
Intervertebral disc degeneration (IDD) results from the dysfunction of nucleus pulposus (NP) cells and the exhaustion of NP progenitors (ProNPs). The cellular applications of NP cells during IDD are currently limited due to the lack of in vivo studies showing whether NP cells are heterogeneous and contain ProNPs throughout postnatal stages. In this study, single-cell RNA sequencing of purified NP cells is used to map four molecularly defined populations and urotensin II receptor (UTS2R)-expressing postnatal ProNPs is identified, which are markedly exhausted during IDD, in mouse and human specimens. The lineage tracing shows that UTS2R+ ProNPs preferentially resides in the NP periphery with its niche factor tenascin-C and give rise to functional NP cells. It is also demonstrated that transplanting UTS2R+ ProNPs with tenascin-C into injured intervertebral discs attenuate the progression of IDD. The study provides a novel NP cell atlas, identified resident ProNPs with regenerative potential, and revealed promising diagnostic and therapeutic targets for IDD.

Keywords: Sc-RNA seq; intervertebral disc; lineage tracing; nucleus pulposus cell atlas; stem cell therapy.


Conflict of interest statement

The authors declare no conflict of interest.

Figures

Figure 1
Figure 1
Single‐cell RNA sequencing analysis of murine NP cells from Shh‐Cre;R26RtdTomato mice. A) Representative images of lumbar sections from 4‐week‐old Shh‐Cre;R26RtdTomato mice. The yellow circle shows NP tissue. Scale bars, 100 µm. B) Representative image of lumbar sections from 4‐week‐old Shh‐Cre; R26Rconfetti mice. Scale bars, 100 µm. C) Schematic workflow of the experimental strategy. Purified NP cells were isolated from Shh‐Cre;R26RtdTomato mice, enzymatically digested, and FACS‐sorted to isolate tdTomato+ cells, which then underwent single‐cell RNA sequencing analysis via BD Rhapsody. D) qRT‐PCR of expression of NP marker genes, including Krt8, Krt19, T, Car3, and CD24 related to HPRT in Shh‐Cre;R26RtdTomato+ and Shh‐Cre;R26RtdTomato‐ cells. E) Dot plots showing the expression of Col2a1 and Acan within the t‐SNE map. F,G) t‐SNE plots of glycolysis gene (F) and growth factor gene (G) distribution. H) Representative image of t‐SNE analysis showing the four clusters of Shh‐Cre;Ai9+ NP cells. (I) Relative percentage of each cluster among Shh‐Cre;Ai9 NP cells. J) Heatmap revealing the scaled expression of differentially expressed genes for each cluster. n = 3. Data are presented as mean ± standard deviation. * P < 0.05, ** P < 0.01; N.S., not significant as determined by two‐tailed Student t tests.
Figure 2
Figure 2
RegNPs were a metabolically active and mechanically sensitive population, while HomNPs were sensitive to hypoxia with “degenerative” potential. A) t‐SNE plots and representative violin plots showing the expression of Unc5c, Runx3, Bmp7, Wnt4, Tgfb2, CNTFR, Matn3, Grb10, Fgfr3, Epyc, Ptch1, and Pth1r on the t‐SNE map. B) Representation analysis of GO categories showing different functions for RegNPs. C) Heatmap revealing metabolic‐related functions and pathways for RegNPs. D) Representative images of lumbar spine sections from 4‐week‐old wild‐type mice stained for BMP7. Scale bars, 100 µm (n = 3 mice per group). E) t‐SNE plots and representative violin plots showing the expression of Gdf5, Agt, Eln, Grem1, Mmp3, and Plau on the t‐SNE map. F) Representative analysis of GO categories showing different functions for HomNPs. G) Representative images of lumbar spine sections from 4‐week‐old WT mice stained for GDF5. The lower image shows a high‐magnification view of the indicated area from the upper image. Scale bars, 100 µm (n = 3 mice per group).
Figure 3
Figure 3
Characterization of potential NP cell progenitors in Cluster 1. A) Velocity image showing the potential trajectories among NP subpopulations. B) Monocle pseudospace trajectories revealing the NP cell lineage progression colored according to cell types. C) Stemness analysis of NP cell subpopulations using mesenchymal stem/progenitor cell markers. D) Dot plots showing the expression of LepR, Aqp1, Thy1, and Igfbp5 on the t‐SNE map. E) Representation analysis of GO categories showing different functions for ProNPs.
Figure 4
Figure 4
Lineage tracing of UTS2R+ NP cells. A) Dot plot showing the expression of Uts2r on the t‐SNE map. B) Representative immunofluorescence imaging of UTS2R (green) in postnatal 1‐month‐old WT mice. The right image shows high magnification of the indicated area from the left image (n = 3 mice per group). Scale bars, 100 µm. C) Construction strategy of Uts2r‐CreER transgenic mice using the CRISPR/Cas9 System. D) Diagram showing postnatal day 1 (P1) Uts2r‐CreER;Ai9/+ mice administered with one dosage tamoxifen and sacrificed at postnatal day 3 (P3), 1 month (P1M), or 2 months (P2M). E) Representative immunofluorescence imaging of Uts2r‐CreER;Ai9+ cells (red). The right images show high magnification of the indicated area from the left image (n = 3 mice per group). Scale bars, 100 µm. F,G) Representative immunofluorescence imaging of Uts2r‐CreER;Ai9+ cells (red), BMP7 (green) (F) or GDF5 (green) (G). The right images show high magnification of the indicated area from the left image (n = 3 mice per group). Scale bars, 100 µm.
Figure 5
Figure 5
Identification of UTS2R+ NP cell progenitors in Cluster 1. A,B) Diagram of isolating (A) and FACS gating strategy of Shh‐Cre;Ai9+UTS2R+ ProNPs (B). C) Quantification of the percentage of ProNPs expressing markers of mesenchymal stem/progenitor cells in 4‐week‐old Shh‐Cre;Ai9 mice, n ≥ 4. D) Representative immunofluorescence staining of Tie2 and GD2 in murine UTS2R+ NP cells from the ex vivo plated group and the in vitro 7‐day cultured group. Cells were sorted by isolating disc cells from 4‐week‐old Shh‐Ai9 mice and gating on the Shh‐Ai9+UTS2R+ channel. E) Quantification of Tie2+, Tie2+GD2+, Tie2GD2+, and Tie2GD2 cells in all sorted murine UTS2R NP cells. F) Crystal violet staining revealing the CFU‐F‐forming ability of rat UTS2R+ ProNPs. G–I) Alcian blue (G), Alizarin Red (H), and Oil Red O staining (I) of rat ProNPs under chondrogenic, osteogenic, or adipogenic differentiation conditions. J,K) CFU‐sphere‐forming ability of UTS2R+ and UTS2R NP cells isolated from rat (J) and human specimens (K). Data are presented as mean ± standard deviation. * P < 0.05, ** P < 0.01; N.S., not significant as determined by ANOVA.
Figure 6
Figure 6
ProNPs were exhausted during intervertebral disc degeneration. A) LSI model was established in 4‐week‐old Shh‐Cre;Ai9 mice. B,C) FACS analysis and quantification of Shh‐Cre;Ai9+UTS2R+ NP cells in Shh‐Cre;Ai9 mice from Sham (control) and LSI groups. D) Tail suspension model was established in 4‐week‐old Shh‐Cre;Ai9 mice. E,F) FACS analysis and quantification of Shh‐Cre;Ai9+UTS2R+ NP cells in Shh‐Cre;Ai9 mice from Ground (control) and TS groups. G,H) Immunofluorescence staining and representative quantification data of UTS2R+ cells in human NP specimens at different degeneration levels. n = 3. Data are presented as mean ± standard deviation. * P < 0.05, ** P < 0.01; N.S., not significant as determined by two‐tailed Student t tests.
Figure 7
Figure 7
Transplantation of murine UTS2R+ ProNPs attenuated injury‐induced intervertebral disc degeneration. A) Diagram of the experimental outline displaying the time‐point and procedure of establishing caudal spine injury models and transplanting UTS2R+/− NP cells. B,C) X‐ray scan and quantification revealing the caudal disc space and height between vehicle‐treated, UTS2R NP–transplanted, UTS2R+ NP–transplanted, and intact groups. UTS2R+/− NP cells were FACS‐sorted from 1‐month‐old Shh‐Cre;Ai9 mice. D,E) Safranin O/Fast Green staining (D) and the Histologic Score (E) revealing the progress of injury‐induced IDD between vehicle‐treated, UTS2R NP–transplanted, UTS2R+ NP–transplanted, and intact groups. Scale bars, 100 µm. n = 3. Data are presented as mean ± standard deviation. * P < 0.05, ** P < 0.01, *** P < 0.001 as determined by ANOVA.
Figure 8
Figure 8
Tenascin‐C was expressed in the ProNPs niche and maintained homeostasis. A,B) Dot plot (A) and representative violin plot (B) showing the expression of TNC in Clusters 1–4. C) Representative immunofluorescence imaging of Uts2r‐CreER;Ai9+ cells (red) and TNC (green) in postnatal 1‐month‐old Uts2r‐CreER;Ai9/+ mice traced from P3. The right image shows high magnification of the indicated area from the left image (n = 3 mice per group). Scale bars, 100 µm. D,E) Cell adhesion analysis (D) and quantification (E) of rat UTS2R+ NP cells. FACS‐sorted UTS2R+ NP cells cultured on a plate pre‐coated with BSA (control), 500 ng mL−1 TNC, 500 ng mL−1 TNC + 10 × 10−6 m Afatinib, and 10 × 10−6 m Afatinib alone for 24 h. F) TUNEL staining of rat UTS2R+ NP cells cultured with a vehicle, 500 ng mL−1 TNC, 500 ng mL−1 TNC + 10 × 10−6 m Afatinib, and 10 × 10−6 m Afatinib under serum‐free‐induced apoptosis for 12 h. G,H) CCK8 (G) and Cell cycle analysis (H) of rat UTS2R+ NP cells cultured with or without 500 ng mL−1 TNC. n = 3. Data are presented as mean ± standard deviation. * P < 0.05, ** P < 0.01, *** P < 0.001 as determined by ANOVA.
Figure 9
Figure 9
UTS2R+ ProNPs combined with tenascin‐C was a promising therapeutic to attenuate IDD. A) Diagram of the experiment outline displaying the time points and procedure of establishing the caudal spine injury model and transplanting rat UTS2R+ NP cells embedded with/without tenascin‐C (TNC). B,C) X‐ray scan and quantification revealing the caudal disc space and height between vehicle‐treated, TNC‐treated, UTS2R+ NP–transplanted, UTS2R+ NP cells embedded with TNC transplanted, and intact groups. D,E) Safranin O and Fast Green staining (D) and the Histologic Score (E) revealing the progress of injury‐induced IDD between vehicle‐treated, TNC‐treated, UTS2R+ NP–transplanted, UTS2R+ NP cells embedded with TNC transplanted, and intact groups. n = 3. Data are presented as mean ± standard deviation. * P < 0.05;** P < 0.01; N.S., not significant as determined by ANOVA.
Figure 10
Figure 10
Diagram showing the role and function of NP cell subpopulations during IVD homeostasis and degeneration.

References

    1. Driscoll T., Jacklyn G., Orchard J., Passmore E., Vos T., Freedman G., Lim S., Punnett L., Ann. Rheum. Dis. 2014, 73, 975. - PubMed
    1. Hoy D., March L., Brooks P., Blyth F., Woolf A., Bain C., Williams G., Smith E., Vos T., Barendregt J., Murray C., Burstein R., Buchbinder R., Ann. Rheum. Dis. 2014, 73, 968. - PubMed
    1. Grøvle L., Haugen A. J., Natvig B., Brox J. I., Grotle M., Eur. Spine J. 2013, 22, 2488. - PMC - PubMed
    1. Kido T., Okuyama K., Chiba M., Sasaki H., Seki N., Kamo K., Miyakoshi N., Shimada Y., J. Orthop. Sci. 2016, 21, 419. - PubMed
    1. Gorth D. J., Shapiro I. M., Risbud M. V., Cell Death Dis. 2018, 10, 7. - PMC - PubMed

Publication types

LinkOut - more resources