. 2022 Feb 25;8(8):eabm1831.
doi: 10.1126/sciadv.abm1831. Epub 2022 Feb 23.

Longitudinal single-cell RNA-seq analysis reveals stress-promoted chemoresistance in metastatic ovarian cancer

Affiliations

Longitudinal single-cell RNA-seq analysis reveals stress-promoted chemoresistance in metastatic ovarian cancer

Kaiyang Zhang et al. Sci Adv. .

Abstract

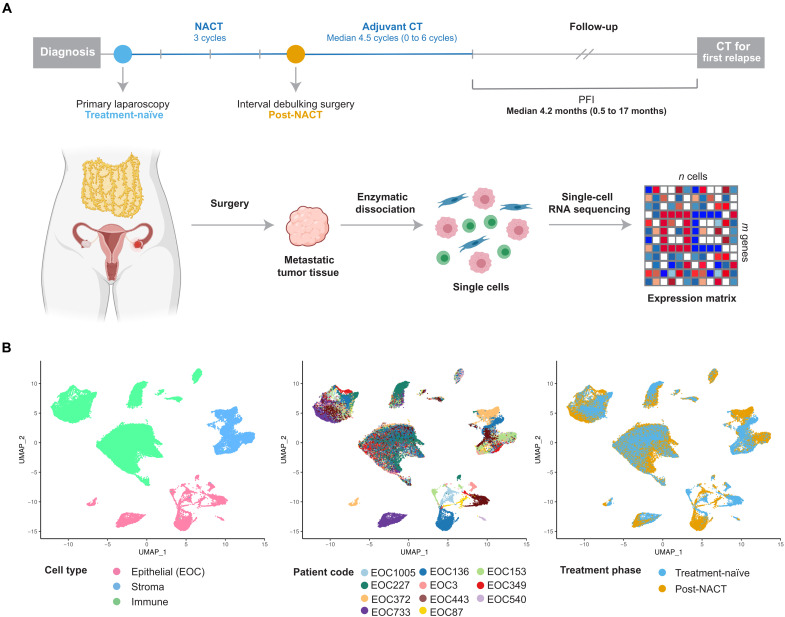
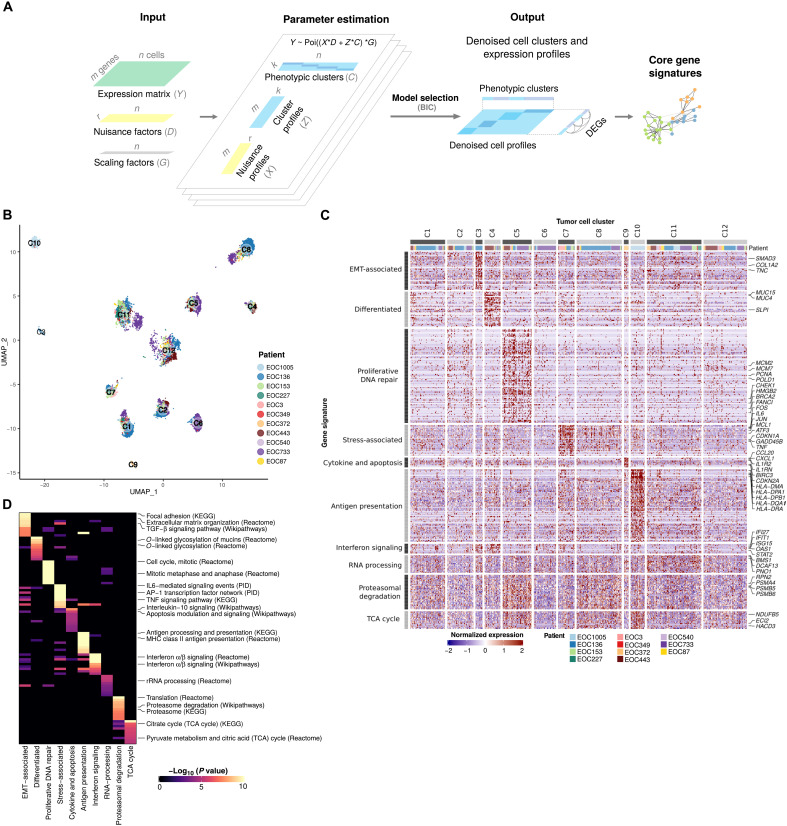
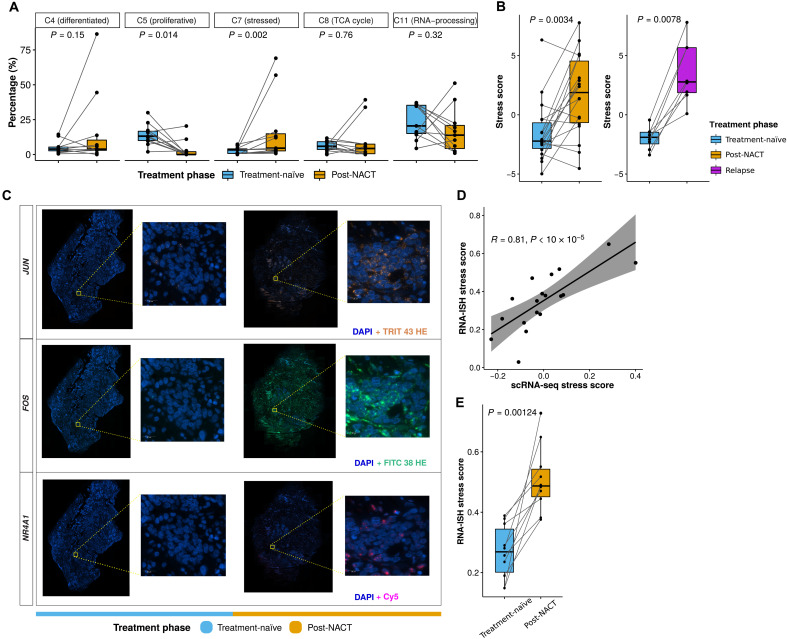
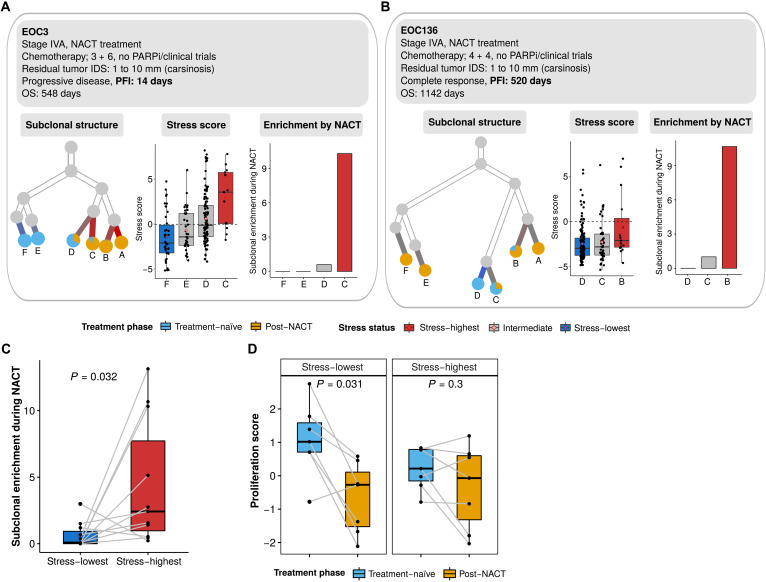
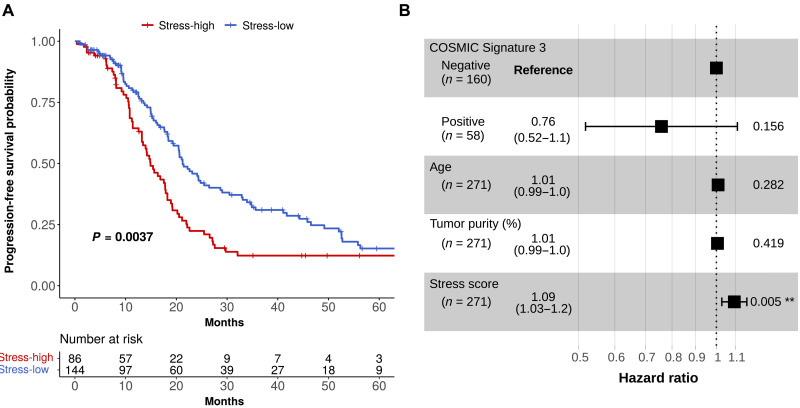
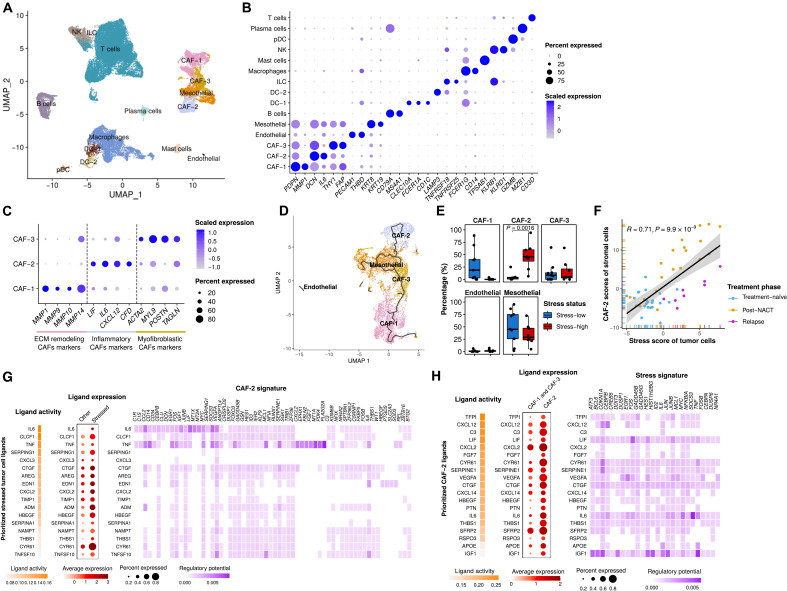
Chemotherapy resistance is a critical contributor to cancer mortality and thus an urgent unmet challenge in oncology. To characterize chemotherapy resistance processes in high-grade serous ovarian cancer, we prospectively collected tissue samples before and after chemotherapy and analyzed their transcriptomic profiles at a single-cell resolution. After removing patient-specific signals by a novel analysis approach, PRIMUS, we found a consistent increase in stress-associated cell state during chemotherapy, which was validated by RNA in situ hybridization and bulk RNA sequencing. The stress-associated state exists before chemotherapy, is subclonally enriched during the treatment, and associates with poor progression-free survival. Co-occurrence with an inflammatory cancer-associated fibroblast subtype in tumors implies that chemotherapy is associated with stress response in both cancer cells and stroma, driving a paracrine feed-forward loop. In summary, we have found a resistant state that integrates stromal signaling and subclonal evolution and offers targets to overcome chemotherapy resistance.


Figures

Fig. 1.
Fig. 1.. Overview of experimental and sequencing workflow.
(A) Diagram showing the sample collection and processing. We collected prospective tumor samples from 11 patients with HGSOC before and after NACT. The median PFI in the cohort was 4.2 months. scRNA-seq was performed on dissociated solid tumor specimens using the 10x Genomics Chromium platform. (B) Uniform manifold approximation and projection (UMAP) plot of all cells (n = 51,786) passing the quality control, colored by cell type, patient code, and treatment phase. EOC, epithelial ovarian carcinoma.
Fig. 2.
Fig. 2.. Identification of 12 subpopulations of HGSOC cancer cells characterized by 10 gene signatures.
(A) Schematic of the PRIMUS model. PRIMUS models the observed single-cell expression profiles (Y) as a mixture of latent phenotypic cluster profiles and nuisance profiles. Given Y, the known nuisance factors D, known size factors G, and the number of latent phenotypic clusters k, PRIMUS estimates the latent nuisance profiles X, latent phenotypic cluster profiles Z, and the latent cluster memberships C using an expectation-maximization (EM) algorithm. (B) UMAP plot of cancer cells after removing the nuisance signals, colored by patient and labeled by the identified clusters. (C) Heatmap of the expression of the 10 distinct gene signatures in the 12 identified cell clusters. Rows correspond to genes and columns to cells. (D) Heatmap shows the top 10 pathways enriched in each gene signature. TGF-β, transforming growth factor–β; AP1, activating protein 1; TNF, tumor necrosis factor; rRNA, ribosomal RNA; KEGG, Kyoto Encyclopedia of Genes and Genomes; PID, the Pathway Interaction Database.
Fig. 3.
Fig. 3.. Stress-associated transcriptional profile is enriched after chemotherapy.
(A) Boxplots showing the fractional changes of the five tumor clusters containing cells from multiple patients, between the treatment-naïve (blue) and post-NACT (yellow) samples of each patient (paired Wilcoxon rank-sum test). Horizontal bars show median values, box edges represent the interquartile range, and each dot represents a sample. (B) Boxplots comparing the stress scores in treatment-naïve (blue) versus post-NACT (yellow) samples (left; paired Wilcoxon rank-sum test, P = 0.0034), and treatment-naïve (blue) versus relapse (purple) samples (right; paired Wilcoxon rank-sum test, P = 0.0078) using bulk RNA-seq data from the HERCULES cohort. Horizontal bars show median values, box edges represent the interquartile range, and each dot represents a sample. (C) Representative RNA-ISH images showing the changes of NR4A1, FOS, and JUN from the treatment-naïve to post-NACT sample of patient EOC87. Scale bars, 20 μm. (D) Scatter plot showing the correlation (R = 0.81, permutation test, P < 10 × 10−5) between stress scores quantified using RNA-ISH and scRNA-seq experiments. Each dot represents a sample. (E) Boxplots comparing the RNA-ISH stress scores in treatment-naïve (blue) versus post-NACT (yellow) samples (permutation test, P = 0.00124). Each dot represents a sample.
Fig. 4.
Fig. 4.. Inferred CNA and subclonal analysis reveals enrichment of the stress state during chemotherapy.
(A) Inferred clonality tree (left), subclonal stress score (middle), and subclonal enrichment during NACT (right) of a representative patient (EOC3) with progressive disease and short PFI (PFI = 14 days). Only subclones that existed in the treatment-naïve samples are included in the subclonal stress score and subclonal enrichment analysis. The subclonal enrichment is measured by the ratio of the relative abundance of post-NACT cells against the relative abundance of treatment-naïve cells. PARPi, PARP inhibitor. (B) Inferred clonality tree (left), subclonal stress score (middle), and subclonal enrichment during NACT (right) of a representative patient (EOC136) with progressive disease and long PFI (PFI = 520 days). (C) Boxplot showing the enrichment of the stress-highest (red) and stress-lowest (blue) CNA subclones during NACT. Only subclones existing in treatment naïve samples (paired Wilcoxon rank-sum test, P = 0.032) were included. Each dot represents a CNA subclone. (D) Boxplots showing the proliferation score of the stress-highest (left; paired Wilcoxon rank-sum test, P = 0.031) and stress-lowest (right; paired Wilcoxon rank-sum test, P = 0.3) CNA subclones before and after chemotherapy. Each dot represents a CNA subclone.
Fig. 5.
Fig. 5.. Stress-associated transcriptional profile predicts poor survival in HGSOC.
(A) Stress-high and stress-low Kaplan-Meier curves on PFS for stress-high and stress-low patients (log-rank test, P = 0.0037) from the TCGA cohort. The number of patients at risk is listed below the survival curves for each time point. (B) Forest plot showing hazard ratios, their confidence intervals, and P values based on a multivariate Cox proportional hazards regression model testing whether PFS relates to COSMIC Signature 3 status, age at diagnosis, tumor purity, and stress score. **: 0.001-0.01.
Fig. 6.
Fig. 6.. Interactions between inflammatory stroma and stress-associated cancer cells.
(A) UMAP plot of stromal and immune cells, colored by cell type. (B) Dot plot showing the relative expression of acknowledged stromal and immune cell subtype markers. The color intensity scale reflects the average gene expression, and the size scale indicates the percentage of cells expressing the gene within that cell type. (C) Dot plot showing the expression of selected marker genes of CAF subtypes. ECM, extracellular matrix. (D) UMAP plot of stromal cells, colored by cell type. The trajectory learned by Monocle3 is displayed. (E) Boxplots showing the fractional differences (Wilcoxon rank-sum test) of identified stromal subtypes between stress-high (red) and stress-low (blue) tumors. Each dot represents a tumor sample. All differences with FDR-adjusted P < 0.05 are indicated. (F) Scatter plot showing the correlation between the tumor compartment stress score and the stromal compartment CAF-2 scores in HERCULES cohort. Each dot represents a sample, colored by treatment phase. (G) Heatmaps and dot plots showing the activity (left), expression (middle), and regulatory potential (right) of the prioritized ligands in stressed cancer cells that drive the phenotype of the inflammatory stroma (CAF-2). (H) Heatmaps and dot plots showing the activity (left), expression (middle), and regulatory potential (right) of the prioritized ligands in inflammatory stroma (CAF-2) that drive the stress signature in the stressed cancer cells.

References

    1. Kelland L., The resurgence of platinum-based cancer chemotherapy. Nat. Rev. Cancer 7, 573–584 (2007). - PubMed
    1. Neijt J. P., ten Bokkel Huinink W. W., van der Burg M. E., van Oosterom A. T., Willemse P. H., Vermorken J. B., van Lindert A. C., Heintz A. P., Aartsen E., van Lent M., Long-term survival in ovarian cancer. Eur. J. Cancer. 27, 1367–1372 (1991). - PubMed
    1. Torre L. A., Trabert B., DeSantis C. E., Miller K. D., Samimi G., Runowicz C. D., Gaudet M. M., Jemal A., Siegel R. L., Ovarian cancer statistics, 2018. CA Cancer J. Clin. 68, 284–296 (2018). - PMC - PubMed
    1. Ahmed A. A., Etemadmoghadam D., Temple J., Lynch A. G., Riad M., Sharma R., Stewart C., Fereday S., Caldas C., Defazio A., Bowtell D., Brenton J. D., Driver mutations in TP53 are ubiquitous in high grade serous carcinoma of the ovary. J. Pathol. 221, 49–56 (2010). - PMC - PubMed
    1. Bell D., Berchuck A., Birrer M., Chien J., Cramer D. W., Dao F., Dhir R., DiSaia P., Gabra H., Glenn P., Godwin A. K., Gross J., Hartmann L., Huang M., Huntsman D. G., Iacocca M., Imielinski M., Kalloger S., Karlan B. Y., Levine D. A., Mills G. B., Morrison C., Mutch D., Olvera N., Orsulic S., Park K., Petrelli N., Rabeno B., Rader J. S., Sikic B. I., Smith-McCune K., Sood A. K., Bowtell D., Penny R., Testa J. R., Integrated genomic analyses of ovarian carcinoma. Nature 474, 609–615 (2011). - PMC - PubMed

Publication types