. 2022 Apr 1;322(4):C591-C604.
doi: 10.1152/ajpcell.00363.2021. Epub 2022 Feb 23.

Serially passaged, conditionally reprogrammed nasal epithelial cells as a model to study epithelial functions and SARS-CoV-2 infection

Affiliations

Serially passaged, conditionally reprogrammed nasal epithelial cells as a model to study epithelial functions and SARS-CoV-2 infection

Hanna Schmidt et al. Am J Physiol Cell Physiol. .

Abstract

Primary airway epithelial cells (pAECs) cultivated at air-liquid interface (ALI) conditions are widely used as surrogates for human in vivo epithelia. To extend the proliferative capacity and to enable serially passaging of pAECs, conditional reprogramming (cr) has been employed in recent years. However, ALI epithelia derived from cr cells often display functional changes with increasing passages. This highlights the need for thorough validation of the ALI cultures for the respective application. In our study, we evaluated the use of serially passaged cr nasal epithelial cells (crNECs) as a model to study SARS-CoV-2 infection and effects on ion and water transport. NECs were obtained from healthy individuals and cultivated as ALI epithelia derived from passages 1, 2, 3, and 5. We compared epithelial differentiation, ion and water transport, and infection with SARS-CoV-2 between passages. Our results show that epithelia maintained major differentiation characteristics and physiological ion and water transport properties through all passages. However, the frequency of ciliated cells, short circuit currents reflecting epithelial Na+ channel (ENaC) and cystic fibrosis transmembrane conductance regulator (CFTR) activity and expression of aquaporin 3 and 5 decreased gradually over passages. crNECs also expressed SARS-CoV-2 receptors angiotensin converting enzyme 2 (ACE2) and transmembrane serin2 protease 2 (TMPRSS2) across all passages and allowed SARS-CoV-2 replication in all passages. In summary, we provide evidence that passaged crNECs provide an appropriate model to study SARS-CoV-2 infection and also epithelial transport function when considering some limitations that we defined herein.

Keywords: SARS-CoV-2; airway epithelial culture; conditional reprogramming; nasal epithelial cells.


Conflict of interest statement

No conflicts of interest, financial or otherwise, are declared by the authors.

Figures

Figure 1.
Figure 1.
A: schematically summarizes the culture protocol of nasal epithelial cells (NECs). NECs were obtained via brushing from the inferior nasal turbinate of healthy individuals. For growth curves, half of the cell sample was cultured at conventional culture conditions and half using conditional reprogramming (cr) in the presence of mitotically inactivated embryonic mouse fibroblasts (3T3-J2) as feeder cells and the ROCK inhibitor Y-27632 (10 µM). Cells were passaged in a 7-day cycle until passage 5. For generation of air-liquid interface (ALI) epithelia, NECs were proliferated at cr conditions (crNECs) and differentiated at ALI on porous filter membranes at passages 1, 2, 3, and 5. B: primary NECs cultured at conventional conditions (pNEC) and crNECs were passaged after 7, 14, 21, 28, and 35 days, respectively. Cell counts of passaged cells were used to calculate number of population doublings from the seeded cell amount. The graph shows cumulative population doublings at the indicated total culture time. Box plots give data as median, percentiles (box), and minimum/maximum (whiskers). Growth of conventionally cultured NECs ceased between days 21 and 28. In contrast, cr continuously proliferated until day 35. Cumulative population doublings of conventionally cultured cells were significantly reduced compared with cr after 14, 21, and 28 days (P = 0.0093, P = 0.0046, and P = 0.0023 for days 14, 21, and 28; multiple Mann–Whitney tests with Bonferroni correction for multiple comparisons; n = 7 donors). *P < 0.05, **P < 0.01, and ***P < 0.001.
Figure 2.
Figure 2.
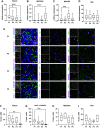
CR nasal epithelial cells of passages 13 and 5 (P1, P2, P3, and P5) were cultivated at ALI. AD: expression of differentiation markers reflecting the main cell types of airway epithelia was determined using semiquantitative qPCR of whole cell lysates. Box plots give data as median, percentiles (box) and minimum/maximum (whiskers). Results are given as relative expression to the housekeeping gene HMBS. Expression levels of respective genes at P2, P3, and P5 were compared with P1 using Kruskal–Wallis test with Dunn’s correction for multiple comparisons. We used FOXJ1 (A) as marker for ciliated cells, MUC5AC (B) and MUC5B (C) as markers for mucus secreting cells, and P63 (D) as marker for basal cells. FOXJ1 was downregulated in P3 and P5 (P = 0.0120 and P < 0.0001). Transcription levels increased in P5 for MUC5AC and P3 for MUC5B (P < 0.001 and P = 0.0002). P63 expression (D) did not differ between passages. (n = 18–24 replicates from 6 donors). E: immunocytochemistry experiments were used to determine frequency of ciliated cells (FOXJ1+, acetylated α-tubulin+), mucus secreting cells (MUCAC+), and basal cells (p63+). P63 and FOXJ1 were counterstained with the nuclear dye Hoechst 33342, the other markers with ZO-1 (F). Images give maximum z-projections of representative sections representing 250–500 cells each. FI: immunocytochemistry images were analyzed for the percentage of cell positive for differentiation markers of total cell number determined from the respective counterstaining. Box plots give data as median, percentiles (box), and minimum/maximum (whiskers). Abundance of cell types at P2, P3, and P5 were compared with P1 using Kruskal–Wallis test with Dunn’s correction for multiple comparisons. In line with RT-PCR data, number of FOXJ1+ cells (F) decreased at P5 (P = 0.0062). Similarly, number of acetylated α-tubulin+ cells (G) was reduced at P5 (P = 0.0005), indicating decline of ciliated cells. Number of MUCAC+ cells (H) representing mucus secreting cells and P63+ cells (I) representing basal cells did not differ between passages. n = 6–8 donors. ALI, air-liquid interface; CR, conditional reprogramming. *P < 0.05, **P < 0.01, ***P < 0.001, and ****P < 0.0001.
Figure 3.
Figure 3.
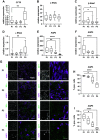
AF: expression of ion channels and aquaporins (AQP) was determined in ALI epithelia of cr nasal epithelial cells of the passages 13 and 5 (P1, P2, P3, and P5) using semiquantitative qPCR of whole cell lysates. Box plots give data as median, percentiles (box), and minimum/maximum (whiskers). Results are given as relative expression to the housekeeping gene HMBS. Expression levels of P2, P3, and P5 were compared with P1 data using Kruskal–Wallis test with Dunn’s correction for multiple comparisons. CFTR expression (A) was upregulated in P5 epithelia (P = 0.0018). α-subunit of ENaC (B) expression did not differ between passages; however, β-subunit expression (C) decreased at P3 and P5 (P = 0.0129 and P = 0.0403) and γ-subunits expression (D) increased at P5 (P = 0.0022). AQP3 (E) expression was reduced at P3 and P5 (P = 0.0012; P < 0.0001) as well as AQP5 expression (F; P = 0.0156 and P < 0.0001 for P3 and P5, respectively), n = 18–25 replicates from 6 donors. GI: immunocytochemistry experiments were used to further investigate decrease of AQP expression on protein level. AQP3 and AQP5 were counterstained with ZO-1 (G). Images give maximum z-projections of representative sections representing 250–500 cells each. H and I: immunocytochemistry images were analyzed for the percentage of cell positive for differentiation markers of total cell number determined from the respective counterstaining. Box plots give data as median, percentiles (box), and minimum/maximum (whiskers). Abundance of cell types at P2, P3, and P5 were compared with P1 using Kruskal–Wallis test with Dunn’s correction for multiple comparisons. In line with RT-PCR data, number of AQP3+ cells (H) decreased at P3 and P5 (P = 0.0315 and P < 0.0001). Similarly, number of AQP5+ cells (I) was reduced at P3 and P5 (P = 0.0165 and P < 0.0001). n = 6–8 donors. ALI, air-liquid interface; CR, conditional reprogramming. *P < 0.05, **P < 0.01, and ****P < 0.0001.
Figure 4.
Figure 4.
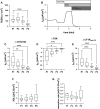
cr nasal epithelial cells of the passages 13 and 5 (P1, P2, P3, and P5) were cultivated as ALI epithelia and analyzed for functional properties. Box plots give data as median, percentiles (box), and minimum/maximum (whiskers). Results of P2, P3, and P5 were compared with respective P1 data using Kruskal–Wallis test with Dunn’s correction for multiple comparisons. A: transepithelial electrical resistance (TEER) was measured using impedance spectroscopy. TEER was reduced at P5 (P < 0.0001). n = 24–30 replicates from 6 donors. BE: short circuit currents (ISC) were determined in Ussing chamber experiments. Representative Ussing chamber measurement. B: ISC response to amiloride (30 µM), forskolin (FSK, 50 µM), and CFTRinh-172 (100 µM). Amiloride-sensitive ISC (C), FSK-sensitive ISC (D), and CFTRinh-172-sensitive ISC (E) were reduced at P3 and P5 (P = 0.0011 and P < 0.0001 for amiloride; P = 0.203 and P < 0.0001 for FSK; P < 0.0001 for P3 and P5 for CFTRinh-172). n = 16–26 from 5 donors. F: ASL volumes were determined using deuterium oxide dilution and did not differ between passages. n = 19–25 replicates from 6 donors. G: epithelia were apically exposed to 25 µL of NaCl 0.9% solution and incubated for 8 h. y-axis gives resorption rates per hours calculated from the difference between remaining ASL volumes after 8 h and baseline ASL volumes. Resorption rates did not differ between passages. n = 15–20 replicates from 5 donors. ALI, air-liquid interface; ASl, apical surface liquid; cr, conditional reprogramming. *P < 0.05, **P < 0.01, and ****P < 0.0001.
Figure 5.
Figure 5.
Expression of the SARS-CoV-2 receptor ACE2 (A) and the coreceptor TMPRSS2 (B) was determined in ALI epithelia of CR nasal epithelial cells of the passages 13 and 5 (P1, P2, P3, and P5) using semiquantitative qPCR of whole cell lysates. Box plots give data as median, percentiles (box), and minimum/maximum (whiskers). Results are given as relative expression to the housekeeping gene HMBS. Expression levels of P2, P3, and P5 were compared with P1 data. ACE expression decreased in P3 and P5 epithelia (P = 0.0045 and P < 0.0001; Kruskal–Wallis test with Dunn’s correction for multiple comparisons; n = 15–18 replicates from 5 donors). TMPRSS expression did not differ between passages. ALI, air-liquid interface; CR, conditional reprogramming. **P < 0.01 and ****P < 0.0001.
Figure 6.
Figure 6.
cr nasal epithelial cells of the passages 13 and 5 (P1, P2, P3, and P5) were cultivated as ALI epithelia and infected with SARS-CoV-2 for 48 h. A and B: immunocytochemistry experiments with staining of SARS-CoV-2 nucleocapsid protein and nuclear counterstaining with Hoechst 33342 confirmed infection of cells in all passages (A). Z-series shows infection of only apically localized cells (B). Virus replication was quantified using semiquantitative qPCR of whole cell lysates. Box plots give data as median, percentiles (box), and minimum/maximum (whiskers). Results are given as relative expression to the housekeeping gene Hh. Expression levels of P2, P3, and P5 were compared with P1 data. Transcript levels encoding for SARS-CoV-2 nucleocapsid protein were lower at P2, P3, and P5 compared with P1 (P = 0.0034; P = 0.0012 and P = 0.0206). In uninfected cells (control), PCR products were not detected (n.d.) (C). n = 6–9 replicates from 3 donors. ALI, air-liquid interface; cr, conditional reprogramming. *P < 0.05 and **P < 0.01.

Similar articles

Cited by

References

    1. Burney P, Jarvis D, Perez-Padilla R. The global burden of chronic respiratory disease in adults. Int J Tuberc Lung Dis 19: 10–20, 2015. doi:10.5588/ijtld.14.0446. - DOI - PubMed
    1. Asher I, Pearce N. Global burden of asthma among children. Int J Tuberc Lung Dis 18: 1269–1278, 2014. doi:10.5588/ijtld.14.0170. - DOI - PubMed
    1. López-Campos JL, Tan W, Soriano JB. Global burden of COPD. Respirology 21: 14–23, 2016. doi:10.1111/resp.12660. - DOI - PubMed
    1. Hu B, Guo H, Zhou P, Shi Z-L. Characteristics of SARS-CoV-2 and COVID-19. Nat Rev Microbiol 19: 141–154, 2021. [Erratum in Nat Rev Microbiol 1, 2022]. doi:10.1038/s41579-020-00459-7. - DOI - PMC - PubMed
    1. Muralidar S, Ambi SV, Sekaran S, Krishnan UM. The emergence of COVID-19 as a global pandemic: understanding the epidemiology, immune response and potential therapeutic targets of SARS-CoV-2. Biochimie 179: 85–100, 2020. doi:10.1016/j.biochi.2020.09.018. - DOI - PMC - PubMed

Publication types

MeSH terms

Substances