. 2022 Oct;18(10):2368-2384.
doi: 10.1080/15548627.2022.2034131. Epub 2022 Feb 23.

Treatments targeting autophagy ameliorate the age-related macular degeneration phenotype in mice lacking APOE (apolipoprotein E)

Affiliations

Treatments targeting autophagy ameliorate the age-related macular degeneration phenotype in mice lacking APOE (apolipoprotein E)

Kirstan A Vessey et al. Autophagy. 2022 Oct.

Abstract

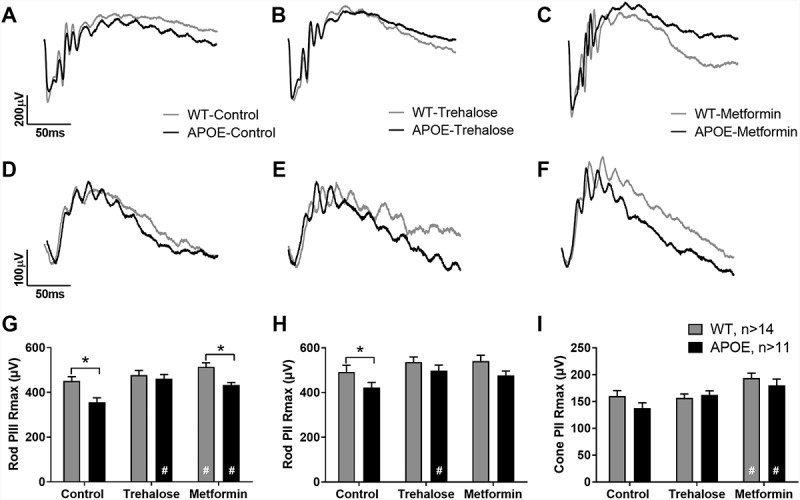
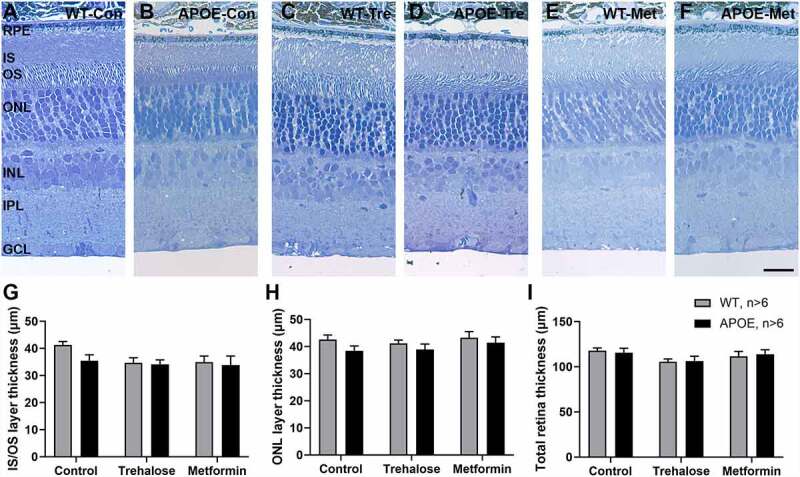
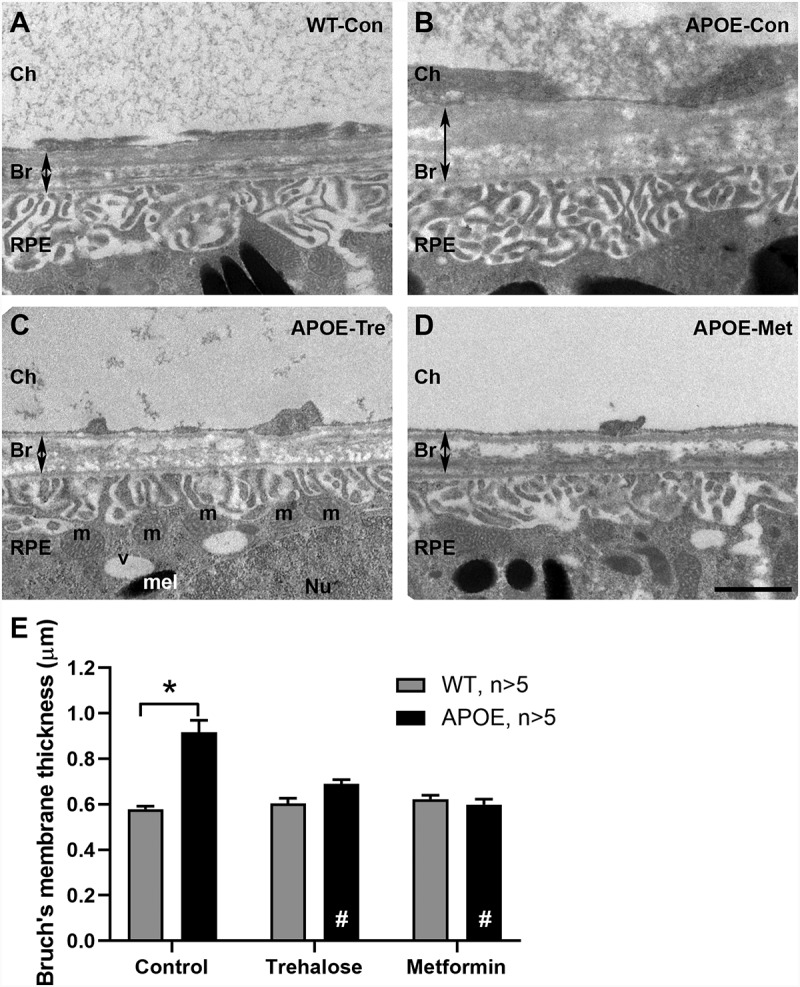
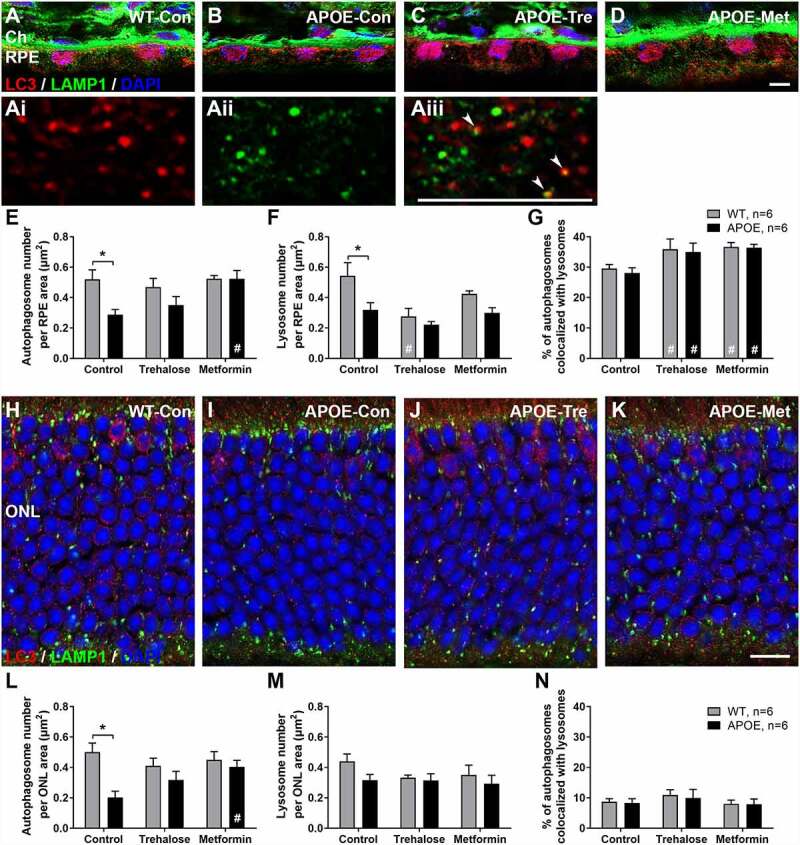
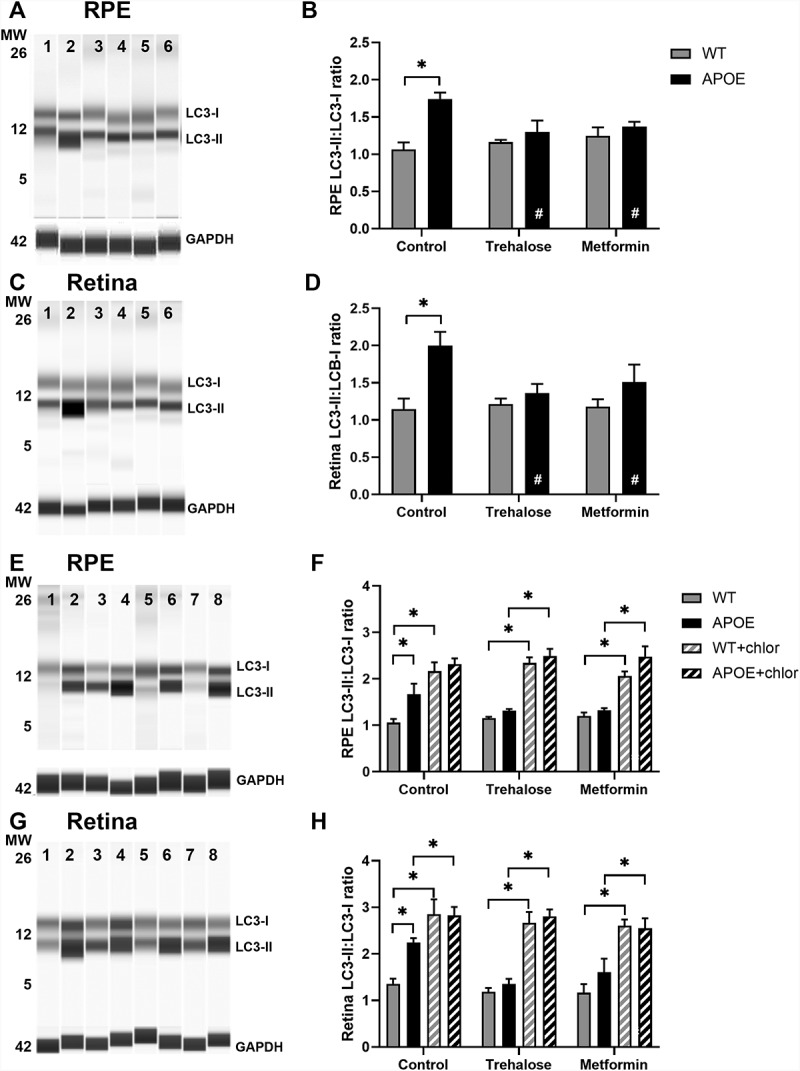
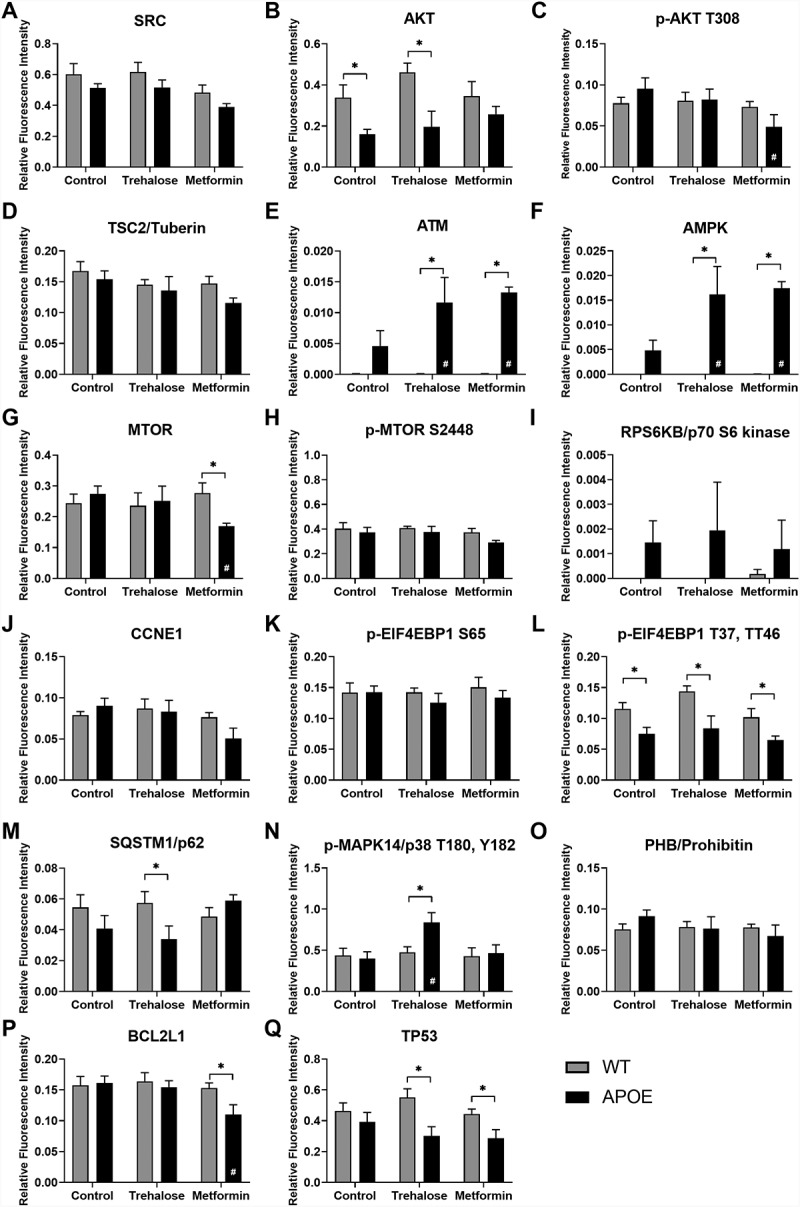
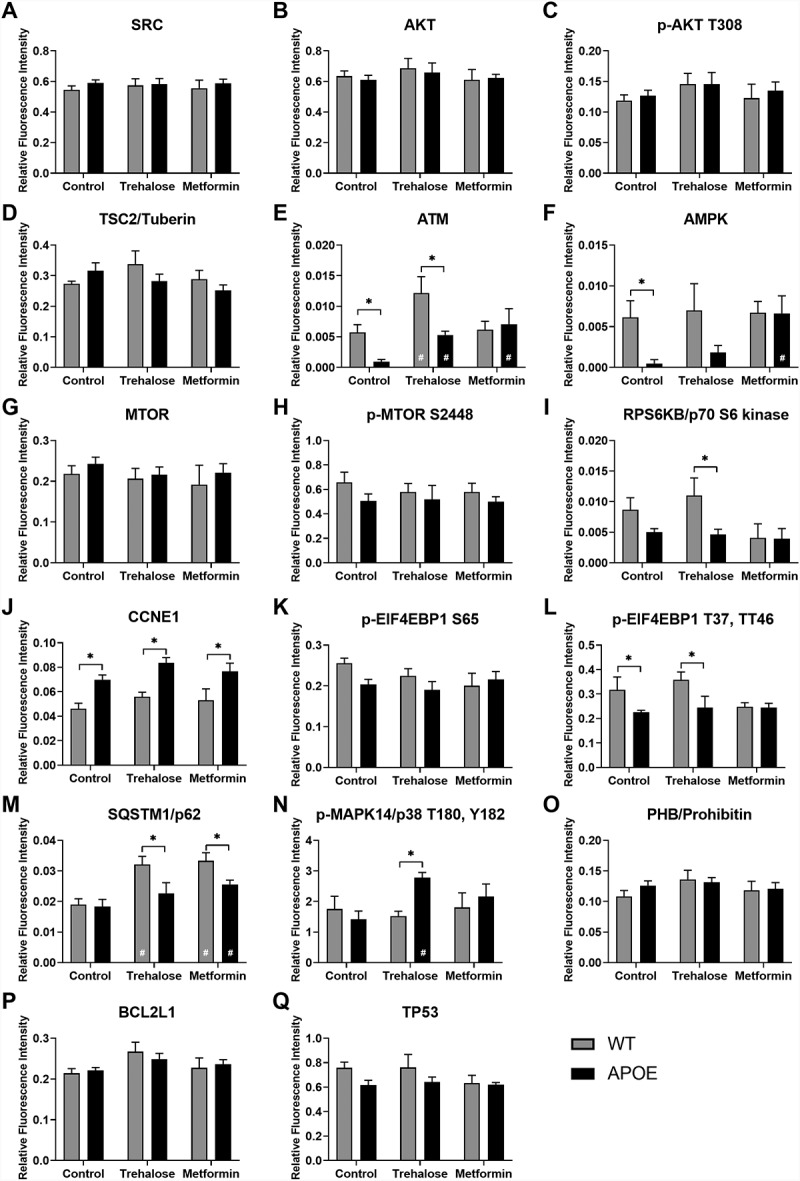
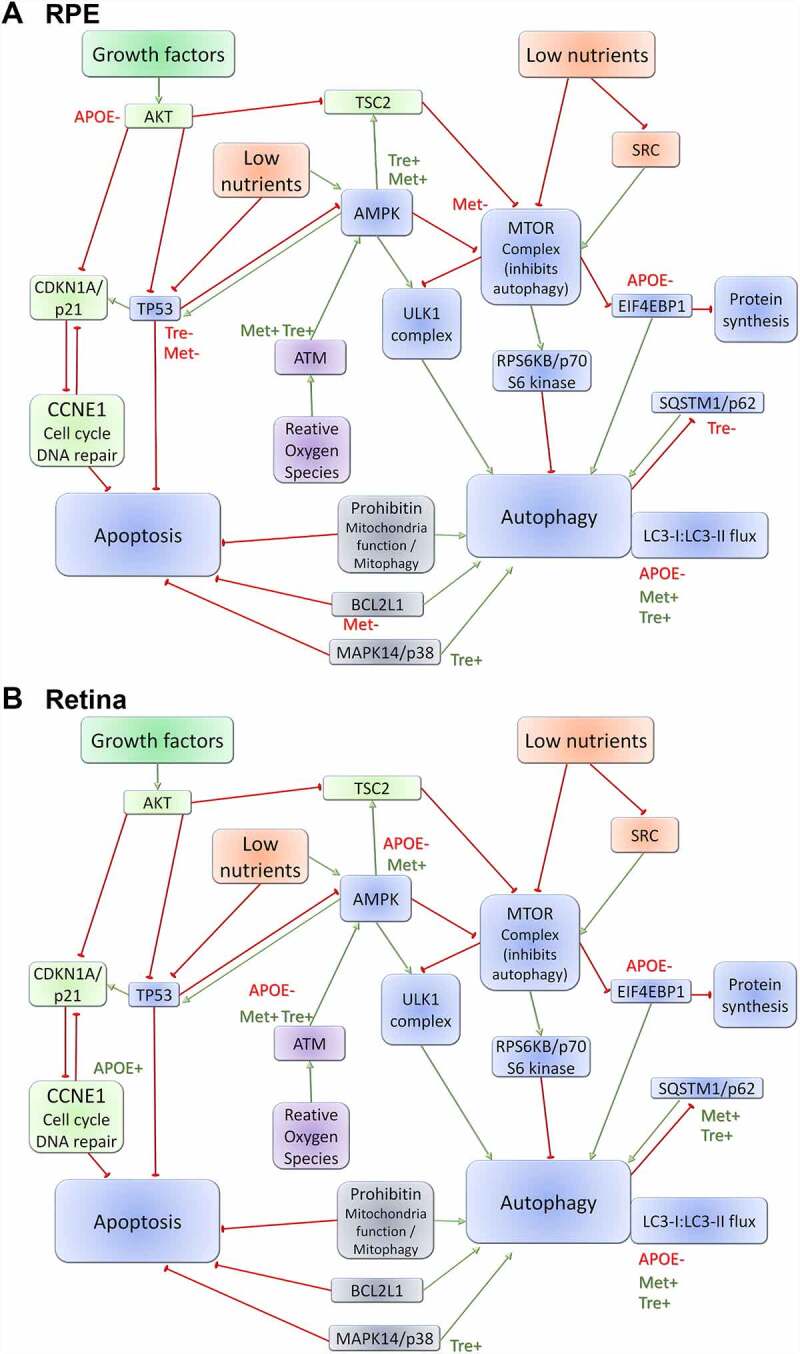
Age-related macular degeneration (AMD) is a leading cause of vision loss with recent evidence indicating an important role for macroautophagy/autophagy in disease progression. In this study we investigate the efficacy of targeting autophagy for slowing dysfunction in a mouse model with features of early AMD. Mice lacking APOE (apolipoprotein E; B6.129P2-Apoetm1UncJ/Arc) and C57BL/6 J- (wild-type, WT) mice were treated with metformin or trehalose in the drinking water from 5 months of age and the ocular phenotype investigated at 13 months. Control mice received normal drinking water. APOE-control mice had reduced retinal function and thickening of Bruch's membrane consistent with an early AMD phenotype. Immunohistochemical labeling showed reductions in MAP1LC3B/LC3 (microtubule-associated protein 1 light chain 3 beta) and LAMP1 (lysosomal-associated membrane protein 1) labeling in the photoreceptors and retinal pigment epithelium (RPE). This correlated with increased LC3-II:LC3-I ratio and alterations in protein expression in multiple autophagy pathways measured by reverse phase protein array, suggesting autophagy was slowed. Treatment of APOE-mice with metformin or trehalose ameliorated the loss of retinal function and reduced Bruch's membrane thickening, enhancing LC3 and LAMP1 labeling in the ocular tissues and restoring LC3-II:LC3-I ratio to WT levels. Protein analysis indicated that both treatments boost ATM-AMPK driven autophagy. Additionally, trehalose increased p-MAPK14/p38 to enhance autophagy. Our study shows that treatments targeting pathways to enhance autophagy have the potential for treating early AMD and provide support for the use of metformin, which has been found to reduce the risk of AMD development in human patients.Abbreviations:AMD: age-related macular degeneration; AMPK: 5' adenosine monophosphate-activated protein kinase APOE: apolipoprotein E; ATM: ataxia telangiectasia mutated; BCL2L1/Bcl-xL: BCL2-like 1; DAPI: 4'-6-diamidino-2-phenylindole; ERG: electroretinogram; GAPDH: glyceraldehyde-3-phosphate dehydrogenase; GCL: ganglion cell layer; INL: inner nuclear layer; IPL: inner plexiform layer; IS/OS: inner and outer photoreceptor segments; LAMP1: lysosomal-associated membrane protein 1; MAP1LC3B/LC3: microtubule-associated protein 1 light chain 3 beta; MTOR: mechanistic target of rapamycin kinase; OCT: optical coherence tomography; ONL: outer nuclear layer; OPs: oscillatory potentials; p-EIF4EBP1: phosphorylated eukaryotic translation initiation factor 4E binding protein 1; p-MAPK14/p38: phosphorylated mitogen-activated protein kinase 14; RPE: retinal pigment epithelium; RPS6KB/p70 S6 kinase: ribosomal protein S6 kinase; SQSTM1/p62: sequestosome 1; TP53/TRP53/p53: tumor related protein 53; TSC2: TSC complex subunit 2; WT: wild type.

Keywords: B6.129P2-Apoetm1UncJ; bruch’s membrane; metformin; retina; retinal pigment epithelium; trehalose.


Conflict of interest statement

No potential conflict of interest was reported by the author(s).

Figures

Figure 1.
Figure 1.
APOE-mice show retinal functional deficits at 13 months, which are ameliorated by treatment with trehalose or metformin. WT- and APOE-mice were treated from 5 months of age until 13 months with metformin (0.4 g/kg/day) or trehalose (3 g/kg/day) and retinal function was assessed using twin flash electroretinogram. (A-C) Rod pathway responses are presented for (A) untreated controls, (B) trehalose-treated, and (C) metformin-treated WT (gray line) and APOE mice (black line). (D-F) Cone pathway responses are presented for (D) untreated controls, (E) trehalose-treated, and (F) metformin-treated WT (gray line) and APOE mice (black line). (G) APOE mice (black bars) had a reduced rod photoreceptor response (Rod PIII Rmax, a-wave) and (H) post-photoreceptor response (Rod PII Rmax, b-wave) relative to WT-control mice (gray bars) and this loss was no longer apparent following treatment. (I) While there was no apparent cone pathway deficit, metformin treatment enhanced cone post-photoreceptor responses in WT- and APOE-mice relative to their genetic controls. For all groups n ≥ 11; Two way ANOVA with post-hoc significance of p < 0.05 shown for genotype (*) and treatment (#).
Figure 2.
Figure 2.
Retinal layer thickness is not altered in APOE-mice or as a result of drug treatment. Retinal morphology and layer thickness was assessed using semi-thin resin sections stained with toluidine blue. (A-F) Representative transverse retinal sections from (A) WT-control, (B) APOE-control, (C) WT-mice treated with trehalose, (D) APOE-mice treated with Trehalose, (E) WT-mice treated with metformin and (F) APOE-mice treated with metformin are presented. (G-I) There were no significant changes in (G) photoreceptor inner segment/outer segment length, (H) the outer nuclear layer or (I) total retinal thickness between WT- and APOE-mice and drug treated animals. For all groups n = 6; Two way ANOVA for genotype and treatment, p > 0.05. Scale: 20 µm. RPE, retinal pigment epithelium; OS, photoreceptor outer segments; IS, photoreceptor inner segments; ONL, outer nuclear layer; INL, inner nuclear layer; IPL, inner plexiform layer; GCL, ganglion cell layer.
Figure 3.
Figure 3.
APOE-mice show thickening of Bruch’s membrane at 13 months that is ameliorated by treatment with trehalose or metformin. Bruch’s membrane thickness was investigated using transmission electron microscopy. (A-D) Representative images of Bruch’s membrane are presented for (A) WT-control, (B) APOE-control, and APOE-mice treated with (C) trehalose and (D) metformin. (E) Bruch’s membrane thickness was assessed using segmentation analysis and was found to be significantly thicker in 13-month-old control APOE-mice (black bars) than in age matched WT-mice (gray bars). Treatment of APOE-mice with either trehalose or metformin for 8 months resulted in Bruch’s membrane being similar in thickness to WT-control mice. For all groups n = >5; Two way ANOVA with post-hoc significance of p < 0.05 shown for genotype (*) and treatment (#). Scale: 1 µm. Ch, Choroid; Br, Bruch’s membrane; RPE, retinal pigment epithelium; m, mitochondria; v, vacuole; Nu, nucleus; mel, melanosomes.
Figure 4.
Figure 4.
Autophagy-Lysosomal pathways are impaired in the RPE and retina of APOE-mice and treatment with trehalose and metformin ameliorate aspects of this deficit. Autophagy–lysosomal pathways in RPE and photoreceptors were investigated using transverse sections labeled for autophagosomes with an LC3 antibody (red) and lysosomes with a LAMP1 antibody (green). (A-D) Representative images of RPE from (A) WT-control mice, with magnified view of (Ai) LC3-puncta, (Aii) LAMP1-puncta and (Aiii) colocalization (white arrowheads); (B) APOE-control mice; and APOE mice treated with (C) trehalose and (D) metformin are shown. (E) The number of LC3-puncta in the RPE was reduced in APOE-control mice relative to WT-control mice. This loss of LC3-puncta was not apparent in APOE-mice treated with trehalose or metformin relative to their treated WT counterparts. (F) LAMP1-puncta were also reduced in the RPE of APOE-control relative to WT-control mice and this was not altered by treatment with trehalose or metformin. (G) Both trehalose and metformin were found to enhance the number of colocalized LC3- and LAMP1-puncta, suggesting active autophagy was increased in the RPE of both WT and APOE mice relative to their genetic controls. (H-K) Representative images of the photoreceptor nuclei layer in the retina from (H) WT-control mice, (I) APOE-control mice, and APOE mice treated with (J) trehalose and (K) metformin are shown. (L) The number of LC3-puncta in the photoreceptors were reduced in APOE-control mice relative to WT-control mice but not in APOE-mice treated with trehalose or metformin. (M) LAMP1-puncta number and (N) colocalized LC3- and LAMP1-puncta were not altered by either genotype or treatment. For all groups n = >6; Two way ANOVA with post-hoc significance of p < 0.05 shown for genotype (*) and treatment (#). A-D, scale: 5 µm; Ai-Aiii, scale: 5 µm; H-K, scale: 10 µm; RPE, retinal pigment epithelium; ONL, outer nuclear layer.
Figure 5.
Figure 5.
Analysis of LC3 expression shows slowing of autophagy in the RPE and retina of APOE-mice, which is enhanced by treatment with trehalose and metformin. LC3 expression was assessed using simple western and the ratio of LC3-II:LC3-I used as a measure of autophagy. At 5 months of age, WT- and APOE-mice were treated with metformin (0.4 g/kg/day) or trehalose (3 g/kg/day) provided in the drinking water, while sham controls received standard drinking water. At 13 months of age, (A-B) RPE and (C-D) retina samples were analyzed for LC3B. GAPDH was used as a protein loading control. Representative lane results for (A) RPE and (C) retina are presented: MW, molecular weight marker; 1, WT-control; 2, APOE-control; 3, WT-trehalose; 4, APOE-trehalose; 5, WT-metformin; and 6, APOE-metformin. In both (B) RPE and (D) retina, the LC3-II:LC3-I ratio was higher in APOE-mice suggesting a slowing of autophagy. In APOE animals treated with trehalose or metformin the ratio of LC3-II:LC3-I was restored to WT levels. (E-H) To assess autophagy flux, experiments to block autophagy-lysosomal degradation were completed using chloroquine. At 5 months of age, WT- and APOE-mice were treated for 2 weeks with metformin or trehalose and then retinae and RPE/choroid/sclera complex were incubated in culture media with or without 50 µM chloroquine for 24 h. Example results for E) RPE and (G) retina from WT and APOE mice are presented: Lanes 1, WT-control; 2, WT-control + chloroquine, 3, APOE-control; 4, APOE-control + chloroquine; 5, APOE-trehalose; 6, APOE-trehalose + chloroquine; 7, APOE-metformin; 8, APOE-metformin + chloroquine. The LC3-II:LC3-I ratio in (F) RPE and (H) retinal samples increased significantly in all samples treated with chloroquine to block autophagy-lysosomal function. For all groups, n = 5; Two way ANOVA with post-hoc significance of p < 0.05 (*).
Figure 6.
Figure 6.
Protein array analysis of autophagy pathways in the RPE. Reverse phase protein array analysis was used to quantify protein expression changes in the autophagy pathways in the RPE from WT- (gray bars) and APOE-mice (black bars) treated with trehalose and metformin. Results are shown for (A) SRC, (B) AKT, (C) AKT phosphorylated at T306, (D) TSC2/tuberin, (E) ATM, (F) AMPK, (G) MTOR, (H) MTOR phosphorylated at S2448, (I) RPS6KB/p70 S6 kinase, (J) CCNE1, (K-L) EIF4EBP1 phophorylated at (K) S65 and (L) T37, T46, (M) SQSTM1/p62, (N) MAPK14/p38 phosphorylated at T180, (O) PHB, (P) BCL2L1, and (Q) TP53. For all groups, n = 5; Two way ANOVA with post-hoc significance of p < 0.05 shown for genotype (*) and treatment (#).
Figure 7.
Figure 7.
Protein array analysis of autophagy pathways in the whole retina. Reverse phase protein array analysis was used to quantify protein expression changes in the autophagy pathways in the retina from WT- (gray bars) and APOE-mice (black bars) treated with trehalose and metformin. Results are shown for (A) SRC, (B) AKT, (C) AKT phosphorylated at T306, (D) Tuberin (TSC2 complex), (E) ATM, (F) AMPK, (G) MTOR, (H) MTOR phosphorylated at S2448, (I) RPS6KB/p70 S6 kinase, (J) CCNE1, (K-L) EIF4EBP1 phophorylated at (K) S65 and (L) T37, T46, (M) SQSTM1/p62, (N) MAPK14/p38 phosphorylated at T180, (O) PHB, (P) BCL2L1, and (Q) TP53. For all groups, n = 5; Two way ANOVA with post-hoc significance of p < 0.05 shown for genotype (*) and treatment (#).
Figure 8.
Figure 8.
Schematic of the autophagy protein pathways investigated. A combination of reverse phase protein array (RPPA) and Western protein analysis were used to quantify protein expression changes in the autophagy pathways in the (A) RPE and (B) retina from WT- and APOE-mice treated with trehalose and metformin and the results from this analysis are summarized in diagram form. Growth factor pathways are indicated in green; low nutrient pathways are indicated in Orange; reactive oxygen species pathways are indicated in purple; and intersecting pathways are indicated in blue. Green arrows indicate pathway upregulation; red bubble arrows indicate pathway down-regulation; green text (+) indicates upregulated in genotype/treatment group; and red text (-) indicates down-regulated in genotype/treatment group.

References

    1. Lim LS, Mitchell P, Seddon JM, et al. Age-related macular degeneration. Lancet. 2012;379:1728–1738. - PubMed
    1. Fritsche LG, Fariss RN, Stambolian D, et al. Age-related macular degeneration: genetics and biology coming together. Annu Rev Genomics Hum Genet. 2014;15(1):151–171. - PMC - PubMed
    1. Pikuleva IA, Curcio CA.. Cholesterol in the retina: the best is yet to come. Prog Retin Eye Res. 2014;41:64–89. - PMC - PubMed
    1. Adler R, Curcio C, Hicks D, et al. Cell death in age-related macular degeneration. Mol Vis. 1999;5:31. - PubMed
    1. Owens SL, Guymer RH, Gross-Jendroska M, et al. Fluorescein angiographic abnormalities after prophylactic macular photocoagulation for high-risk age-related maculopathy. Am J Ophthalmol. 1999;127(6):681–687. - PubMed

Publication types

MeSH terms