Geographic clusters of objectively measured physical activity and the characteristics of their built environment in a Swiss urban area
- PMID: 35196322
- PMCID: PMC8865698
- DOI: 10.1371/journal.pone.0252255
Geographic clusters of objectively measured physical activity and the characteristics of their built environment in a Swiss urban area
Abstract
Introduction: Evidence suggests that the built environment can influence the intensity of physical activity. However, despite the importance of the geographic context, most of the studies do not consider the spatial framework of this association. We aimed to assess individual spatial dependence of objectively measured moderate and vigorous physical activity (MVPA) and describe the characteristics of the built environment among spatial clusters of MVPA.
Methods: Cross-sectional data from the second follow-up (2014-2017) of CoLaus|PsyCoLaus, a longitudinal population-based study of the Lausanne area (Switzerland), was used to objectively measure MVPA using accelerometers. Local Moran's I was used to assess the spatial dependence of MVPA and detect geographic clusters of low and high MVPA. Additionally, the characteristics of the built environment observed in the clusters based on raw MVPA and MVPA adjusted for socioeconomic and demographic factors were compared.
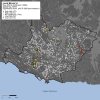
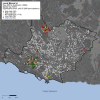
Results: Data from 1,889 participants (median age 63, 55% women) were used. The geographic distribution of MVPA and the characteristics of the built environment among clusters were similar for raw and adjusted MVPA. In the adjusted model, we found a low concentration of individuals within spatial clusters of high MVPA (median: 38.5mins; 3% of the studied population) and low MVPA (median: 10.9 mins; 2% of the studied population). Yet, clear differences were found in both models between clusters regarding the built environment; high MVPA clusters were located in areas where specific compositions of the built environment favor physical activity.
Conclusions: Our results suggest the built environment may influence local spatial patterns of MVPA independently of socioeconomic and demographic factors. Interventions in the built environment should be considered to promote physically active behaviors in urban areas.
Conflict of interest statement
The authors have declared that no competing interests exist.
Figures


References
-
- WHO. Global action plan on physical activity 2018–2030: more active people for a healthier world. Geneva: World Health Organization; 2018.
-
- WHO. Global recommendations on physical activity for health. Geneva: World Health Organization; 2010. - PubMed
Publication types
MeSH terms
LinkOut - more resources
Full Text Sources

