. 2022 Jul 29;145(7):2347-2360.
doi: 10.1093/brain/awac073.

Seizures initiate in zones of relative hyperexcitation in a zebrafish epilepsy model

Affiliations

Seizures initiate in zones of relative hyperexcitation in a zebrafish epilepsy model

James E Niemeyer et al. Brain. .

Abstract

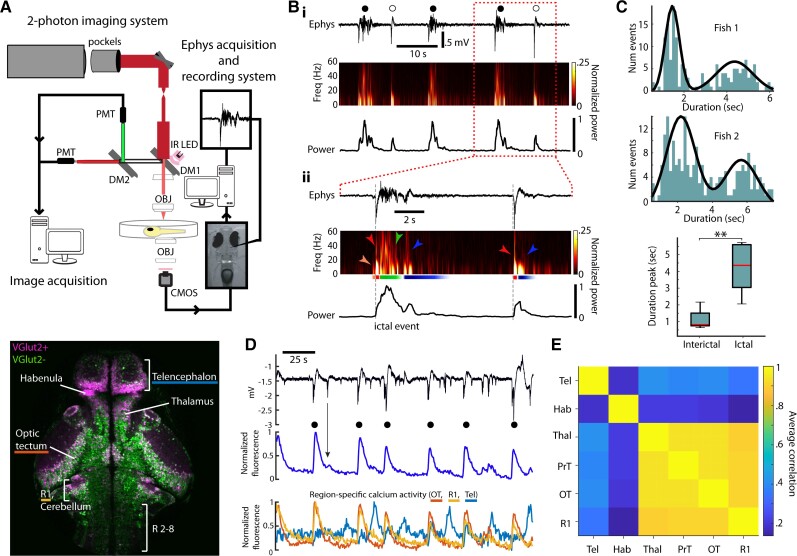
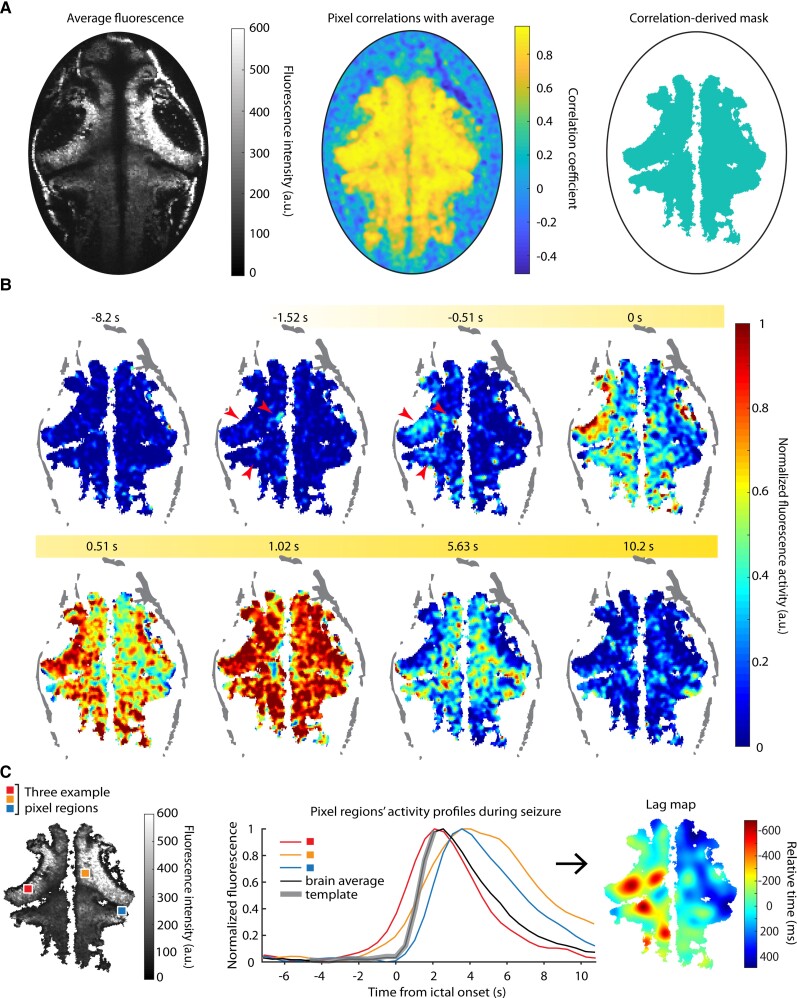
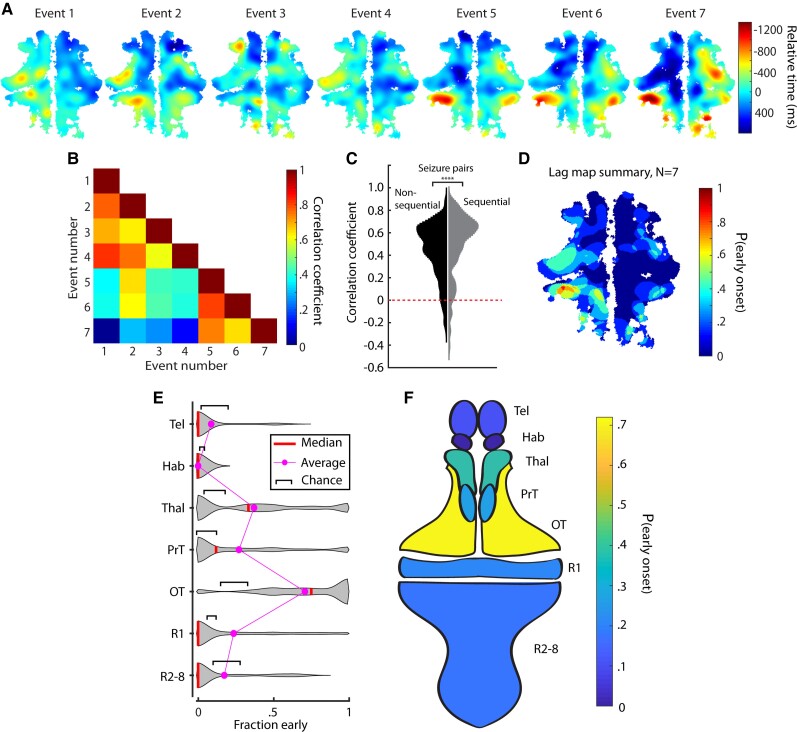
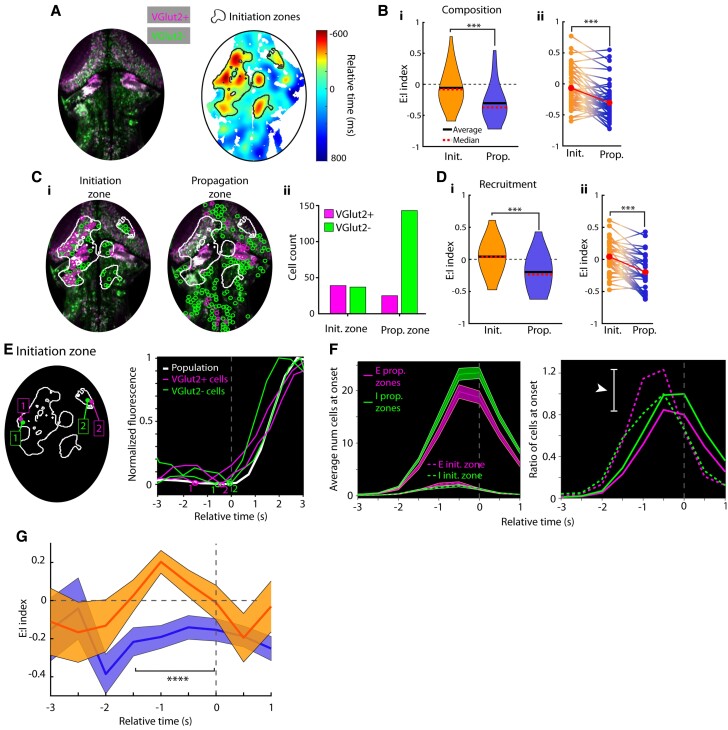
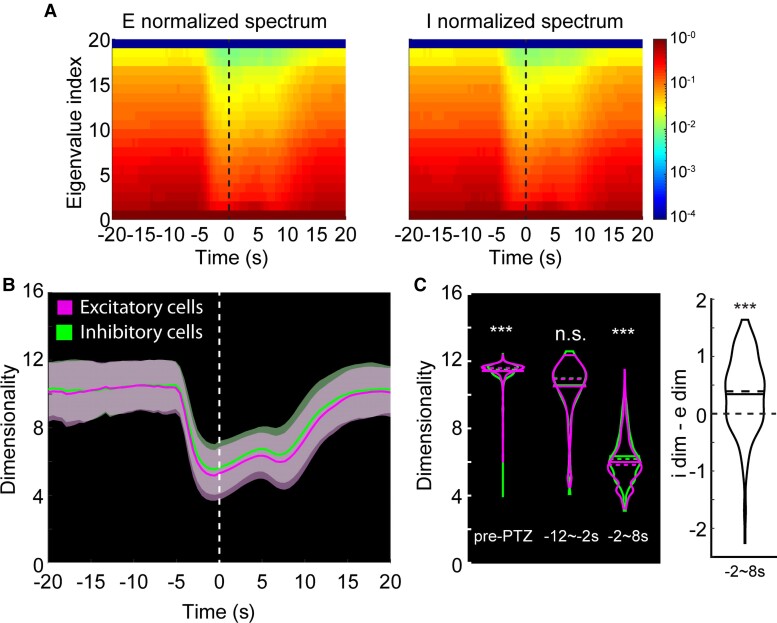
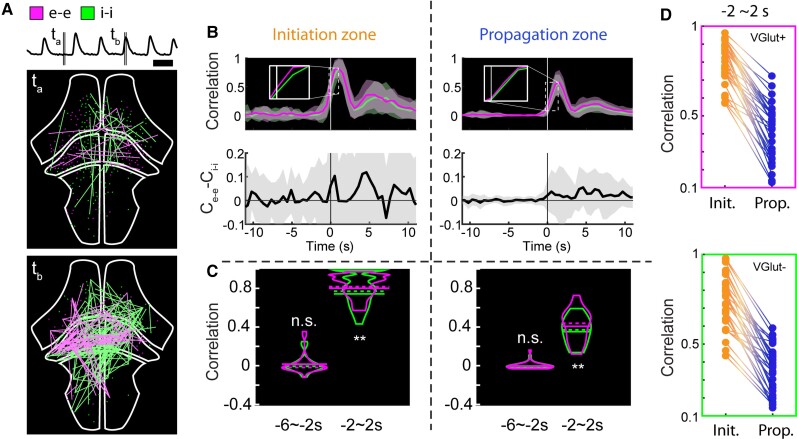
Seizures are thought to arise from an imbalance of excitatory and inhibitory neuronal activity. While most classical studies suggest excessive excitatory neural activity plays a generative role, some recent findings challenge this view and instead argue that excessive activity in inhibitory neurons initiates seizures. We investigated this question of imbalance in a zebrafish seizure model with two-photon imaging of excitatory and inhibitory neuronal activity throughout the brain using a nuclear-localized calcium sensor. We found that seizures consistently initiated in circumscribed zones of the midbrain before propagating to other brain regions. Excitatory neurons were both more prevalent and more likely to be recruited than inhibitory neurons in initiation as compared with propagation zones. These findings support a mechanistic picture whereby seizures initiate in a region of hyperexcitation, then propagate more broadly once inhibitory restraint in the surround is overcome.

Keywords: E/I balance; calcium imaging; ictogenesis; seizure initiation; seizure propagation.


Figures

Figure 1
Figure 1
Ictal and interictal activity in the larval zebrafish. (A) Top: Experimental setup for two-photon imaging and electrophysiology in larval zebrafish during seizures. Bottom: Single imaging plane revealing distribution of VGlut2+ (magenta) and VGlut2− (green) cells in a variety of brain regions (R = rhombomere). (B) Electrophysiological signatures of ictal- and interictal-like events in the zebrafish. (i) Top: LFP; middle: spectrogram; bottom: total power during a period of ictal (filled circle) and interictal (open circle) events. (ii) Similar organization as above but at finer time resolution, with indication of distinct sections (orange, red, green, blue) characterizing the time-course of the two types of events. (C) Top, middle: Histograms of event duration times for two fish and best fit (black) with a Gaussian mixture model; bottom: for all fish, duration time for ictal and interictal events. (D) Top: LFP; middle: globally averaged change in GCaMP6f fluorescence; bottom: regional change in fluorescence during a series of ictal (filled circle) and interictal events (OT = optic tectum; R1 = rhombomere 1; Tel = telencephalon). (E) Matrix of correlations in the activity among various brain regions (Hab = habenula, Thal = thalamus, PrT = pretectum).
Figure 2
Figure 2
Ictal event mapping. (A) Left: Average fluorescence over a series of ictal events in one brain; middle: pixel-wise correlation with brain average; right: the correlation mask. (B) A single seizure’s fluorescence activity is shown over time; red arrows highlight early activity. (C) Left: Sample pixels and their activity profiles (middle) over a single seizure are shown; right: the corresponding smoothed lag map for this seizure shows the relative activation times for each pixel with respect to the brain average.
Figure 3
Figure 3
Ictal events evolve similarly within fish but initiate in different regions across fish. (A) Lag maps for seven seizures in one animal. (B) Correlations between the events in A. (C) Correlations of all pairs of sequential and non-sequential ictal events recorded. (D) Summary map of the ictal events in A. Violin plots (E) and a schematic fish brain map (F) of early-onset regions show where ictal events initiated most commonly across different fish.
Figure 4
Figure 4
Greater prevalence and recruitment of excitatory neurons in ictal initiation zones. (A) A sample fish image with E and I cells differentially labelled and its associated lag map and initiation zone for a single ictal event analysed in this figure. (B) E:I index in initiation and propagation zones (i) and within-seizure E:I comparisons (ii). (C) Single cell locations in a seizure, split by initiation versus propagation zone location (i) and cell counts from initiation and propagation zones (ii). (D) E:I index of cells recruited to seizures in initiation and propagation zones (i) and within-seizure E:I index comparisons (ii). (E) Left: Sample excitatory and inhibitory cells from initiation zones; right: their associated calcium traces during this event. Detected onset times are plotted on traces. (F) Left: Average number of cells at onset across all ictal events grouped by initiation or propagation zone membership; right: the ratio of cells at onset (E:I) over time, normalized to by the number of inhibitory cells at onset. (G) E:I ratio index calculated in initiation (orange) and propagation (blue) zones. All error bars are mean ± SEM.
Figure 5
Figure 5
Dimensionality of the excitatory and inhibitory cell population activities. (A) Left: Eigenspectrum of the excitatory population activity over 10 s-wide rolling window, normalized to the greatest eigenvalue per time point. Vertical line at time 0 is the ictal onset point. Right: Same analysis done for inhibitory cell population. (B) Average trends of the dimensionality. Vertical line at time 0 is the average ictal onset point. Dimensionality over 10-s moving window [magenta: excitatory cell pairs (e-e); green: inhibitory cell pairs (i-i)]. (C) Left: Dimensionalities of i-i pairs and e-e pairs shown separately for pre-PTZ, −12∼−2 s and −2∼8 s periods relative to the average ictal onset point. Right: Differences in I-E dimensionalities at −2∼8 s.
Figure 6
Figure 6
Excitatory and inhibitory cell network correlations. (A) Visualization of activity correlations at the cross-section of the whole brain. Only pairs with correlation values higher than 0.999 are shown. Top: Average normalized fluorescence trace. Middle: Correlations during interictal period. Magenta: Highly correlated excitatory cell pairs (e-e); green: inhibitory cell pairs (i-i). Bottom: Correlations during ictal period. Scale bar = 20 s. (B) Average trends of interictal to ictal transition for the initiation and propagation zones. Top: Correlation metric calculated over 1.5 s-wide rolling window (magenta: e-e; green: i-i). Bottom: Difference of e-e and i-i correlations. (C) Correlation metric values of i-i pairs and e-e pairs shown separately for −6∼−2 s and −2∼2 s periods relative to the average ictal onset point. (D) Within-seizure correlations of e-e cell pairs (top) and i-i cell pairs (bottom) between initiation and propagation zones.

Similar articles

Cited by

References

    1. Ayala GF, Dichter M, Gumnit RJ, Matsumoto H, Spencer WA. Genesis of epileptic interictal spikes—New knowledge of cortical feedback-systems suggests a neurophysiological explanation of brief paroxysms. Brain Res. 1973;52:1–17. - PubMed
    1. Dichter MA, Ayala GF. Cellular mechanisms of epilepsy—A status-report. Science. 1987;237(4811):157–164. - PubMed
    1. Matsumoto H, Marsan CA. Cortical cellular phenomena in experimental epilepsy—Ictal manifestations. Exp Neurol. 1964;9(4):305–326. - PubMed
    1. Treiman DM. GABAergic mechanisms in epilepsy. Epilepsia. 2001;42(Suppl 3):8–12. - PubMed
    1. Lillis KP, Kramer MA, Mertz J, Staley KJ, White JA. Pyramidal cells accumulate chloride at seizure onset. Neurobiol Dis. 2012;47(3):358–366. - PMC - PubMed

Publication types