. 2022 Feb 22;38(8):110416.
doi: 10.1016/j.celrep.2022.110416.

Astrocyte-neuron crosstalk through Hedgehog signaling mediates cortical synapse development

Affiliations

Astrocyte-neuron crosstalk through Hedgehog signaling mediates cortical synapse development

Yajun Xie et al. Cell Rep. .

Abstract

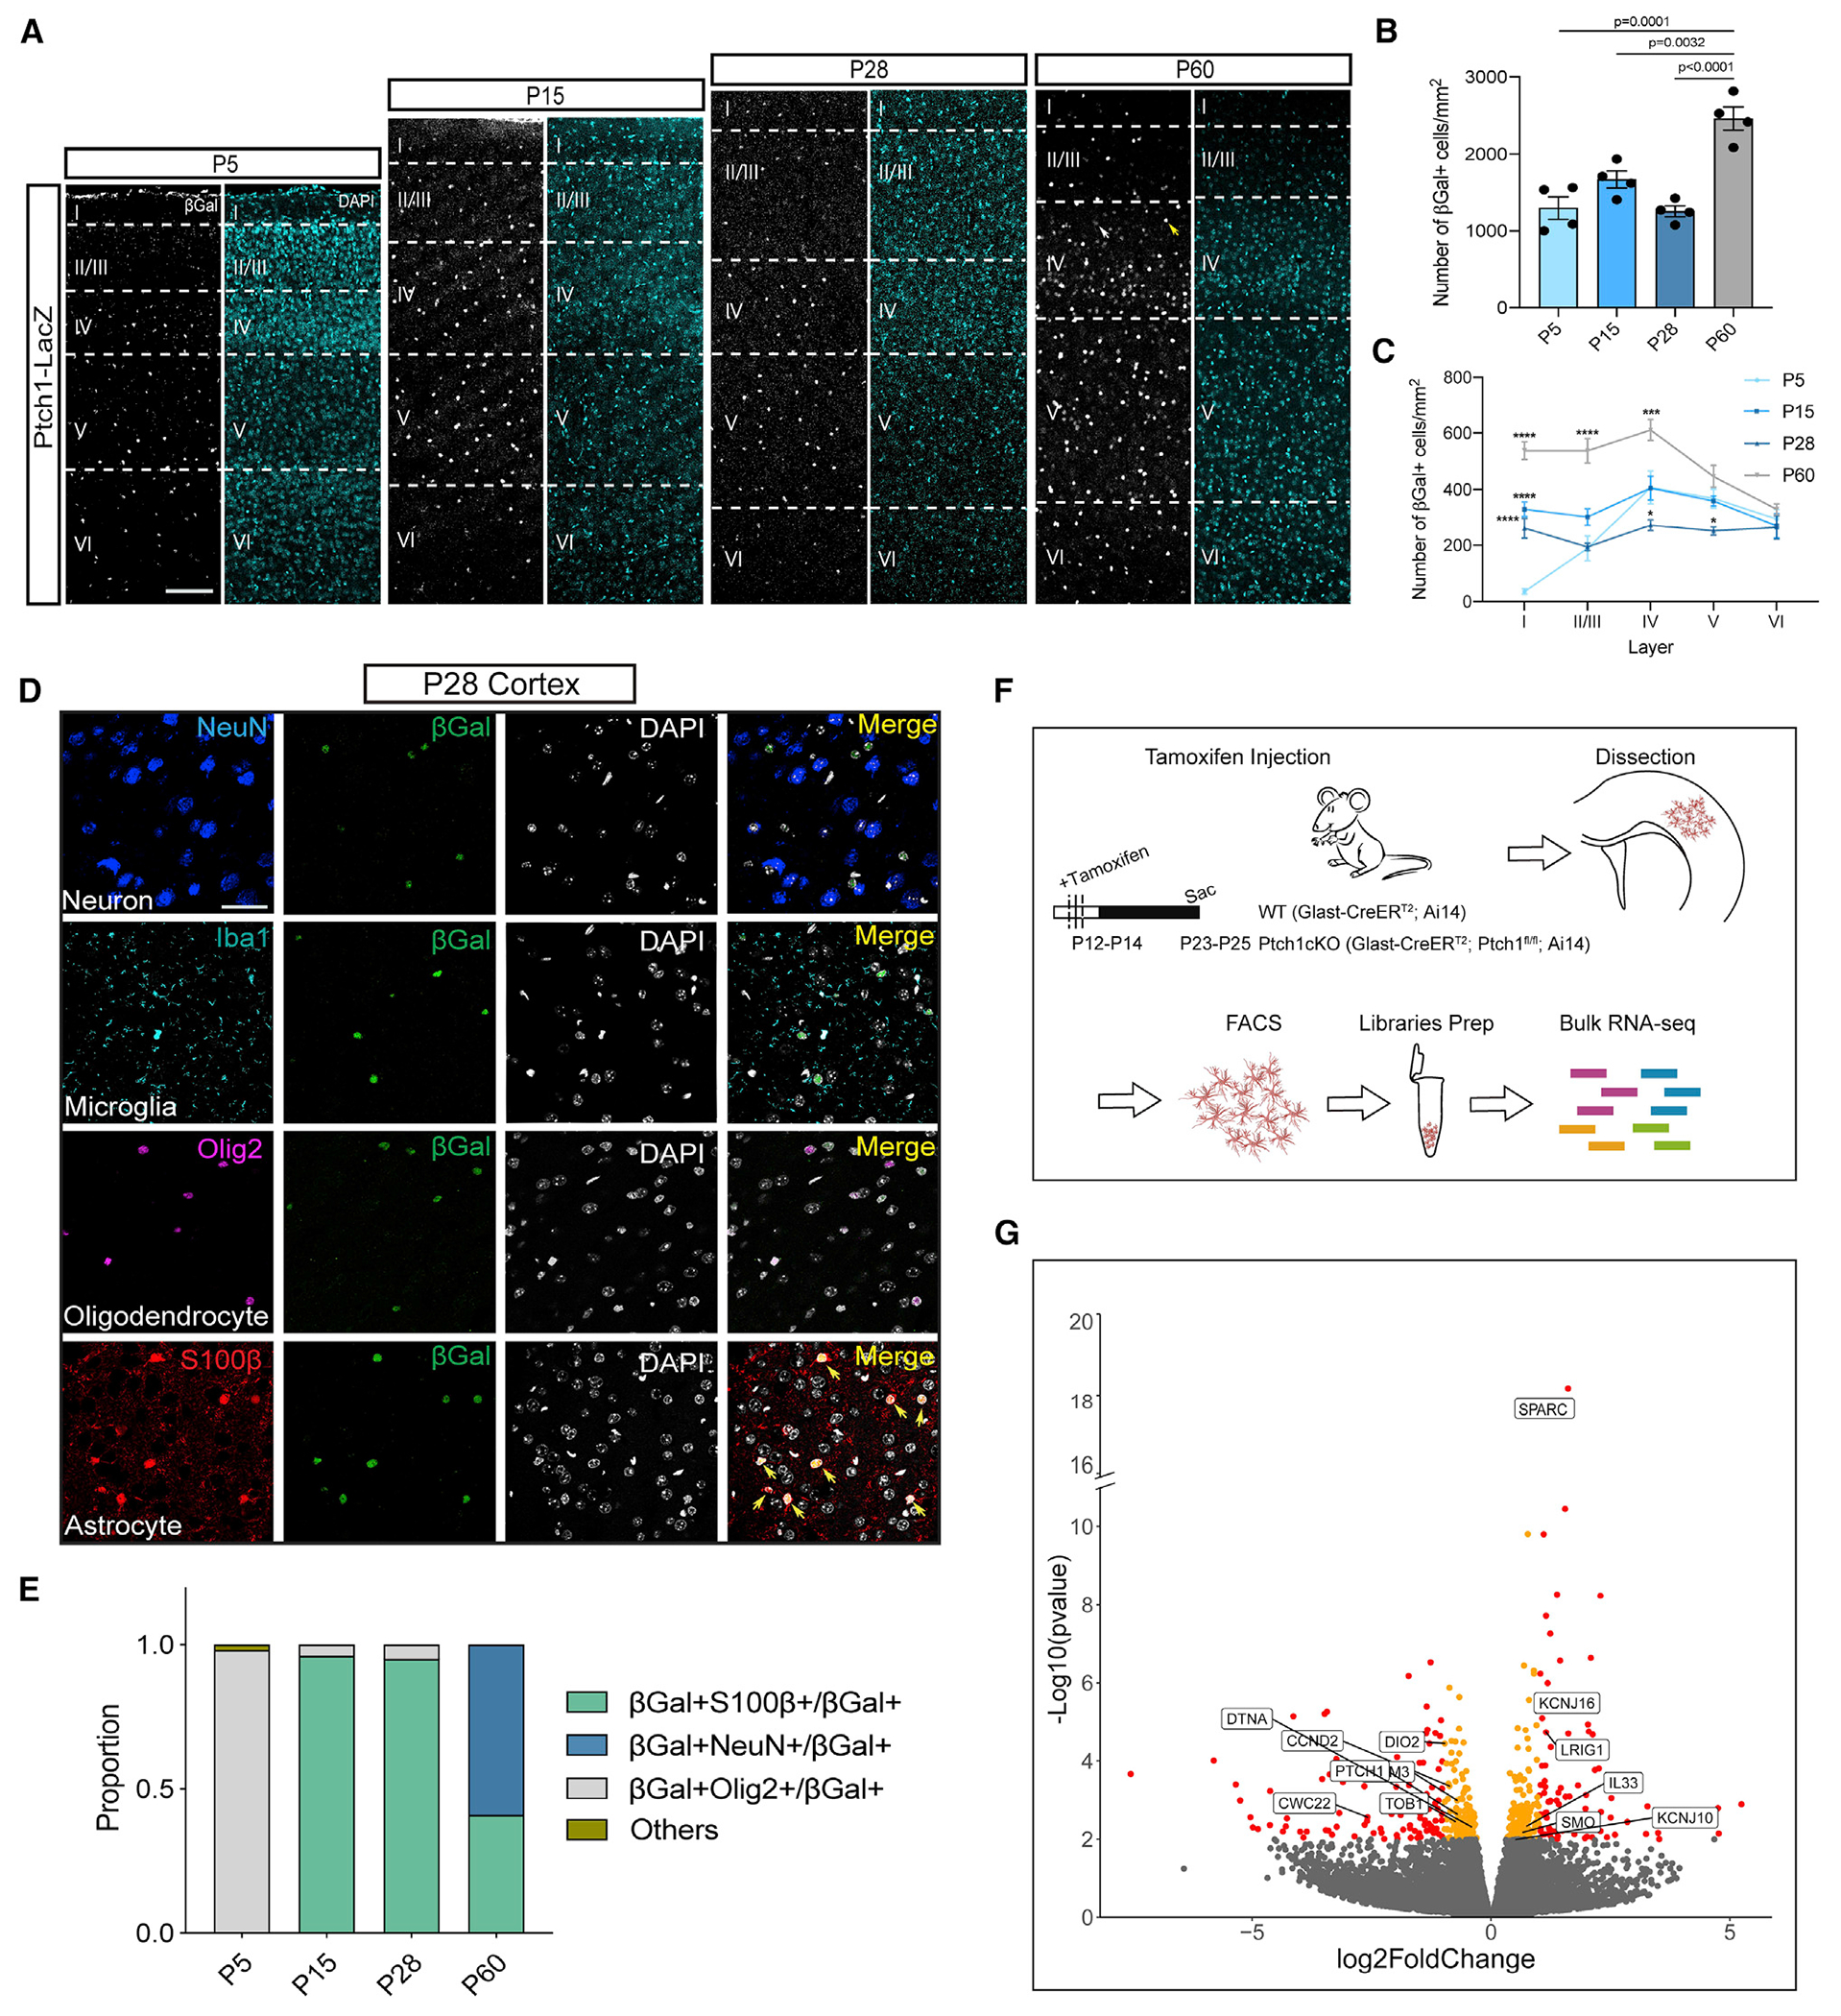
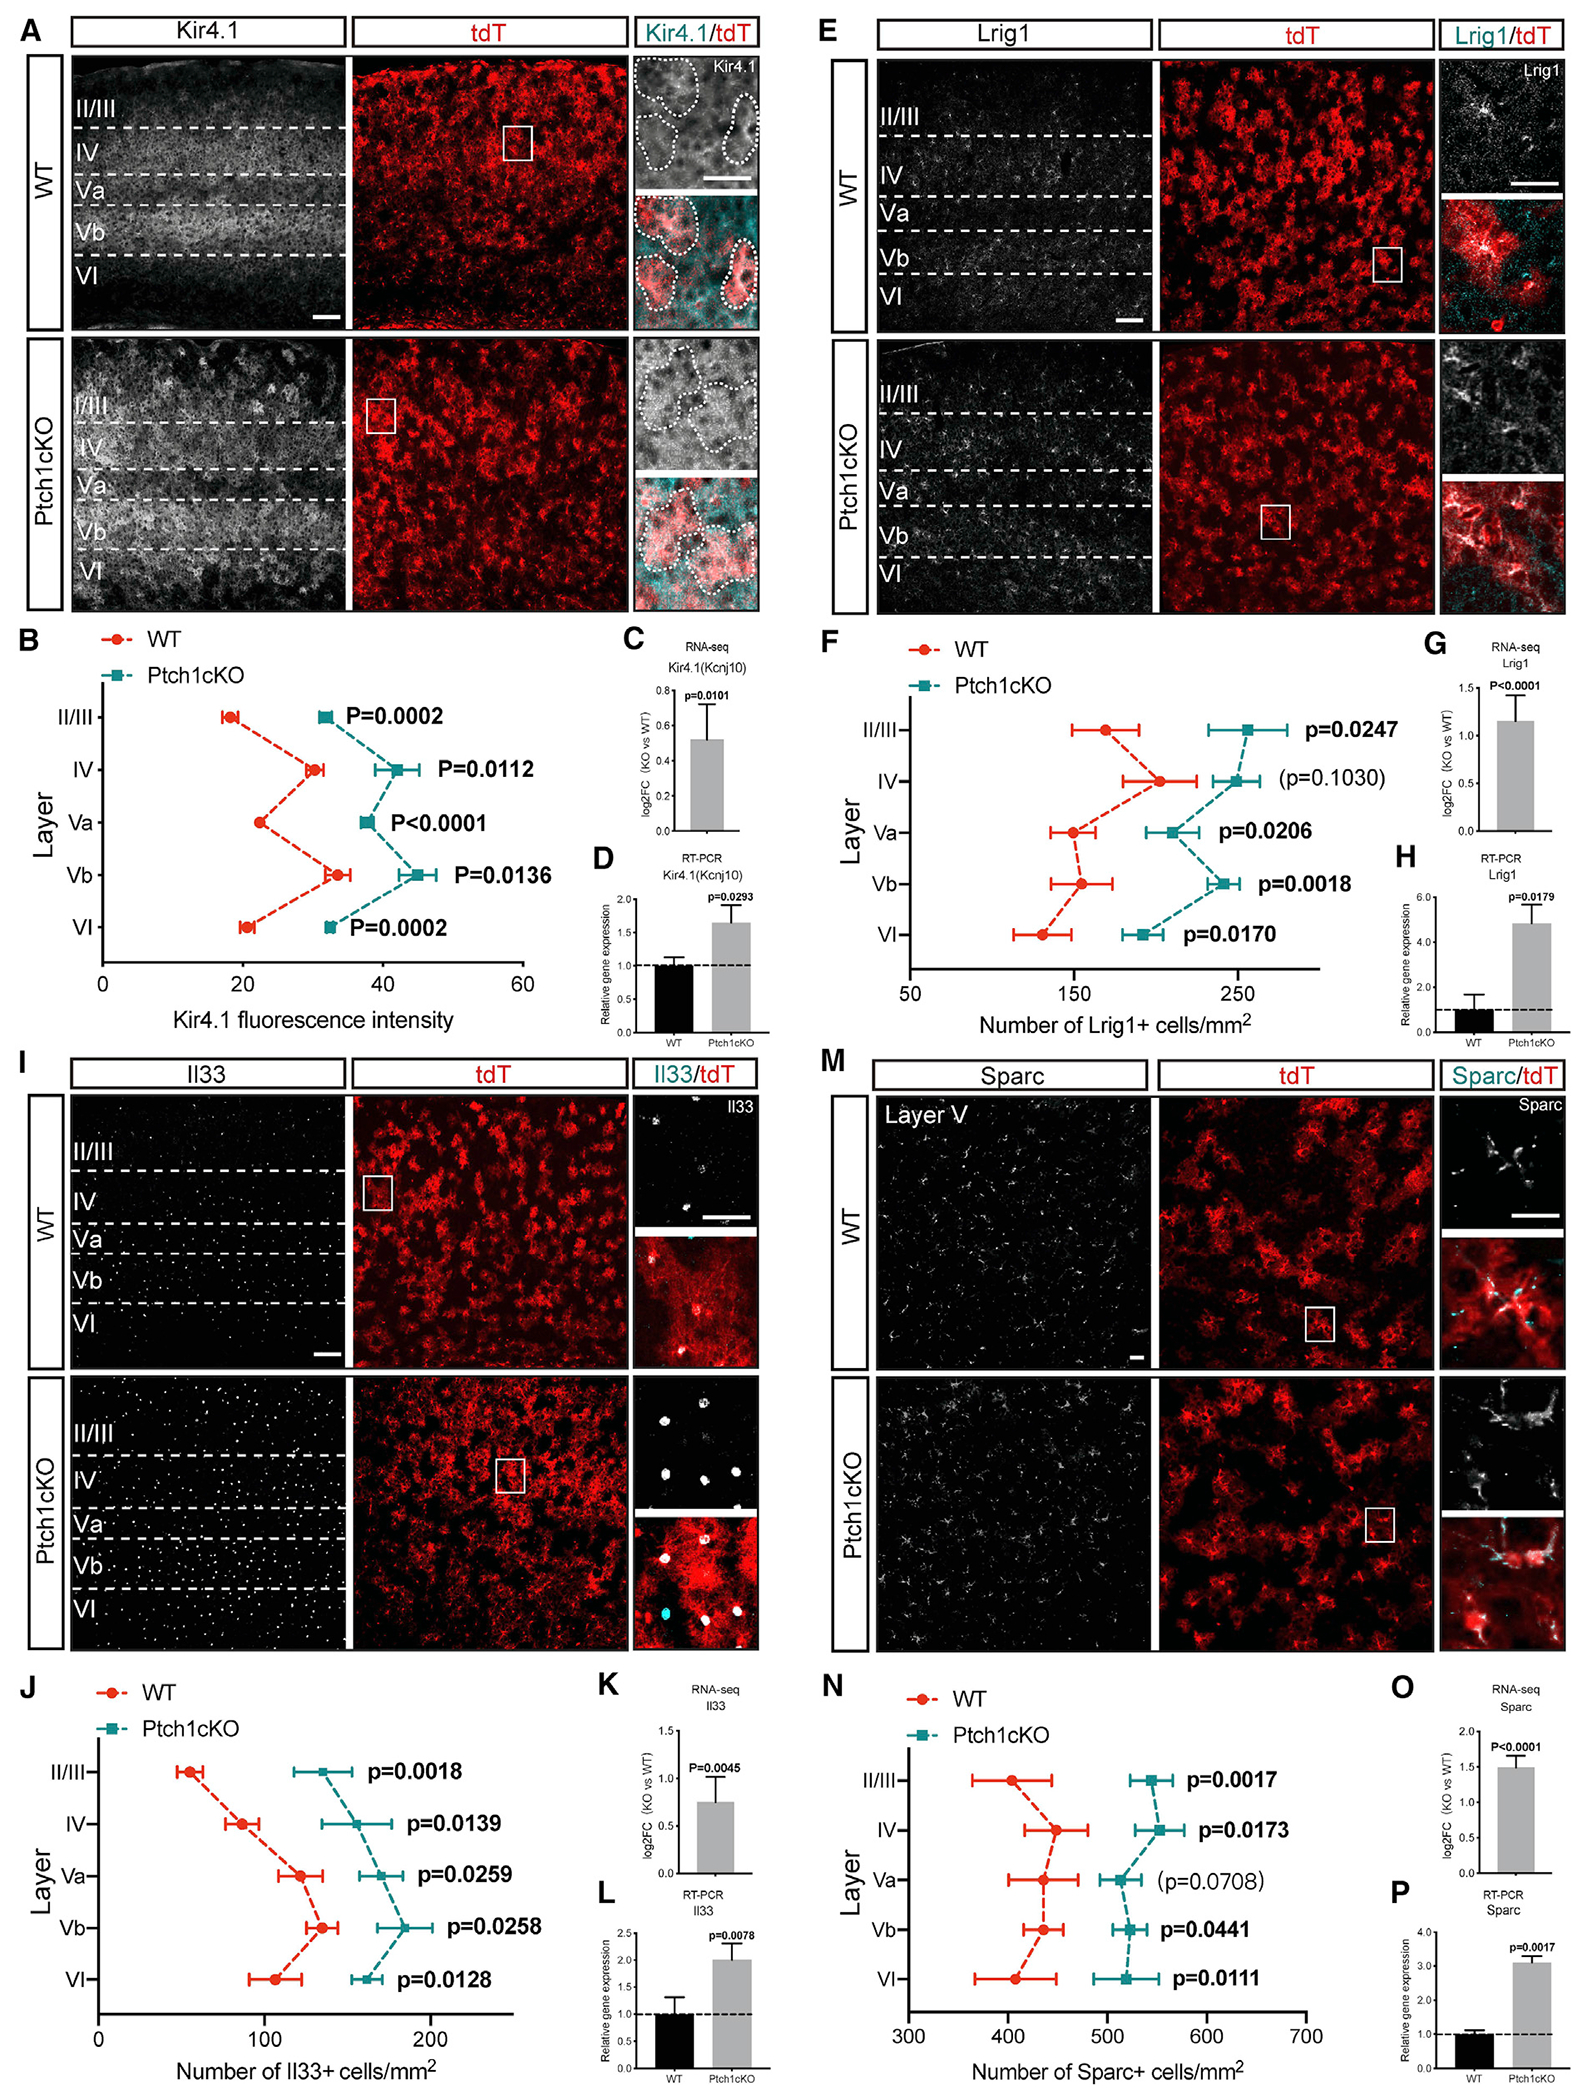
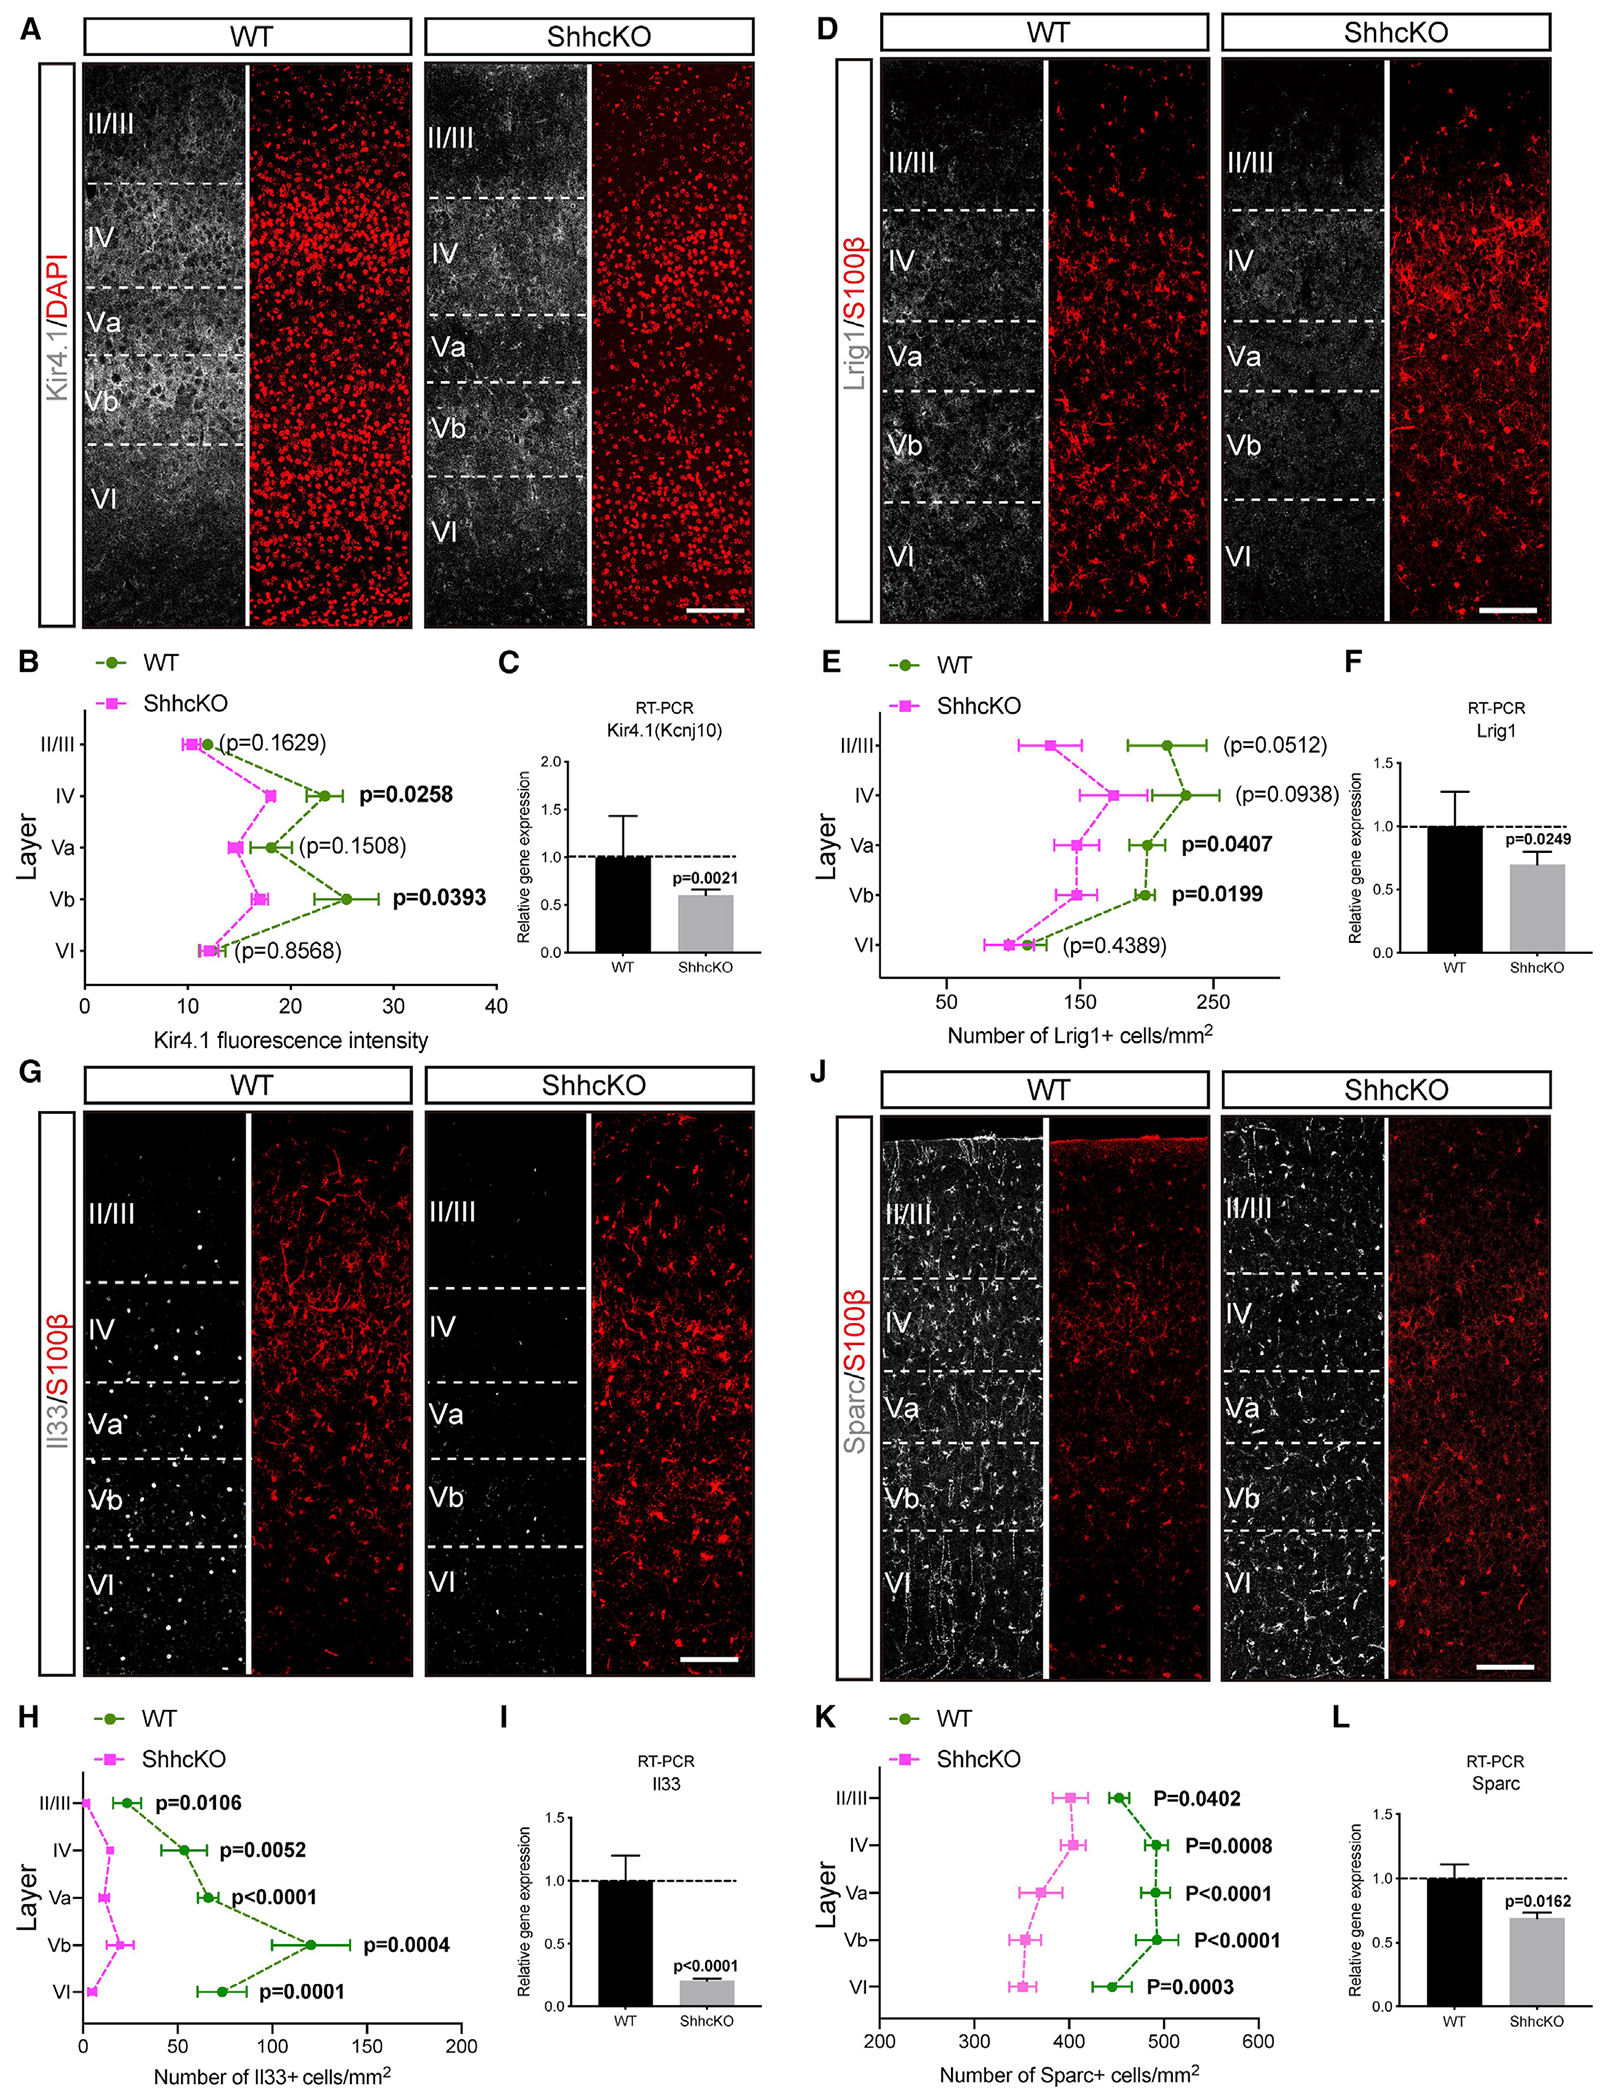
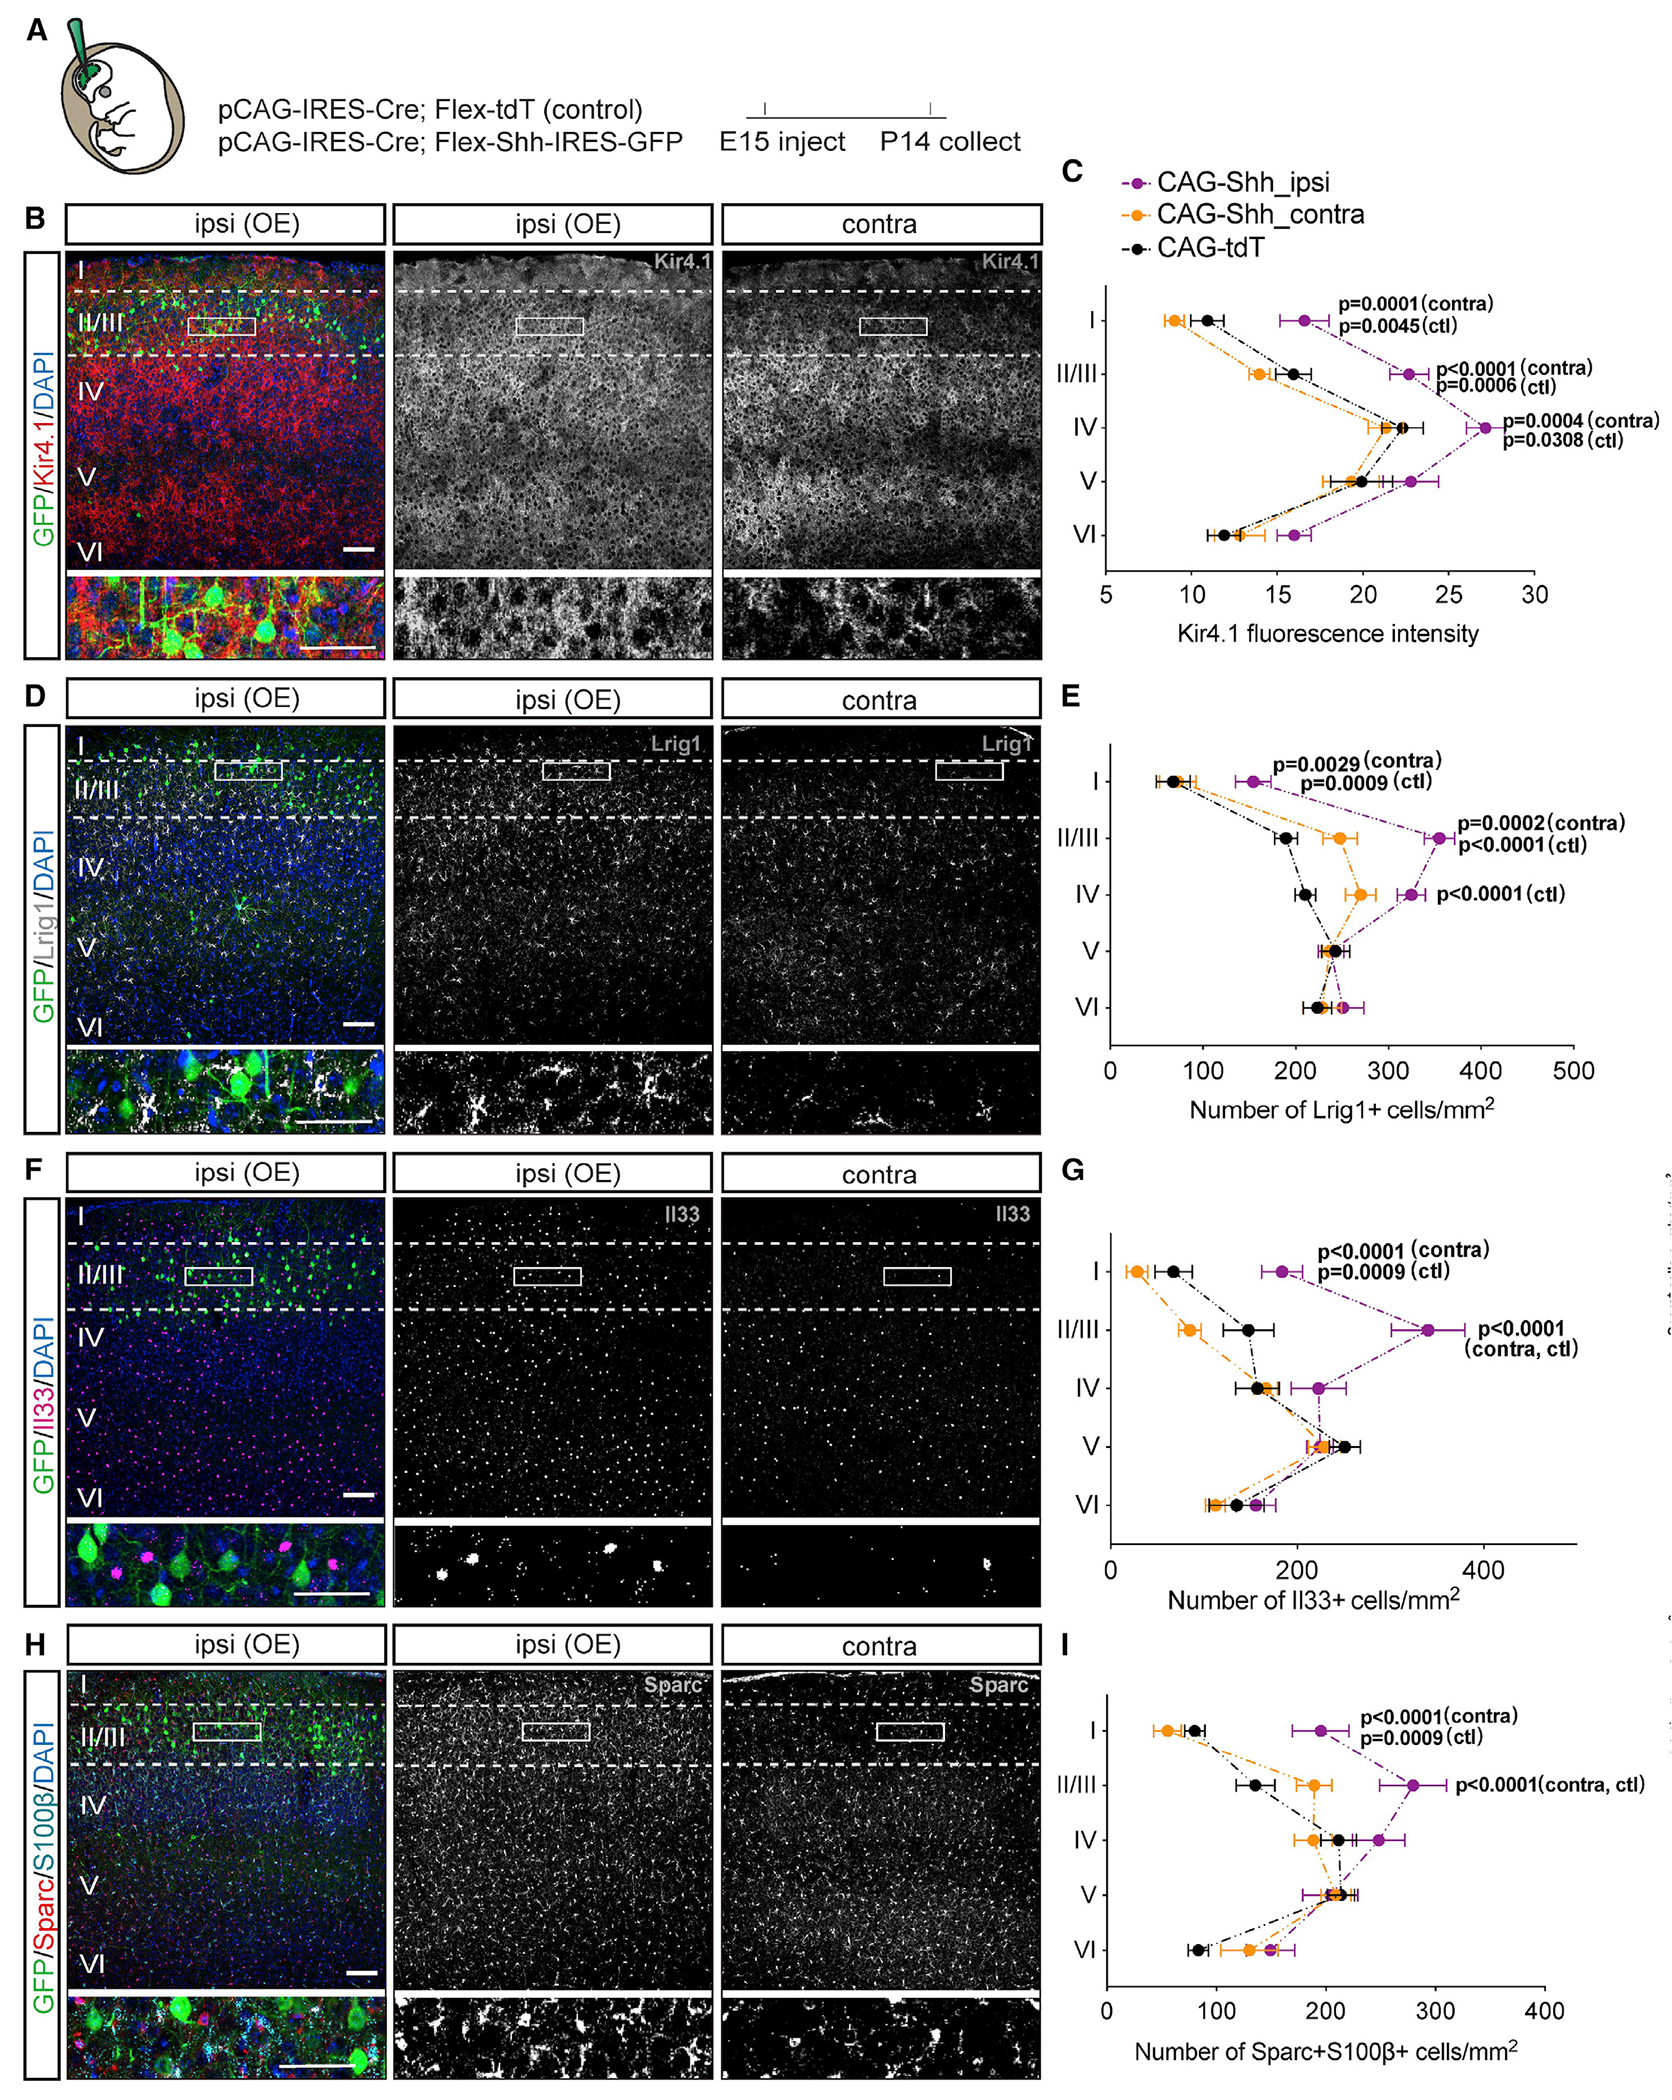
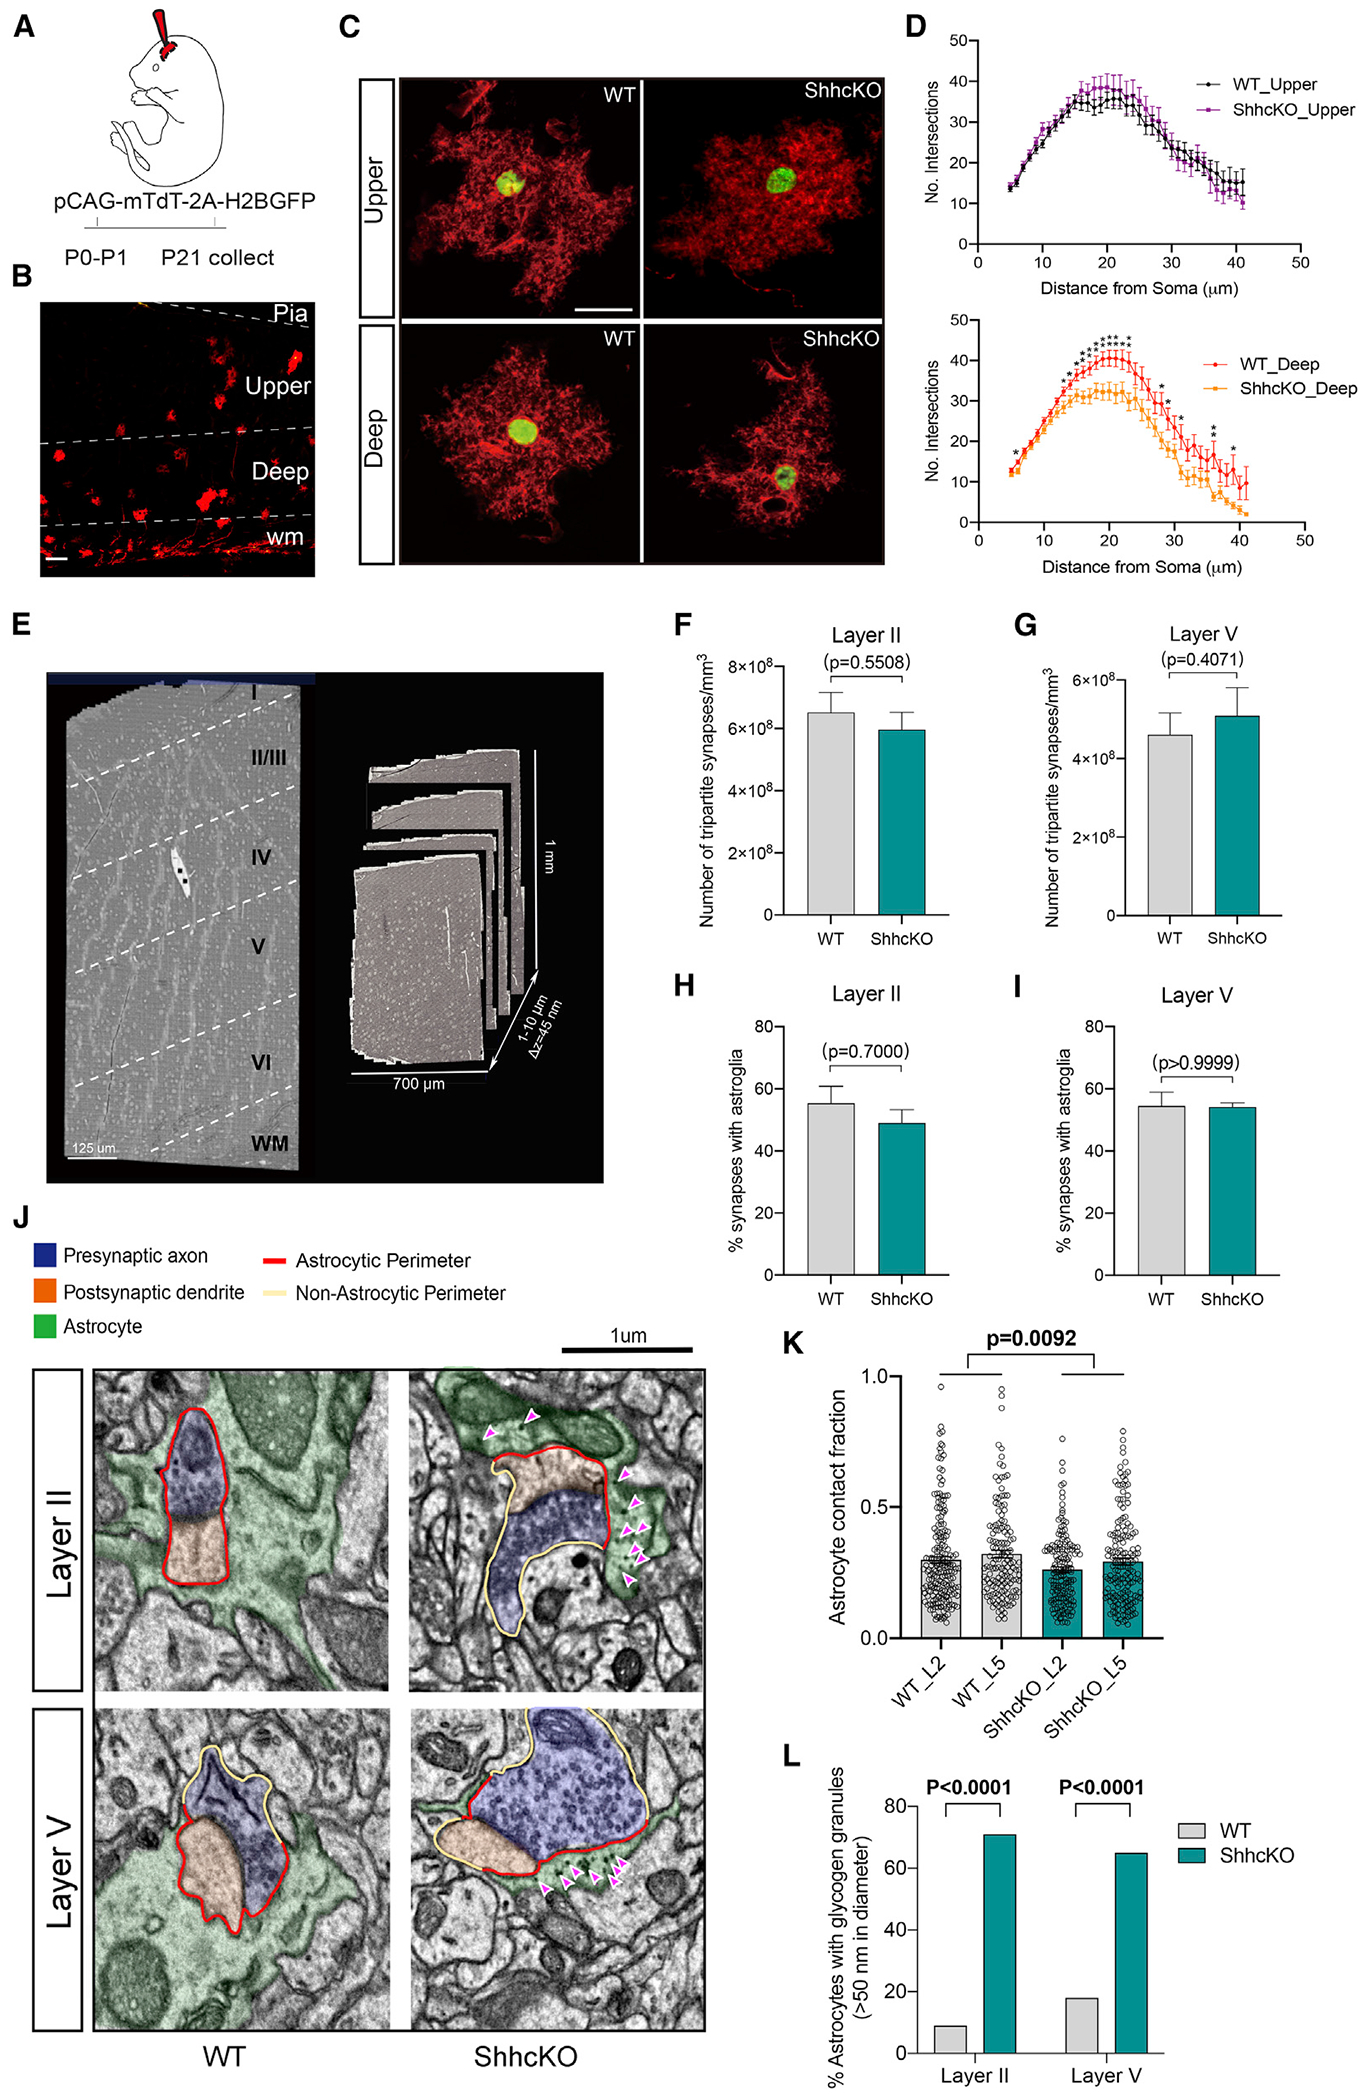
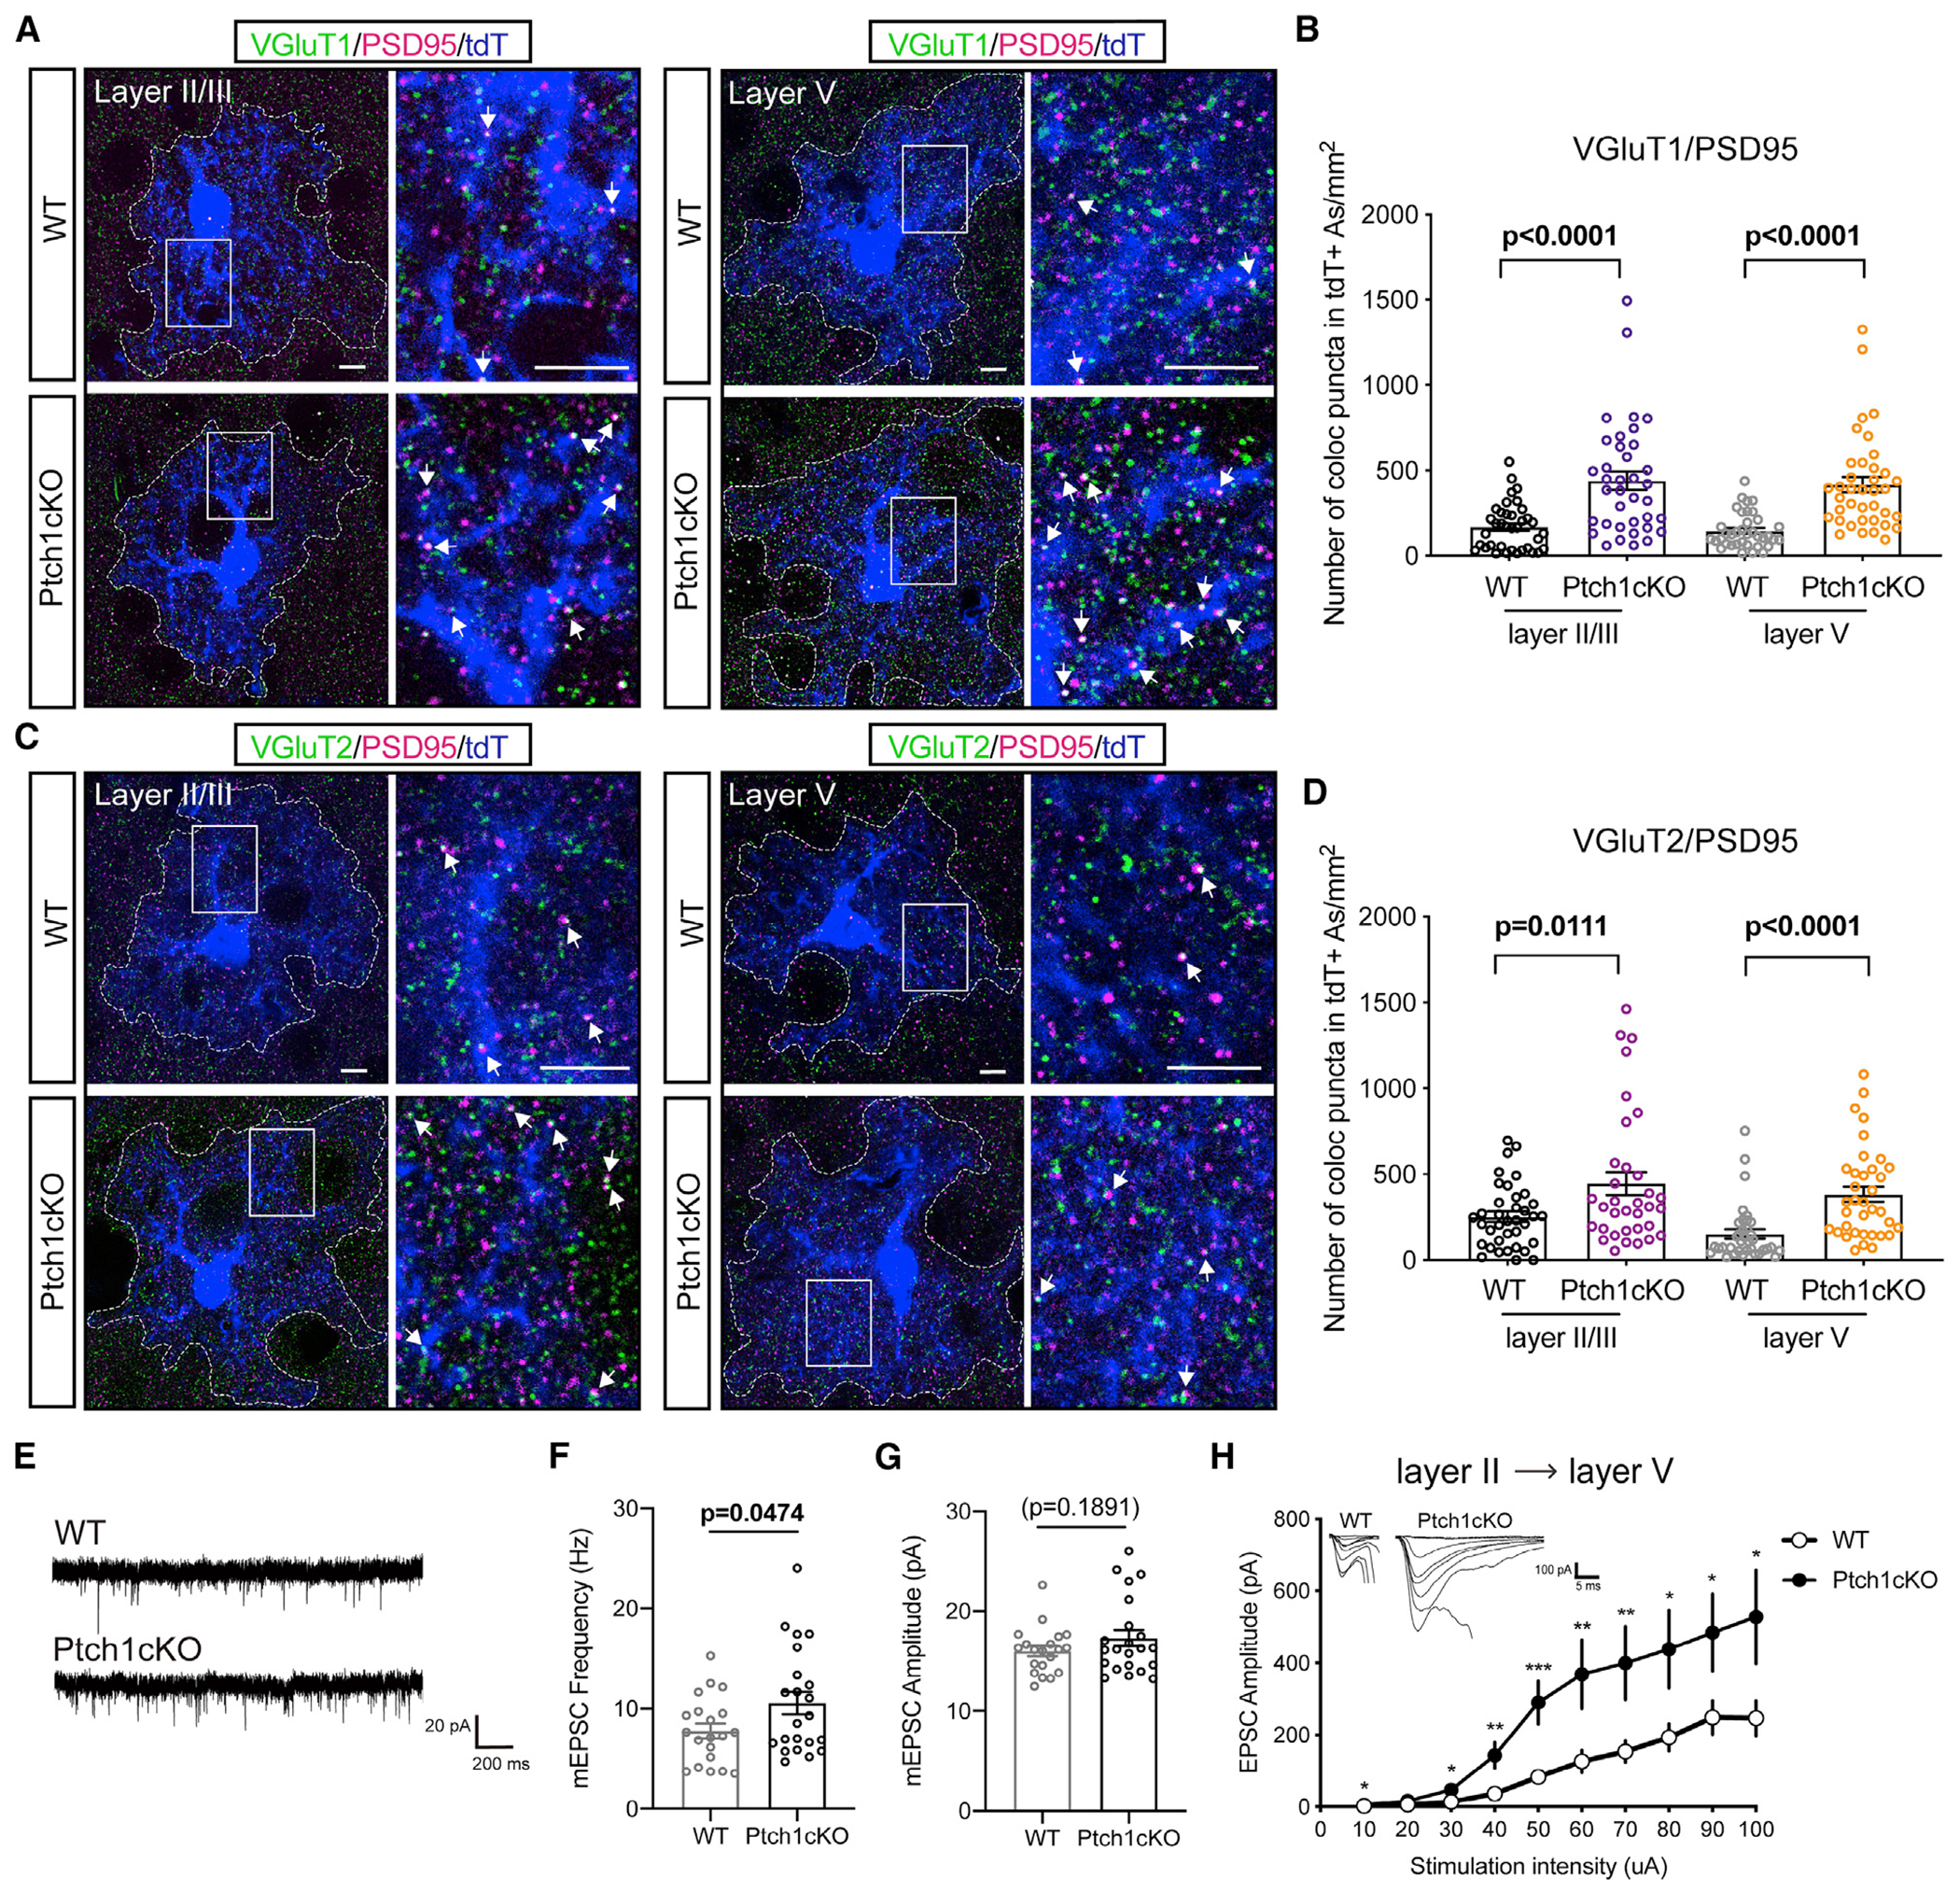
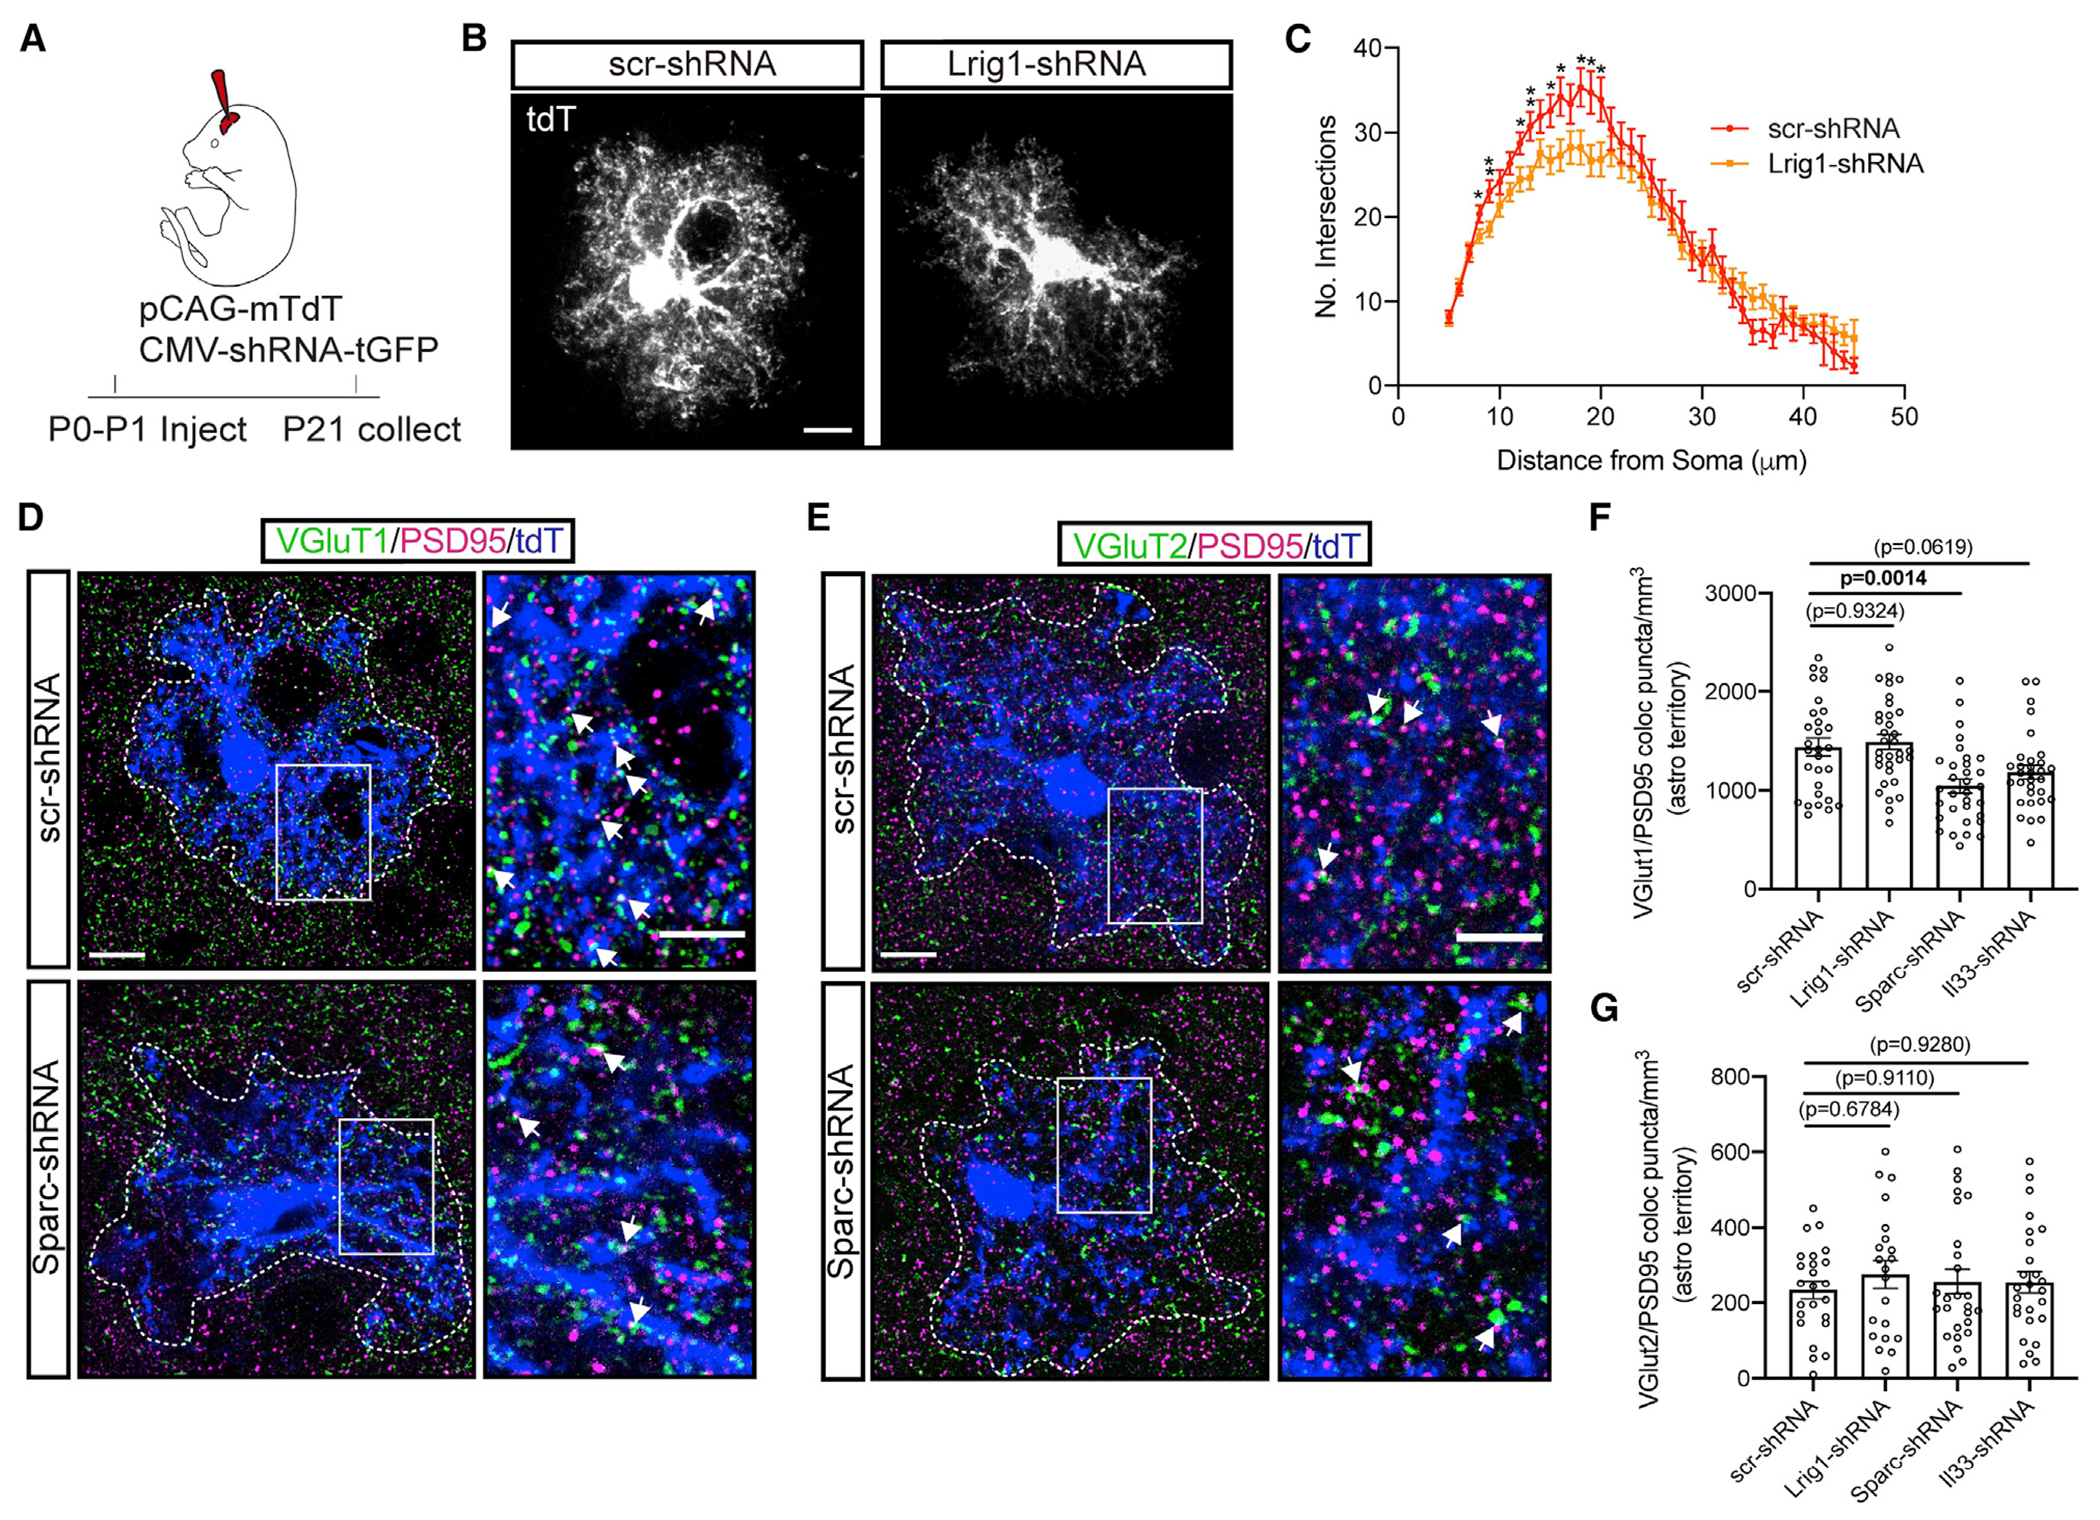
Neuron-glia interactions play a critical role in the regulation of synapse formation and circuit assembly. Here we demonstrate that canonical Sonic hedgehog (Shh) pathway signaling in cortical astrocytes acts to coordinate layer-specific synaptic connectivity. We show that the Shh receptor Ptch1 is expressed by cortical astrocytes during development and that Shh signaling is necessary and sufficient to promote the expression of genes involved in regulating synaptic development and layer-enriched astrocyte molecular identity. Loss of Shh in layer V neurons reduces astrocyte complexity and coverage by astrocytic processes in tripartite synapses; conversely, cell-autonomous activation of Shh signaling in astrocytes promotes cortical excitatory synapse formation. Furthermore, Shh-dependent genes Lrig1 and Sparc distinctively contribute to astrocyte morphology and synapse formation. Together, these results suggest that Shh secreted from deep-layer cortical neurons acts to specialize the molecular and functional features of astrocytes during development to shape circuit assembly and function.

Keywords: Lrig1; Sonic hedgehog; Sparc; astrocytes; cortical circuits; neuron-glia interaction; synapse formation.


Conflict of interest statement

Declaration of interests The authors declare no competing interests.

Figures

Figure 1.
Figure 1.. Ptch1 is specifically expressed in cortical astrocytes during development
(A) Immunostaining for βGal in cortical layers of P5–P60 Ptch1-LacZ mice. White and yellow arrows indicate cells with low and high βGal intensity, respectively. Scale bar, 250 μm. (B) Density of βGal+ in developing cortex. n = 4 mice for each age. (C) Density of βGal+ cells in each cortical layer. The density of βGal+ cells in P15, P28, and P60 cortex, respectively are compared with P5 cortex. n = 4 mice for each age. (D) Immunostaining for cell-type markers combined with βGal and DAPI in P28 Ptch1-LacZ cortex. Yellow arrows indicate representative S100β+βGal+ cells. Scale bar, 50 μm. (E) Proportion of Ptch1-LacZ-expressing cells with corresponding markers in P5-P60 cortex. n = 3 mice for each age. (F) Experimental design for transcriptional profiling of WT and Ptch1cKO cortical astrocytes. (G) Volcano plot showing fold changes of gene expression in Ptch1cKO astrocytes. Red dots, p < 0.01, |log2FoldChange| > 1; orange dots, p < 0.01; remaining dots are gray. Data in (B) and (C) represent mean ± SEM; statistical analyses were one-way ANOVA with Tukey’s multiple comparisons test (B) and two-way ANOVA with Dunnett’s multiple comparisons test (C). Only p values of <0.05 are shown. *p < 0.05, **p < 0.01, ***p < 0.001; n.s., not significant. See also Figures S1 and S2.
Figure 2.
Figure 2.. Expression of Shh target genes is upregulated in Ptch1cKO astrocytes
(A and B) Kir4.1 fluorescence intensity in WT and Ptch1cKO cortex. n = 4 mice for each condition. Scale bar, 100 μm. (C, G, K, and O) RNA-seq fold change of Shh target genes in Ptch1cKO astrocytes compared with WT. n = 4 mice for each condition. (D, H, L, and P) Real-time PCR measurement of Shh target genes in FACS-sorted tdTomato+ astrocytes of WT and Ptch1cKO. n = 4 mice for each condition. (E and F) Density of Lrig1+ cells in WT and Ptch1cKO cortex. WT: n = 5 mice, KO: n = 6 mice. Scale bar, 100 μm. (I and J) Density of Il33+ cells in WT and Ptch1cKO cortex. n = 6 mice for each condition. Scale bar, 100 μm. (M and N) Density of Sparc+ cells in WT and Ptch1cKO layer V cortex. n = 5 mice for each condition. Scale bar, 30 μm. Data represent mean ± SEM; statistical analyses were t test (D, H, L, P) or multiple t test (B, F, J, N). See also Figures S3 and S1’4.
Figure 3.
Figure 3.. Expression of target genes is downregulated in ShhcKO
(A and B) Fluorescence intensity of Kir4.1 in P21 WT and ShhcKO cortex. n = 4 mice for each condition. (C, F, I, and L) Real-time PCR shows relative gene expression of Kir4.1/Kcnj10 (C), Lrig1 (F), Il33 (I), and Sparc (L) from WT and ShhcKO cortex. n = 4 for each condition. (D, E, G, H, J, and K) Density of Lrig1+ cells (D, E), Il33+ cells (G, H), and Sparc+ cells (J, K) in P21 WT and ShhcKO cortex. Lrig1: WT, n = 6 mice; KO, n = 5 mice. Il33: WT, n = 6 mice; KO, n = 7 mice. Sparc: WT, n = 3 mice; KO, n = 4 mice. Data represent mean ± SEM; statistical analyses were t test (C, F, I, L) or multiple t test (B, E, H, K). Scale bars, 100 μm. See also Figure S5.
Figure 4.
Figure 4.. Ectopic expression of Shh in upper-layer neurons increases the expression of target genes in astrocytes
(A) Schematic of in utero electroporation in E15 embryos with control and Shh full-length plasmids. (B–I) Immunostaining analysis of Kir4.1 fluorescence intensity (B, C), number of Lrig1+ cells (D, E), number of Il33+ cells (F, G), and number of Sparc+S100β+ cells (H, I) in Shh plasmid electroporated hemispheres compared with non-electroporated contralateral hemispheres and electroporated controls. n = 5–7 mice for each group. Scale bar, 100 μm. Data represent mean ± SEM; statistical analyses were two-way ANOVA with Tukey’s multiple comparisons test (C, E, G, I).
Figure 5.
Figure 5.. Deletion of Shh reduces astrocyte morphological complexity and coverage of neuronal synapses
(A) Schematic of PALE with pCAG-mTdT-2A-H2BGFP in early postnatal mice. (B) Astrocytes were labeled with tdTomato (processes) and GFP (nuclei) in cortex after PALE. Scale bar, 100 μm. (C) Electroporated astrocytes from upper and deep layers of WT and ShhcKO. Scale bar, 20 μm. (D) Quantification of astrocyte complexity for deep-layer and upper-layer astrocytes. (E) Representative electron microscope image of serial sections from P26 WT mice. Scale bar, 125 μm. (F and G) Density of tripartite synapses in layer II (F) or layer V (G) of WT and ShhcKO cortex. (H and I) Proportion of tripartite synapses in layer II (H) or layer V (I) of WT and ShhcKO cortex. (J) Representative electron microscopy images acquired from layer II and layer V cortex of WT and ShhcKO. Magenta arrows indicate dark glycogen granules in astrocytic processes. Scale bar, 1 μm. (K) Quantification of astrocyte ensheathment of synapses in layer II and layer V cortex of WT and ShhcKO. Layer II: WT (n = 194 synapses), KO (n = 162 synapses); Layer V: WT (n = 142 synapses), KO (n = 166 synapses). (L) Proportion of astrocytes with intensely labeled glycogen granules (>50 nm in diameter). Data represent mean ± SEM; statistical analyses were multiple t test (D), Welch’s test (F, G), Mann-Whitney test (H, I), two-way ANOVA test (K), or chi-squared test (L). See also Figure S6; Tables S1 and S2.
Figure 6.
Figure 6.. Loss of Ptch1 in astrocytes promotes cortical synaptogenesis
(A and C) Immunostaining for VGluT1/PSD95 (A) and VGluT2/PSD95 excitatory synapses (C) in layers II/III and layer V of WT and Ptch1cKO cortical astrocytes. Scale bar, 5 μm. (B and D) Quantification of co-localized puncta density in tdTomato+ astrocyte domains per mm2. N = 4 mice for each condition. (E–G) Recordings of mEPSC from layer V neurons in WT and Ptch1cKO. N = 3 mice for each condition (WT: n = 20 cells; KO: n = 22 cells). (H) Recordings of evoked EPSC from layer V neurons of WT and Ptch1cKO cortex. N = 4 mice for each condition (WT: n = 20 cells; KO: 15 cells). Data represent mean ± SEM; statistical analyses were Welch’s t test (B, D, F, G) or multiple t test (H). *p < 0.05, **p < 0.01, ***p < 0.001; n.s., not significant. See also Figure S7.
Figure 7.
Figure 7.. Knockdown of Shh-dependent genes Lrig1 and Sparc in astrocytes reduces astrocyte complexity and synapse formation, respectively
(A) Schematic of PALE with CMV-shRNA-tGFP and pCAG-mTdT in postnatal mice. (B) P21 PALE astrocytes from deep layers of scramble-shRNA and Lrig1-shRNA groups. Scale bar, 10 μm. (C) Sholl analysis of scramble-shRNA and Lrig1-shRNA astrocytes. scr-shRNA: n = 4 mice; Lrig1-shRNA: n = 6 mice; each group includes 26–35 cells (z stack). (D and E) Immunostaining for VGluT1/PSD95 (D) and VGluT2/PSD95 (E) excitatory synapses in P21 scr-shRNA and Sparc-shRNA groups. Scale bar, 10 μm. (F and G) Quantification of co-localized puncta density in tdTomato+ astrocyte domains. scr-shRNA: n = 4 mice; Lrig1-shRNA: n = 6 mice; Sparc-shRNA: n = 6 mice; Il33-shRNA: n = 7 mice; each V1 group includes 29–33 cells (z stack) and each V2 group includes 23–26 cells. Data represent mean ± SEM; statistical analyses were multiple t test (C) or one-way ANOVA (F, G). See also Figure S8.

Similar articles

Cited by

References

    1. Abbott NJ, Ronnback L, and Hansson E (2006). Astrocyte-endothelial interactions at the blood-brain barrier. Nat. Rev. Neurosci. 7, 41–53. 10.1038/nrn1824. - DOI - PubMed
    1. Akdemir ES, Huang AY, and Deneen B (2020). Astrocytogenesis: where, when, and how. F1000Res 9. 10.12688/f1000research.22405.1. - DOI - PMC - PubMed
    1. Allahyari RV, Clark KL, Shepard KA, and Garcia ADR (2019). Sonic hedgehog signaling is negatively regulated in reactive astrocytes after forebrain stab injury. Sci. Rep. 9, 565. 10.1038/s41598-018-37555-x. - DOI - PMC - PubMed
    1. Allen BL, Song JY, Izzi L, Althaus IW, Kang JS, Charron F, Krauss RS, and McMahon AP (2011). Overlapping roles and collective requirement for the coreceptors GAS1, CDO, and BOC in SHH pathway function. Dev. Cell 20, 775–787. 10.1016/j.devcel.2011.04.018. - DOI - PMC - PubMed
    1. Allen NJ, and Eroglu C (2017). Cell Biology of astrocyte-synapse interactions. Neuron 96, 697–708. 10.1016/j.neuron.2017.09.056. - DOI - PMC - PubMed

Publication types

Substances