. 2022 Feb 22;38(8):110400.
doi: 10.1016/j.celrep.2022.110400.

Systematic illumination of druggable genes in cancer genomes

Affiliations

Systematic illumination of druggable genes in cancer genomes

Junjie Jiang et al. Cell Rep. .

Abstract

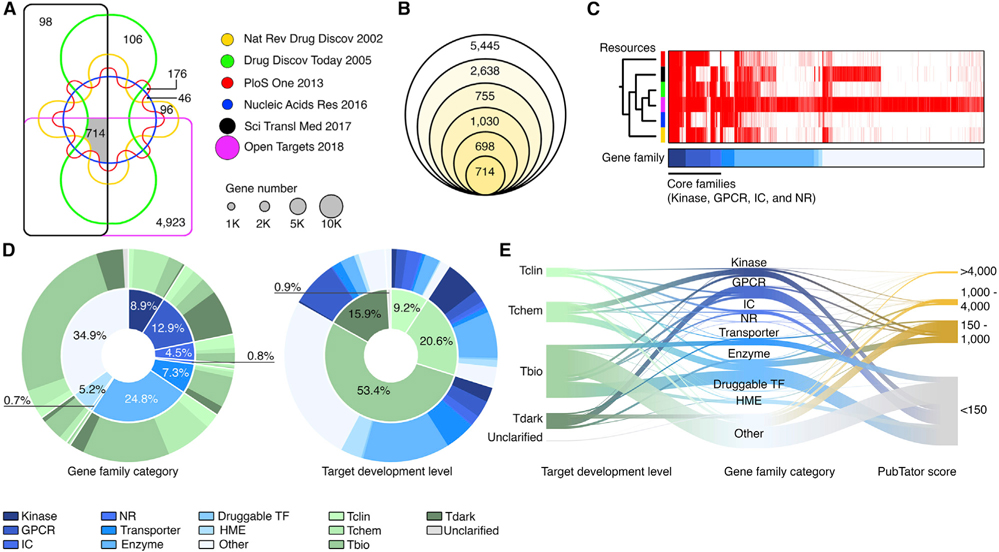
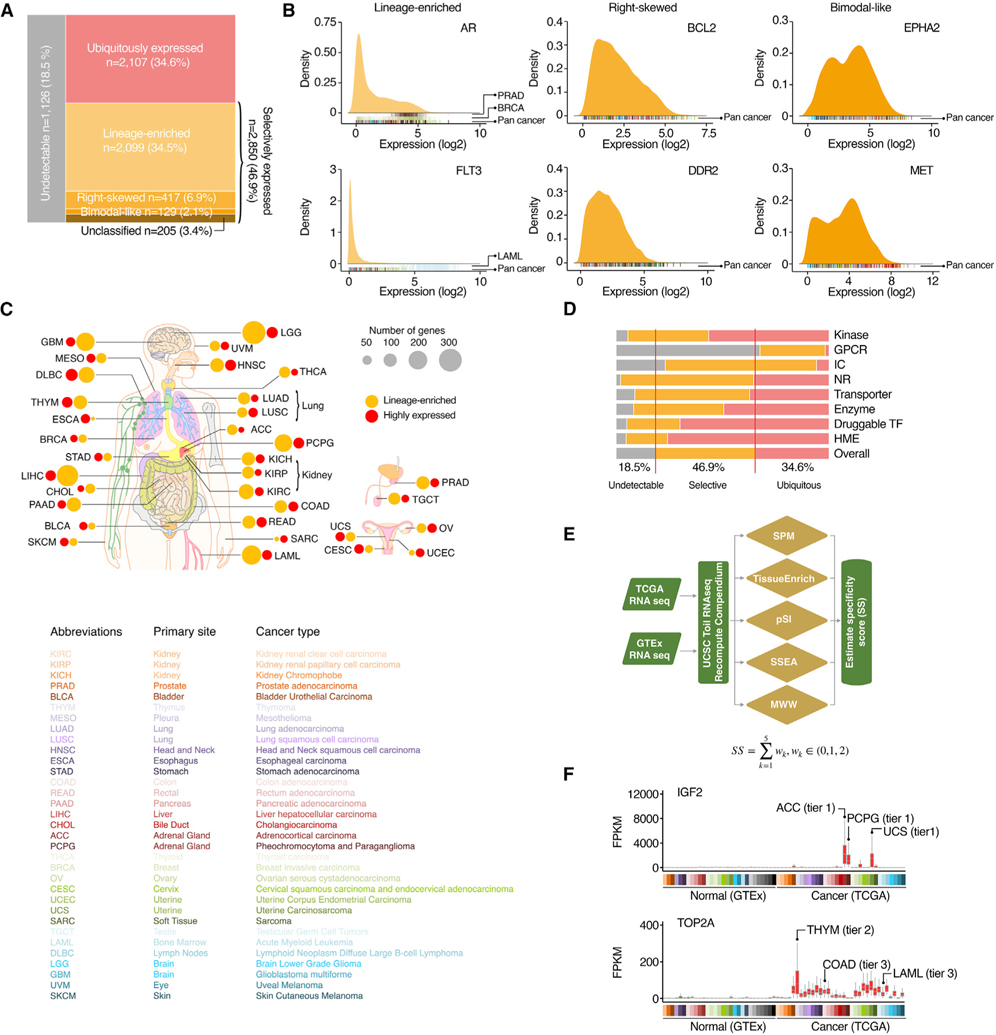
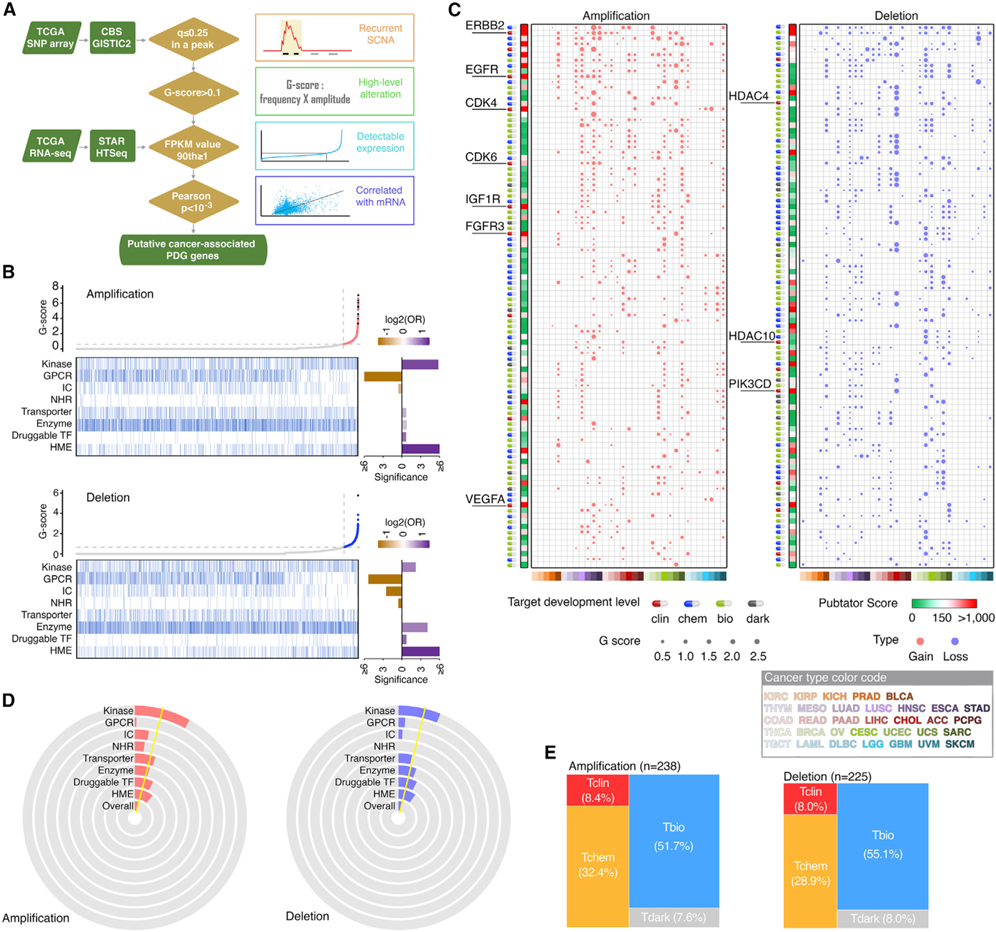
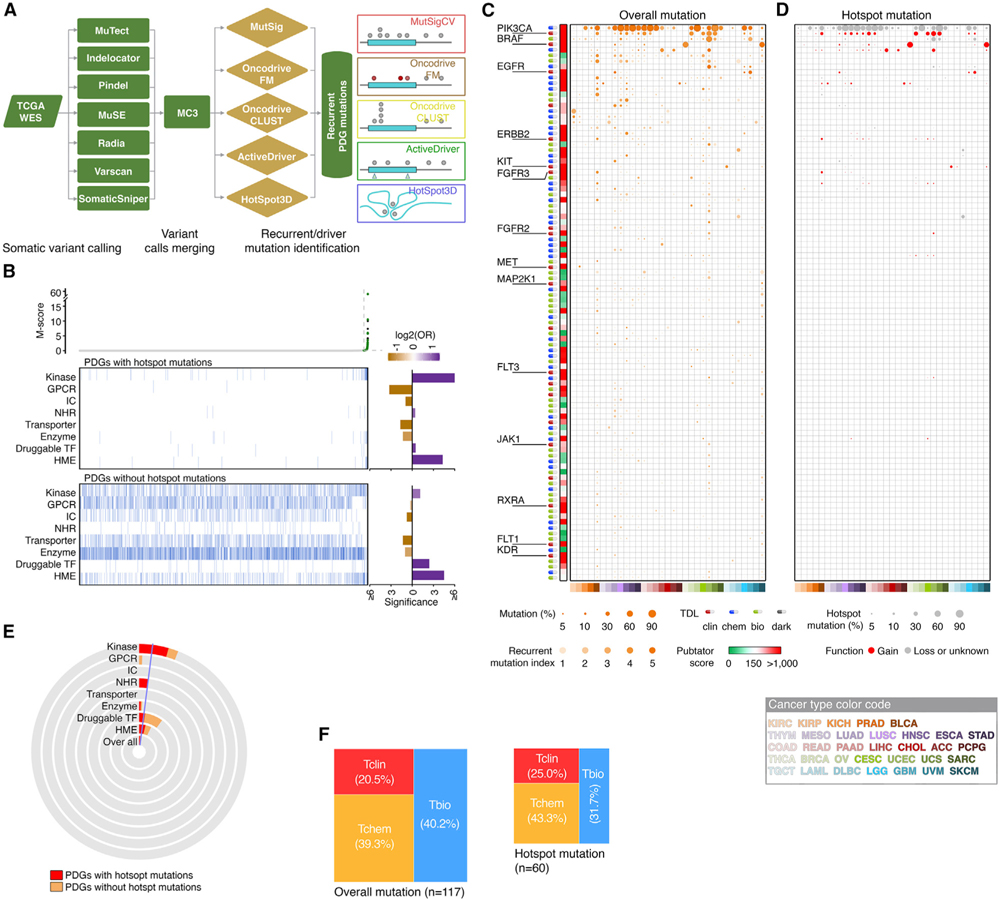
By combining 6 druggable genome resources, we identify 6,083 genes as potential druggable genes (PDGs). We characterize their expression, recurrent genomic alterations, cancer dependencies, and therapeutic potentials by integrating genome, functionome, and druggome profiles across cancers. 81.5% of PDGs are reliably expressed in major adult cancers, 46.9% show selective expression patterns, and 39.1% exhibit at least one recurrent genomic alteration. We annotate a total of 784 PDGs as dependent genes for cancer cell growth. We further quantify 16 cancer-related features and estimate a PDG cancer drug target score (PCDT score). PDGs with higher PCDT scores are significantly enriched for genes encoding kinases and histone modification enzymes. Importantly, we find that a considerable portion of high PCDT score PDGs are understudied genes, providing unexplored opportunities for drug development in oncology. By integrating the druggable genome and the cancer genome, our study thus generates a comprehensive blueprint of potential druggable genes across cancers.

Keywords: CDK7; cancer; cancer dependency; cancer genome; cancer treatment; copy number alterations; druggable; druggable gene; small molecule drug; therapeutics.


Conflict of interest statement

Declaration of interests L.Z. and X.H. report having received research funding from AstraZeneca, Bristol-Myers Squibb/Celgene, and Prelude Therapeutics. O.T. and H.M.C. are employees of AstraZeneca. R.H.V. is an inventor on a licensed patent relating to cancer cellular immunotherapy and receives royalties from Children's Hospital Boston for a licensed research-only monoclonal antibody.

Figures

Figure 1.
Figure 1.. Definition of PDGs in the human genome
(A) Venn diagram shows the gene numbers of six resources. Size of circles: the gene numbers in each dataset. (B) Venn diagram shows the numbers of PDGs that overlap among the six resources. From the inner to the outer circles, the diagrams represent the numbers of the PDGs shared by six (n = 714), five (n = 698), four (n = 1,030), three (n = 755), and two (n = 2,638) datasets, respectively. (C) Heatmap shows the similarity among the six resources, which were ordered by unsupervised clustering. The core gene families contributed a considerable number of overlapping PDGs. (D) Classification of PDGs based on gene family category (left) and target development level (TDL) (right). (E) River plot shows the relationships among gene family category, TDL, and PubTator scores of the PDGs. The width of the bar is proportional to the number of PDGs in each category.
Figure 2.
Figure 2.. Expression of PDGs across cancers
(A) Mosaic plots show the classification of the PDGs based on their expression patterns. (B) Expressional distribution of typical examples of selectively expressed PDGs across cancers. Cancer type of each sample in the density plots is indicated by color code under the plots. (C) Summary of the numbers of lineage-enriched PDGs and PDGs with relatively higher expression in cancer (caPDGs) in each cancer type. Size of circles: number of genes. Orange, lineage-enriched PDGs; red, caPDGs. (D) Percentage of genes in different expression categories for each gene family. (E) Workflow of identifying caPDGs. Five principally different computational strategies were applied to identify caPDGs. (F) Expression levels of typical examples of identified caPDGs across normal and tumor specimens. Cancer types in which the caPDGs were identified are labeled by colors. Based on specificity scores, the identified potential caPDGs were classified into three tiers (high, moderately, and low confident).
Figure 3.
Figure 3.. Somatic copy number alterations of PDGs across cancers
(A) Workflow of somatic copy number alterations (SCNA) analysis. (B) Scatterplots show distribution of overall amplification or deletion G scores of all protein-coding genes, arranged in ascending order of G scores. Heatmaps show PDGs by gene families in the same order as the scatterplots. Bar plots (right) show enrichment of amplified or deleted PDGs in the corresponding gene families. Purple, enriched; orange, depleted. (C) Bubble plots show the SCNA G scores of the top 100 PDGs driven by SCNAs across cancers. Left, copy number gain; right, copy number loss. Size of bubbles, G score; red, gain; blue, loss. Heatmap (left) show the PubTator scores. Green, <150 (understudied genes); red, >150. Target development level of each gene is indicted by color codes. (D) Pie diagrams show the percentage of amplified and deleted PDGs in each gene family. Yellow line indicates the overall percentage across all PDGs. (E) Mosaic plots show the distribution of amplified and deleted PDGs in each TDL.
Figure 4.
Figure 4.. Somatic mutations of PDGs across cancers
(A) Workflow of mutation analysis. (B) Scatterplots show distribution of overall M scores of all protein-coding genes, arranged in ascending order of M scores. Heatmaps show PDGs with (upper) or without (lower) hotspot mutations, displayed by gene families and in the same order as the scatterplots. Bar plots (right) show enrichment of mutated PDGs in the corresponding gene families. Purple, enriched; orange, depleted. (C) Bubble plot show the mutation frequencies and recurrent mutation indexes of the top 100 cancer-associated PDGs driven by somatic mutations across cancers. Size of bubbles, overall mutation frequency; intensity of color, recurrent mutation index. Heatmap (left) shows PubTator scores. Green, <150 (understudied genes); red, >150. Target development level of each gene is indicted by color codes. (D) Bubble plot show frequencies of hotspot mutations in the PDGs presented in (B) (genes are arranged in the same order). Size of bubbles: hotspot mutation frequency. Hotspot mutations that were predicted as gain-of-function mutations are indicated as red. (E) Pie diagrams show the percentage of mutated PDGs with (red) or without (orange) hotspot mutations in each gene family. Blue line indicates the overall percentage of mutation across all PDGs. (F) Mosaic plots show the distribution of mutated PDGs for each TDL. Left, overall mutation, right, hotspot mutation.
Figure 5.
Figure 5.. Cancer dependency of PDGs across cancer cell lines
(A) Bar plot shows enrichment of cancer-dependent PDGs in the corresponding gene families. Cancer-dependent PDGs were defined as common essential or strongly selective in the DepMap project. Purple, enriched; orange, depleted. (B) Mosaic plots show the distribution of TDL classes among cancer-dependent PDGs. (C) Volcano plot summarizes correlations between dependency and gene mutation for cancer-dependent PDGs. Each dot represents one cancer-dependent PDG with recurrent mutations. Of the genes whose mutations were significantly correlated with either increased or decreased sensitivity to RNAi knockdown (purple or green, respectively; FDR < 10%), genes with hotspot gain-of-function mutations were highlighted with red circles. (D) Volcano plot summarizes correlations between dependency and gene expression for cancer-dependent PDGs. At the FDR 10% level, the genes whose higher expression levels were significantly correlated with either increased or decreased sensitivity to RNAi knockdown were categorized as group I (purple) or group II (green), respectively. (E) Correlation of gene dependency (x axis, RNAi; y axis, CRISPR) with RNA expression for cancer-dependent PDGs. Purple or green, significant in either RNAi or CRISPR; borders, significant in both analyses; gray, not significant. Coordinates: “signed log q values” by linear regression; negative/positive sign: higher gene expression associated with increased/decreased sensitivity. (F) Percentage of group I (purple) and group II (green) genes in each gene family. (G and H) Correlation of gene dependency (RNAi) with copy number (x axis) and RNA expression (y axis) for amplified PDGs (G) and deleted PDGs (H). Points in pink/green or orange/blue indicate significance in either copy number or expression analysis; points within borders indicate significance in both analyses; points in gray indicate non-significance. Coordinates: “signed log q values” by linear regression; negative sign: high gene expression or copy number associated with increased sensitivity; positive sign: high gene expression or copy number associated with decreased sensitivity; distance from 0: q value; FDR: false discovery rate. (I and J) Correlation of gene dependency (x axis, RNAi; y axis, CRISPR) with copy number for cancer-dependent amplified PDGs (I) and deleted PDGs (J). Each dot represents one cancer-dependent PDG with recurrent copy number alterations (G score for amplification >0.61 or G score for deletion >0.66). Pink/green or orange/blue, significant in either RNAi or CRISPR analysis; borders, significant in both analyses; gray, not significant. Coordinates: “signed log q values” by linear regression; negative/positive sign: higher copy number associated with increased/decreased sensitivity. (K) Cancer cell lines with hemizygous losses of CDK7 were sensitive to CDK7i. Representative colony formation assay of a panel of cancer cell lines treated with a series of dosages of THZ1 for 6 days. CDK7 copy number status of each line was assessed by GISTIC. (L) Manipulation of CDK7 copy number by CRISPR-Cas9. (M) PCR results of wild-type OVCAR5 and two CDK7 hemizygously deleted clones. Bands of 1.7 and 1.1 kb indicate CDK7-deleted and wild-type alleles, respectively. (N) qRT-PCR analysis (top) and western blot (bottom) show CDK7 RNA and protein expression among the indicated cells, respectively. (O and P) Representative colony formation assay (O) and survival fraction (P) of wild-type OVCAR5 and two CDK7 hemizygously deleted clones treated with a series of dosages of THZ1 for 6 days. All experiments were performed in triplicate. Statistical analysis by Student’s t test, *p < 0.05; n = 3. Error bars represent means ± SD.
Figure 6.
Figure 6.. Systematic integration of multidimensional profiles of PDGs across cancers
(A) Illustration of generation of a PCDT score for each PDG in cancer. (B) Workflow of estimation of the PCDT score. (C) A four-module score system provides comprehensive information for identification and prioritization of potential candidates for drug targets in oncology.
Figure 7.
Figure 7.. Large and unexplored opportunities for development of anticancer drugs
(A) Density plots show distribution of core PCDT scores among PDGs stratified by gene families. (B) Bar plot shows enrichment of PDGs with high core PCDT scores in the corresponding gene families. (C) Mosaic plots show distribution of TDL classes within PDGs with high core PCDT scores. (D) Word clouds of the high core PCDT score PDGs in three gene families. Size of fonts: core PCDT score. Color of fonts: target tractability defined by the Open Targets database; red, clinical precedence; pink, discovery precedence; gray, others. (E) Overview of the TCDA data portal.

References

    1. Bailey MH, Tokheim C, Porta-Pardo E, Sengupta S, Bertrand D, Weerasinghe A, Colaprico A, Wendl MC, Kim J, Reardon B, et al. (2018). Comprehensive characterization of cancer driver genes and mutations. Cell 173, 371–385.e318. 10.1016/j.cell.2018.02.060. - DOI - PMC - PubMed
    1. Bausch-Fluck D, Goldmann U, Muller S, van Oostrum M, Muller M, Schubert OT, and Wollscheid B (2018). The in silico human surfaceome. Proc. Natl. Acad. Sci. U S A. 115, E10988–E10997. 10.1073/pnas.1808790115. - DOI - PMC - PubMed
    1. Behan FM, Iorio F, Picco G, Goncalves E, Beaver CM, Migliardi G, Santos R, Rao Y, Sassi F, Pinnelli M, et al. (2019). Prioritization of cancer therapeutic targets using CRISPR-Cas9 screens. Nature 568, 511–516. 10.1038/s41586-019-1103-9. - DOI - PubMed
    1. Benjamini Y, and Hochberg Y (1995). Controlling the false discovery rate: a practical and powerful approach to multiple testing. J. R. Stat. Soc. Ser. B (Methodological) 57, 289–300.
    1. Beroukhim R, Mermel CH, Porter D, Wei G, Raychaudhuri S, Donovan J, Barretina J, Boehm JS, Dobson J, Urashima M, et al. (2010). The landscape of somatic copy-number alteration across human cancers. Nature 463, 899–905. 10.1038/nature08822. - DOI - PMC - PubMed

Publication types

Substances