

Interplay between Brownian motion and cross-linking controls bundling dynamics in actin networks
- PMID: 35196512
- PMCID: PMC9034250
- DOI: 10.1016/j.bpj.2022.02.030
Interplay between Brownian motion and cross-linking controls bundling dynamics in actin networks
Abstract
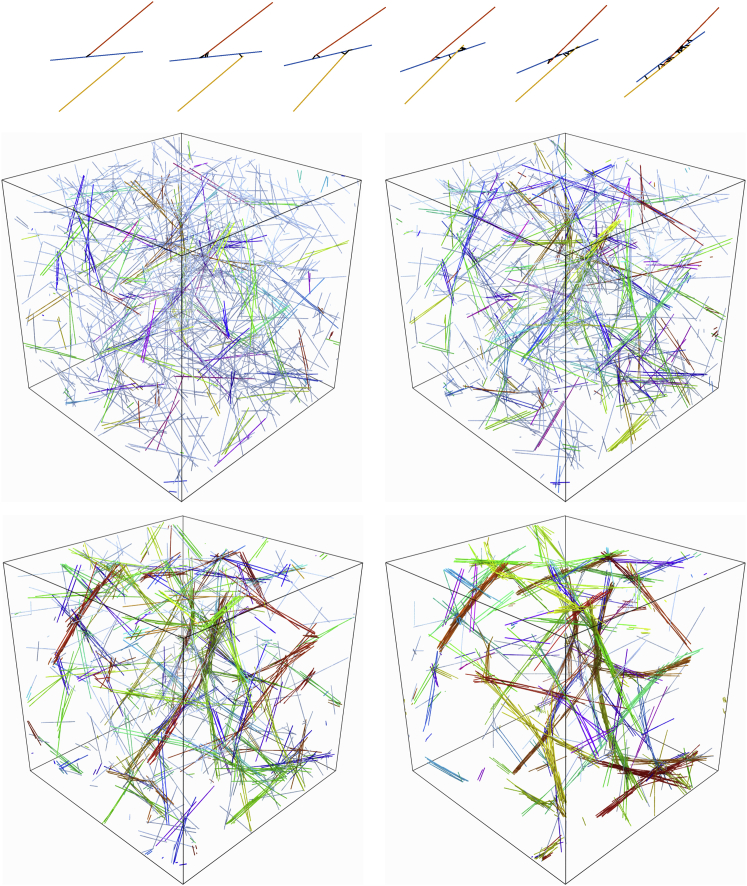
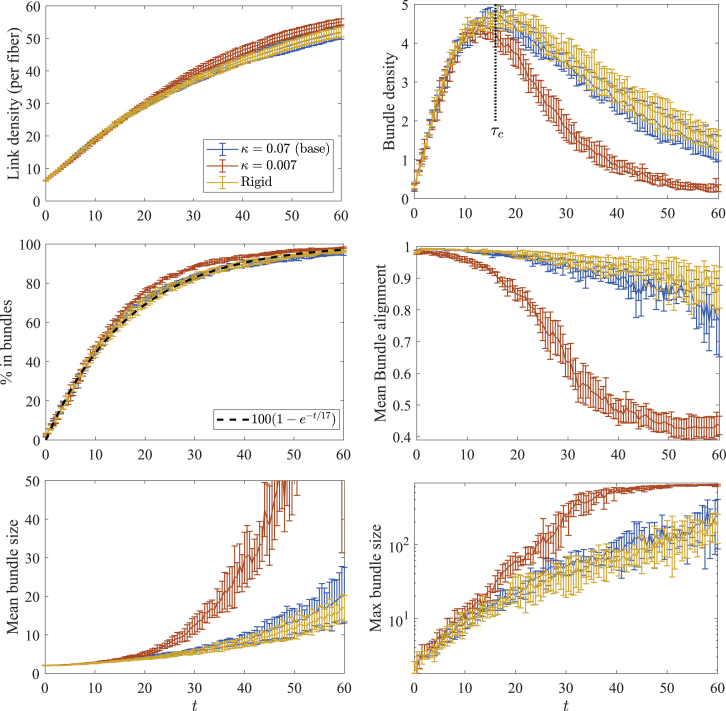
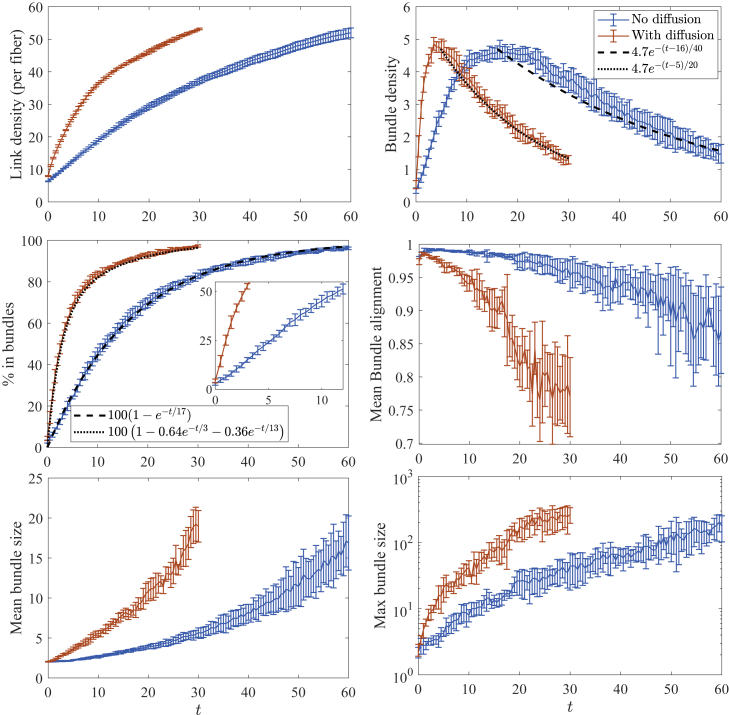
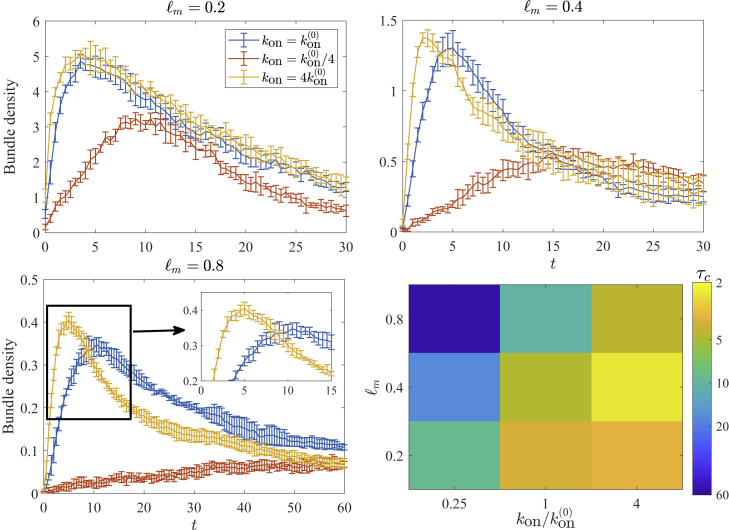
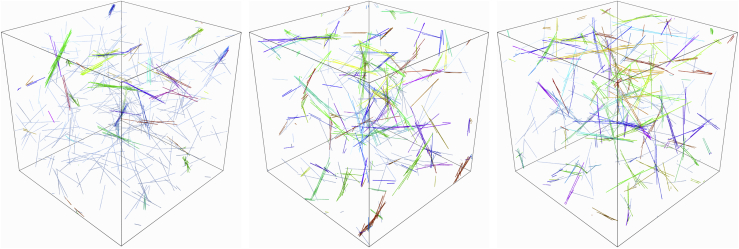
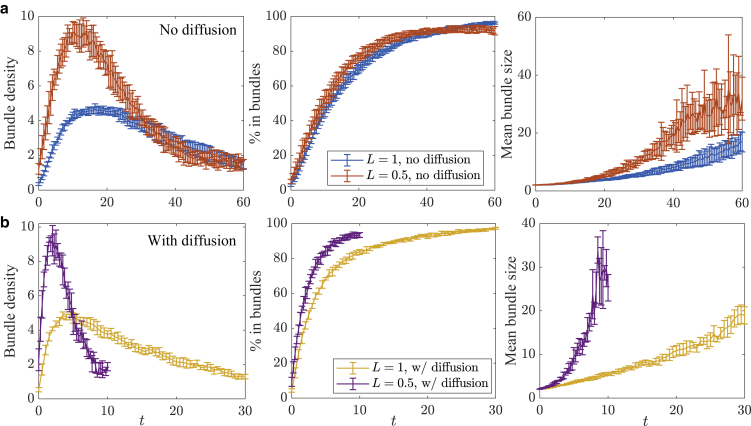
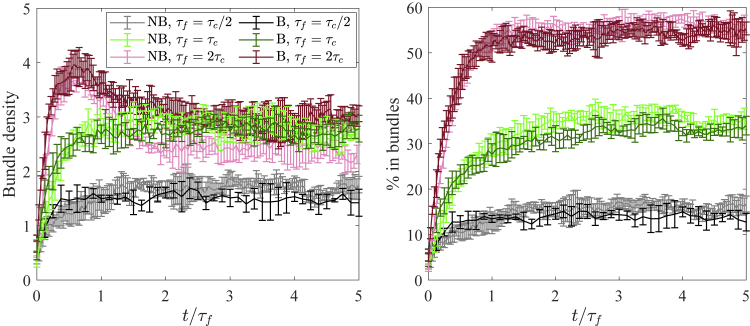
Morphology changes in cross-linked actin networks are important in cell motility, division, and cargo transport. Here, we study the transition from a weakly cross-linked network of actin filaments to a heavily cross-linked network of actin bundles through microscopic Brownian dynamics simulations. We show that this transition occurs in two stages: first, a composite bundle network of small and highly aligned bundles evolves from cross-linking of individual filaments and, second, small bundles coalesce into the clustered bundle state. We demonstrate that Brownian motion speeds up the first stage of this process at a faster rate than the second. We quantify the time to reach the composite bundle state and show that it strongly increases as the mesh size increases only when the concentration of cross-links is small and that it remains roughly constant if we decrease the relative ratio of cross-linkers as we increase the actin concentration. Finally, we examine the dependence of the bundling timescale on filament length, finding that shorter filaments bundle faster because they diffuse faster.
Copyright © 2022 Biophysical Society. Published by Elsevier Inc. All rights reserved.
Figures
Similar articles
-
Organization and dynamics of cross-linked actin filaments in confined environments.Biophys J. 2023 Jan 3;122(1):30-42. doi: 10.1016/j.bpj.2022.11.2944. Epub 2022 Dec 2. Biophys J. 2023. PMID: 36461638 Free PMC article.
-
Simulations of dynamically cross-linked actin networks: Morphology, rheology, and hydrodynamic interactions.PLoS Comput Biol. 2021 Dec 6;17(12):e1009240. doi: 10.1371/journal.pcbi.1009240. eCollection 2021 Dec. PLoS Comput Biol. 2021. PMID: 34871298 Free PMC article.
-
Energetics and dynamics of constrained actin filament bundling.Biophys J. 2006 Jun 15;90(12):4295-304. doi: 10.1529/biophysj.105.076968. Epub 2006 Mar 24. Biophys J. 2006. PMID: 16565053 Free PMC article.
-
Bundling of actin filaments by alpha-actinin depends on its molecular length.J Cell Biol. 1990 Jun;110(6):2013-24. doi: 10.1083/jcb.110.6.2013. J Cell Biol. 1990. PMID: 2351691 Free PMC article.
-
Ultrastructure of protrusive actin filament arrays.Curr Opin Cell Biol. 2013 Oct;25(5):574-81. doi: 10.1016/j.ceb.2013.04.003. Epub 2013 Apr 29. Curr Opin Cell Biol. 2013. PMID: 23639311 Free PMC article. Review.
Cited by
-
Kinetochore- and chromosome-driven transition of microtubules into bundles promotes spindle assembly.Nat Commun. 2022 Nov 27;13(1):7307. doi: 10.1038/s41467-022-34957-4. Nat Commun. 2022. PMID: 36435852 Free PMC article.
-
A coarse-grained simulation model for colloidal self-assembly via explicit mobile binders.Soft Matter. 2023 Jun 14;19(23):4223-4236. doi: 10.1039/d3sm00196b. Soft Matter. 2023. PMID: 37255223 Free PMC article.
-
Organization and dynamics of cross-linked actin filaments in confined environments.Biophys J. 2023 Jan 3;122(1):30-42. doi: 10.1016/j.bpj.2022.11.2944. Epub 2022 Dec 2. Biophys J. 2023. PMID: 36461638 Free PMC article.
-
Mesoscale molecular assembly is favored by the active, crowded cytoplasm.PRX Life. 2024 Sep;2(3):033001. doi: 10.1103/prxlife.2.033001. Epub 2024 Jul 10. PRX Life. 2024. PMID: 40162127 Free PMC article.
References
-
- Alberts B., Johnson A., et al. Walter P. Garland Science; 2002. Molecular Biology of the Cell.
-
- Lieleg O., Claessens M.M., Bausch A.R. Structure and dynamics of cross-linked actin networks. Soft Matter. 2010;6:218–225.
Publication types
MeSH terms
Substances
LinkOut - more resources
Full Text Sources
