

GWAS of longitudinal trajectories at biobank scale
- PMID: 35196515
- PMCID: PMC8948167
- DOI: 10.1016/j.ajhg.2022.01.018
GWAS of longitudinal trajectories at biobank scale
Abstract
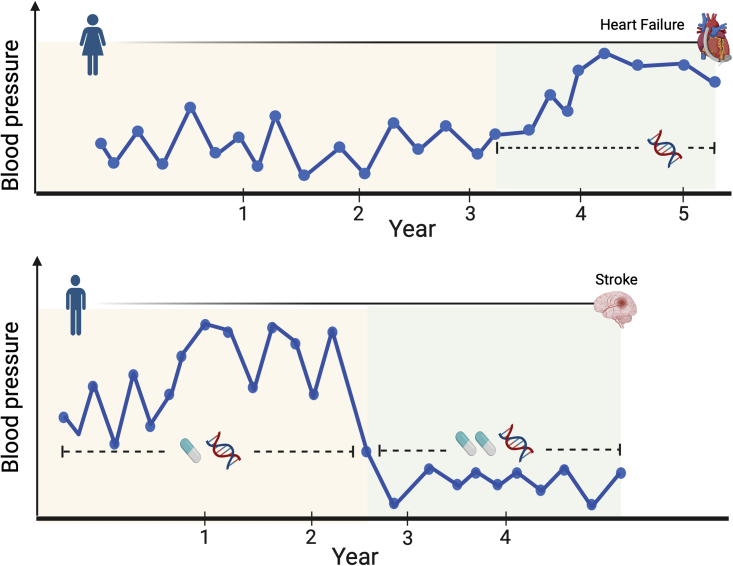
Biobanks linked to massive, longitudinal electronic health record (EHR) data make numerous new genetic research questions feasible. One among these is the study of biomarker trajectories. For example, high blood pressure measurements over visits strongly predict stroke onset, and consistently high fasting glucose and Hb1Ac levels define diabetes. Recent research reveals that not only the mean level of biomarker trajectories but also their fluctuations, or within-subject (WS) variability, are risk factors for many diseases. Glycemic variation, for instance, is recently considered an important clinical metric in diabetes management. It is crucial to identify the genetic factors that shift the mean or alter the WS variability of a biomarker trajectory. Compared to traditional cross-sectional studies, trajectory analysis utilizes more data points and captures a complete picture of the impact of time-varying factors, including medication history and lifestyle. Currently, there are no efficient tools for genome-wide association studies (GWASs) of biomarker trajectories at the biobank scale, even for just mean effects. We propose TrajGWAS, a linear mixed effect model-based method for testing genetic effects that shift the mean or alter the WS variability of a biomarker trajectory. It is scalable to biobank data with 100,000 to 1,000,000 individuals and many longitudinal measurements and robust to distributional assumptions. Simulation studies corroborate that TrajGWAS controls the type I error rate and is powerful. Analysis of eleven biomarkers measured longitudinally and extracted from UK Biobank primary care data for more than 150,000 participants with 1,800,000 observations reveals loci that significantly alter the mean or WS variability.
Keywords: biobank; biomarkers; disease progression; electronic medical records; longitudinal; trend; variations; within-subject variability.
Copyright © 2022 American Society of Human Genetics. Published by Elsevier Inc. All rights reserved.
Conflict of interest statement
Declaration of interests The authors declare no competing interests.
Figures
References
-
- Kerschbaum J., Rudnicki M., Dzien A., Dzien-Bischinger C., Winner H., Heerspink H.L., Rosivall L., Wiecek A., Mark P.B., Eder S., et al. Intra-individual variability of eGFR trajectories in early diabetic kidney disease and lack of performance of prognostic biomarkers. Sci. Rep. 2020;10:19743. - PMC - PubMed
-
- Kanai M., Akiyama M., Takahashi A., Matoba N., Momozawa Y., Ikeda M., Iwata N., Ikegawa S., Hirata M., Matsuda K., et al. Genetic analysis of quantitative traits in the Japanese population links cell types to complex human diseases. Nat. Genet. 2018;50:390–400. - PubMed
