

Estimating SARS-CoV-2 Seroprevalence in Canadian Blood Donors, April 2020 to March 2021: Improving Accuracy with Multiple Assays
- PMID: 35196819
- PMCID: PMC8865569
- DOI: 10.1128/spectrum.02563-21
Estimating SARS-CoV-2 Seroprevalence in Canadian Blood Donors, April 2020 to March 2021: Improving Accuracy with Multiple Assays
Abstract
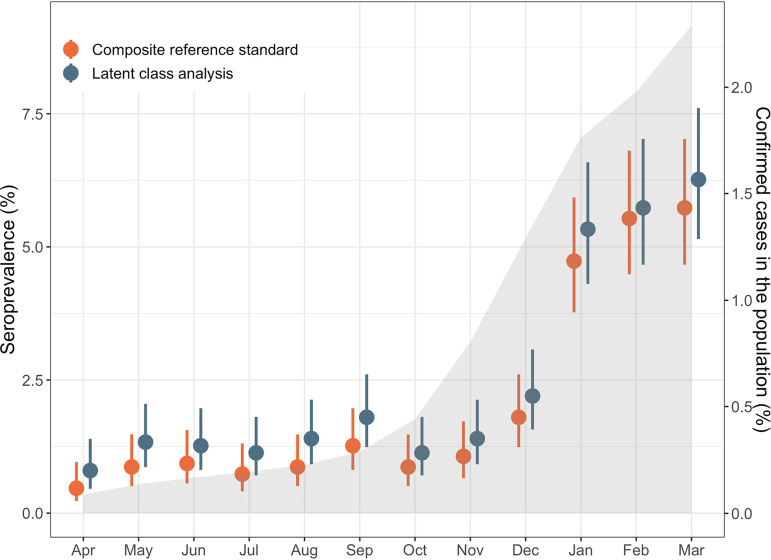
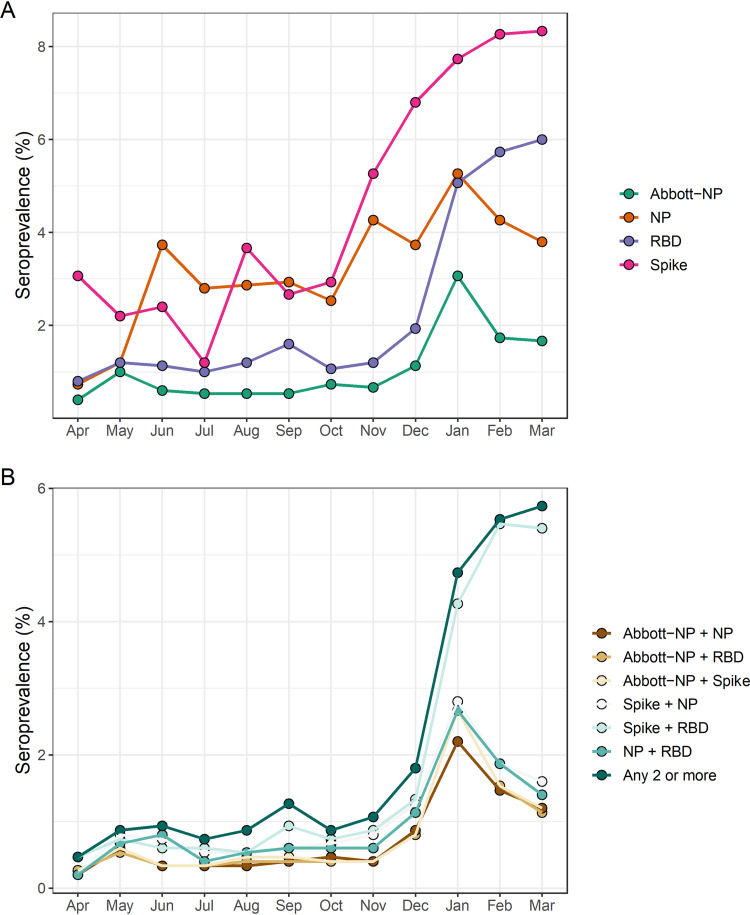
We have previously used composite reference standards and latent class analysis (LCA) to evaluate the performance of laboratory assays in the presence of tarnished gold standards. Here, we apply these techniques to repeated, cross-sectional study of Canadian blood donors, whose sera underwent parallel testing with four separate SARS-CoV-2 antibody assays. We designed a repeated cross-sectional design with random cross-sectional sampling of all available retention samples (n = 1500/month) for a 12 -month period from April 2020 until March 2021. Each sample was evaluated for SARS-CoV-2 IgG antibodies using four assays an Abbott Architect assay targeting the nucleocapsid antigen (Abbott-NP, Abbott, Chicago IL) and three in-house IgG ELISAs recognizing distinct recombinant viral antigens: full-length spike glycoprotein (Spike), spike glycoprotein receptor binding domain (RBD) and nucleocapsid (NP). We used two analytic approaches to estimate SAR-CoV-2 seroprevalence: a composite reference standard and LCA. Using LCA to estimate true seropositivity status based on the results of the four antibody tests, we estimated that seroprevalence increased from 0.8% (95% CI: 0.5-1.4%) in April 2020 to 6.3% (95% CI: 5.1-7.6%) in March 2021. Our study provides further support for the use of LCA in upcoming public health crises, epidemics, and pandemics when a gold standard assay may not be available or identifiable. IMPORTANCE Here, we describe an approach to estimating seroprevalence in a low prevalence setting when multiple assays are available and yet no known gold standard exists. Because serological studies identify cases through both diagnostic testing and surveillance, and otherwise silent, unrecognized infections, serological data can be used to estimate the true infection fatality ratio of a disease. However, seroprevalence studies rely on assays with imperfect sensitivity and specificity. Seroreversion (loss of antibody response) also occurs over time, and with the advent of vaccination, distinction of antibody response resulting from vaccination as opposed to antibody response due to infection has posed an additional challenge. Our approach indicates that seroprevalence on Canadian blood donors by the end of March 2021was less than 10%. Our study supports the use of latent class analysis in upcoming public health crises, epidemics, and pandemics when a gold standard assay may not be available or identifiable.
Keywords: IgG; SARS-CoV-2 antibody; latent class analysis; nucleocapsid; receptor binding domain; spike.
Conflict of interest statement
The authors declare a conflict of interest. The following authors declare no conflicts of interest: S.F.O., D.F., K.T.A., B.R., A.P., K.C., and Q-L.Y. S.J.D. has functioned as a content expert for respiratory viruses for Johnson & Johnson (Janssen), and A-C.G. receives research support from Providence Therapeutics Holdings, Inc. for other projects.
Figures
References
-
- Jones JM, Stone M, Sulaeman H, Fink RV, Dave H, Levy ME, Di Germanio C, Green V, Notari E, Saa P, Biggerstaff BJ, Strauss D, Kessler D, Vassallo R, Reik R, Rossmann S, Destree M, Nguyen K-A, Sayers M, Lough C, Bougie DW, Ritter M, Latoni G, Weales B, Sime S, Gorlin J, Brown NE, Gould CV, Berney K, Benoit TJ, Miller MJ, Freeman D, Kartik D, Fry AM, Azziz-Baumgartner E, Hall AJ, MacNeil A, Gundlapalli AV, Basavaraju SV, Gerber SI, Patton ME, Custer B, Williamson P, Simmons G, Thornburg NJ, Kleinman S, Stramer SL, Opsomer J, Busch MP. 2021. Estimated US infection- and vaccine-induced SARS-CoV-2 seroprevalence based on blood donations, July 2020-May 2021. JAMA 326:1400–1409. doi: 10.1001/jama.2021.15161. - DOI - PMC - PubMed
-
- Saeed S, O'Brien SF, Abe K, Yi Q-L, Rathod B, Wang J, Fazel-Zarandi M, Tuite A, Fisman D, Wood H, Colwill K, Gingras A-C, Drews SJ. 2021. Severe acute respiratory syndrome coronavirus 2 (SARS-CoV-2) seroprevalence: navigating the absence of a gold standard. PLoS One 16:e0257743. doi: 10.1371/journal.pone.0257743. - DOI - PMC - PubMed
-
- Shioda K, Lau MSY, Kraay ANM, Nelson KN, Siegler AJ, Sullivan PS, Collins MH, Weitz JS, Lopman BA. 2021. Estimating the cumulative incidence of SARS-CoV-2 infection and the infection fatality ratio in light of waning antibodies. Epidemiology 32:518–524. doi: 10.1097/EDE.0000000000001361. - DOI - PMC - PubMed
Publication types
MeSH terms
Substances
Grants and funding
LinkOut - more resources
Full Text Sources
Medical
Research Materials
Miscellaneous
