

Visualizing molecular weights differences in supramolecular polymers
- PMID: 35197296
- PMCID: PMC8892509
- DOI: 10.1073/pnas.2121746119
Visualizing molecular weights differences in supramolecular polymers
Abstract
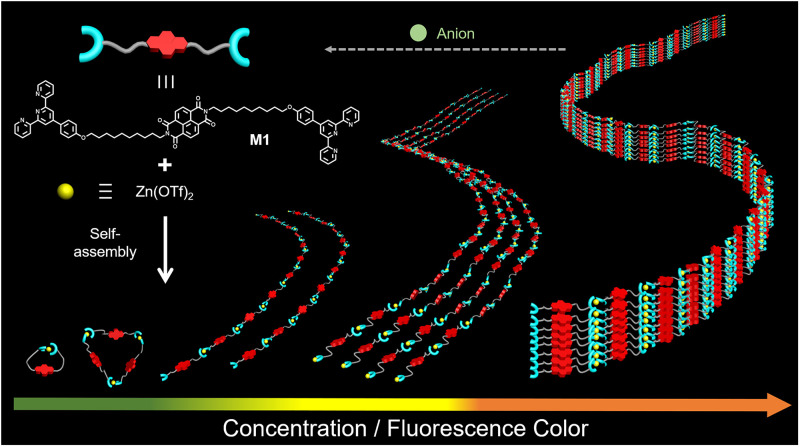
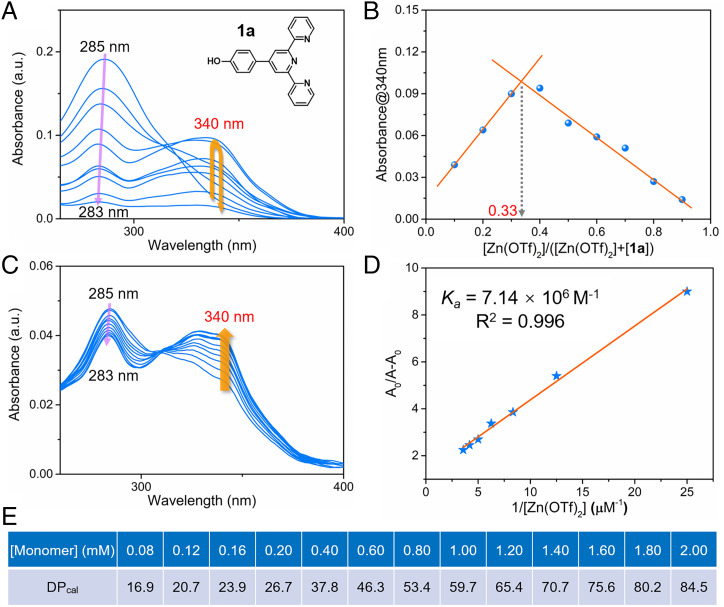
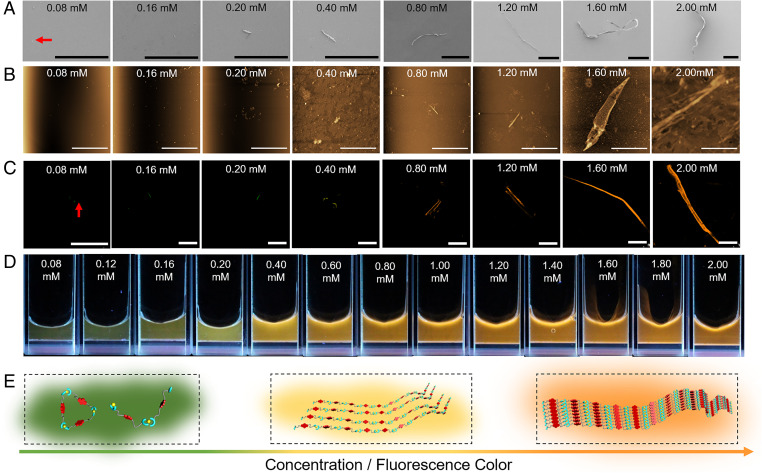
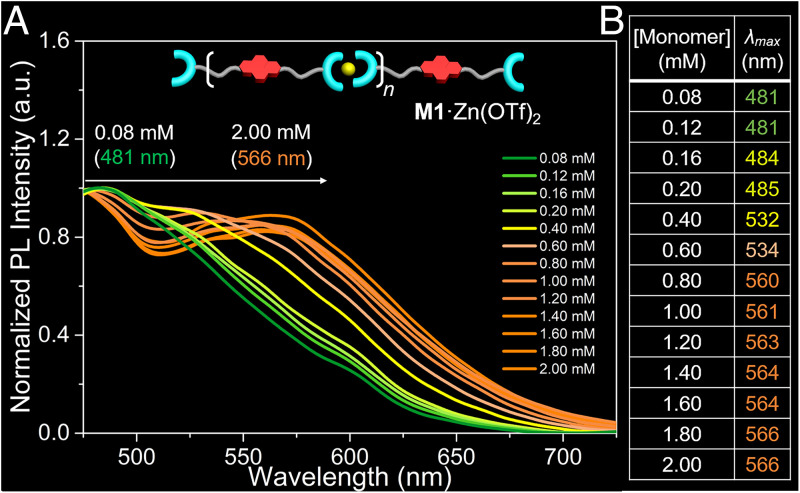
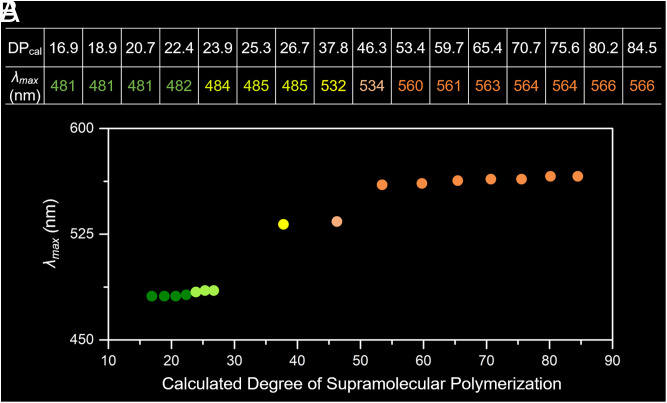
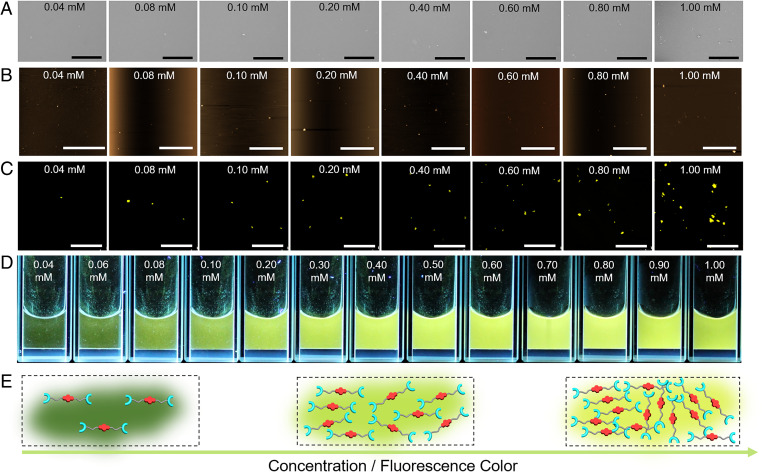
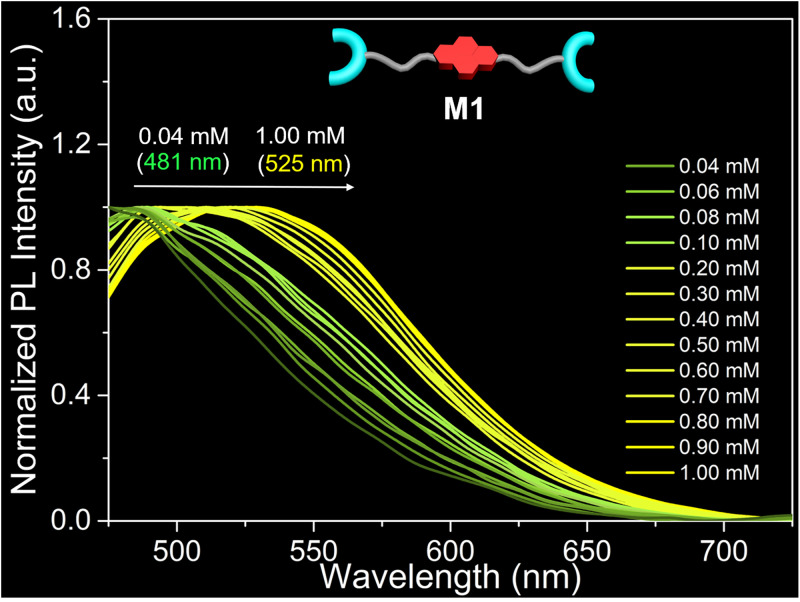
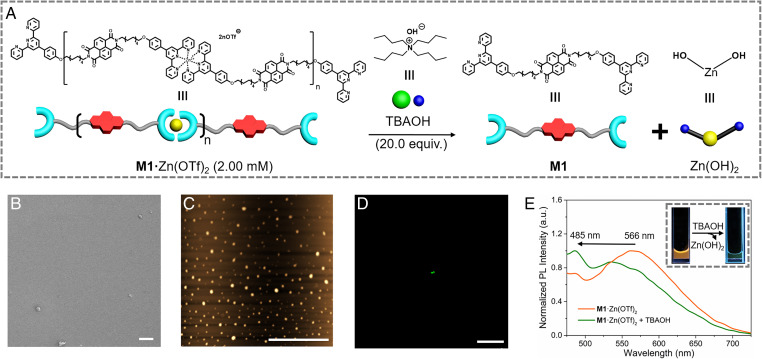
Issues of molecular weight determination have been central to the development of supramolecular polymer chemistry. Whereas relationships between concentration and optical features are established for well-behaved absorptive and emissive species, for most supramolecular polymeric systems no simple correlation exists between optical performance and number-average molecular weight (Mn). As such, the Mn of supramolecular polymers have to be inferred from various measurements. Herein, we report an anion-responsive supramolecular polymer [M1·Zn(OTf)2]n that exhibits monotonic changes in the fluorescence color as a function of Mn Based on theoretical estimates, the calculated average degree of polymerization (DPcal) increases from 16.9 to 84.5 as the monomer concentration increases from 0.08 mM to 2.00 mM. Meanwhile, the fluorescent colors of M1 + Zn(OTf)2 solutions were found to pass from green to yellow and to orange, corresponding to a red shift in the maximum emission band (λmax ). Therefore, a relationship between DPcal and λmax could be established. Additionally, the anion-responsive nature of the present system meant that the extent of supramolecular polymerization could be regulated by introducing anions, with the resulting change in Mn being readily monitored via changes in the fluorescent emission features.
Keywords: J-aggregate; fluorescence; molecular weight; self-assembly; supramolecular polymers.
Copyright © 2022 the Author(s). Published by PNAS.
Conflict of interest statement
The authors declare no competing interest.
Figures
Similar articles
-
Metal-Ligand Interactions and Oligo(p-phenylene vinylene) Derivatives Based Supramolecular Polymer Possessing Variable Fluorescence Colors.Macromol Rapid Commun. 2022 Sep;43(18):e2200242. doi: 10.1002/marc.202200242. Epub 2022 Apr 21. Macromol Rapid Commun. 2022. PMID: 35411978
-
A Strategy Based on Aggregation-Induced Ratiometric Emission to Differentiate Molecular Weight of Supramolecular Polymers.Angew Chem Int Ed Engl. 2022 Jun 13;61(24):e202203505. doi: 10.1002/anie.202203505. Epub 2022 Apr 11. Angew Chem Int Ed Engl. 2022. PMID: 35332640
-
An AB2 -Type Supramolecular Hyperbranched Polymer Based on Pillar[5]arene Host-Guest Recognition: Construction and Its pH-Responsiveness.Macromol Rapid Commun. 2018 Nov;39(21):e1800502. doi: 10.1002/marc.201800502. Epub 2018 Sep 17. Macromol Rapid Commun. 2018. PMID: 30221798
-
Secondary Structure in Nonpeptidic Supramolecular Block Copolymers.Acc Chem Res. 2021 May 18;54(10):2397-2408. doi: 10.1021/acs.accounts.1c00028. Epub 2021 Apr 29. Acc Chem Res. 2021. PMID: 33914498 Review.
-
When polymerization meets coordination-driven self-assembly: metallo-supramolecular polymers based on supramolecular coordination complexes.Chem Soc Rev. 2021 Jul 7;50(13):7395-7417. doi: 10.1039/d0cs00654h. Epub 2021 May 21. Chem Soc Rev. 2021. PMID: 34018496 Review.
Cited by
-
A library of vinyl phosphonate anions dimerize with cyanostars, form supramolecular polymers and undergo statistical sorting.Chem Sci. 2023 Nov 29;15(1):389-398. doi: 10.1039/d3sc03685e. eCollection 2023 Dec 20. Chem Sci. 2023. PMID: 38131081 Free PMC article.
-
Fluorescence-readout as a powerful macromolecular characterisation tool.Chem Sci. 2023 Oct 20;14(45):12815-12849. doi: 10.1039/d3sc04052f. eCollection 2023 Nov 22. Chem Sci. 2023. PMID: 38023522 Free PMC article. Review.
-
Insights into conformational ensembles of compositionally identical disordered peptidomimetics.Polym Chem. 2024 Aug 7;15(29):2970-2980. doi: 10.1039/D4PY00341A. Epub 2024 Jul 4. Polym Chem. 2024. PMID: 39781370 Free PMC article.
-
Navigating the Expansive Landscapes of Soft Materials: A User Guide for High-Throughput Workflows.ACS Polym Au. 2023 Dec 5;3(6):406-427. doi: 10.1021/acspolymersau.3c00025. eCollection 2023 Dec 13. ACS Polym Au. 2023. PMID: 38107416 Free PMC article. Review.
-
Visualizing Chain Growth of Polytelluoxane via Polymerization Induced Emission.Adv Sci (Weinh). 2023 Nov;10(31):e2304518. doi: 10.1002/advs.202304518. Epub 2023 Sep 15. Adv Sci (Weinh). 2023. PMID: 37715281 Free PMC article.
References
-
- Mieras H. J. M. A., Rijn C. F. H. V., Elastic behaviour of low molecular weight polystyrenes. Nature 224, 165–166 (1969).
-
- Charlesby A., Effect of molecular weight on the cross-linking of siloxanes by high-energy radiation. Nature 173, 679–680 (1954).
-
- Patel K., Chikkali S. H., Sivaram S., Ultrahigh molecular weight polyethylene: Catalysis, structure, properties, processing and applications. Prog. Polym. Sci. 109, 101290 (2020).
-
- Deplancke T., Lame O., Rousset F., Seguela R., Vigier G., Mechanisms of chain reentanglement during the sintering of UHMWPE nascent powder: Effect of molecular weight. Macromolecules 48, 5328–5338 (2015).
-
- Kida T., Hiejima Y., Nitta K.-h., Microstructural interpretation of influences of molecular weight on the tensile properties of high-density polyethylene solids using Rheo-Raman spectroscopy. Macromolecules 54, 225–234 (2021).
LinkOut - more resources
Full Text Sources
Research Materials
