. 2023 Jan;72(1):129-140.
doi: 10.1136/gutjnl-2021-325918. Epub 2022 Feb 23.

Inflamed and non-inflamed classes of HCC: a revised immunogenomic classification

Affiliations

Inflamed and non-inflamed classes of HCC: a revised immunogenomic classification

Carla Montironi et al. Gut. 2023 Jan.

Abstract

Objective: We previously reported a characterisation of the hepatocellular carcinoma (HCC) immune contexture and described an immune-specific class. We now aim to further delineate the immunogenomic classification of HCC to incorporate features that explain responses/resistance to immunotherapy.

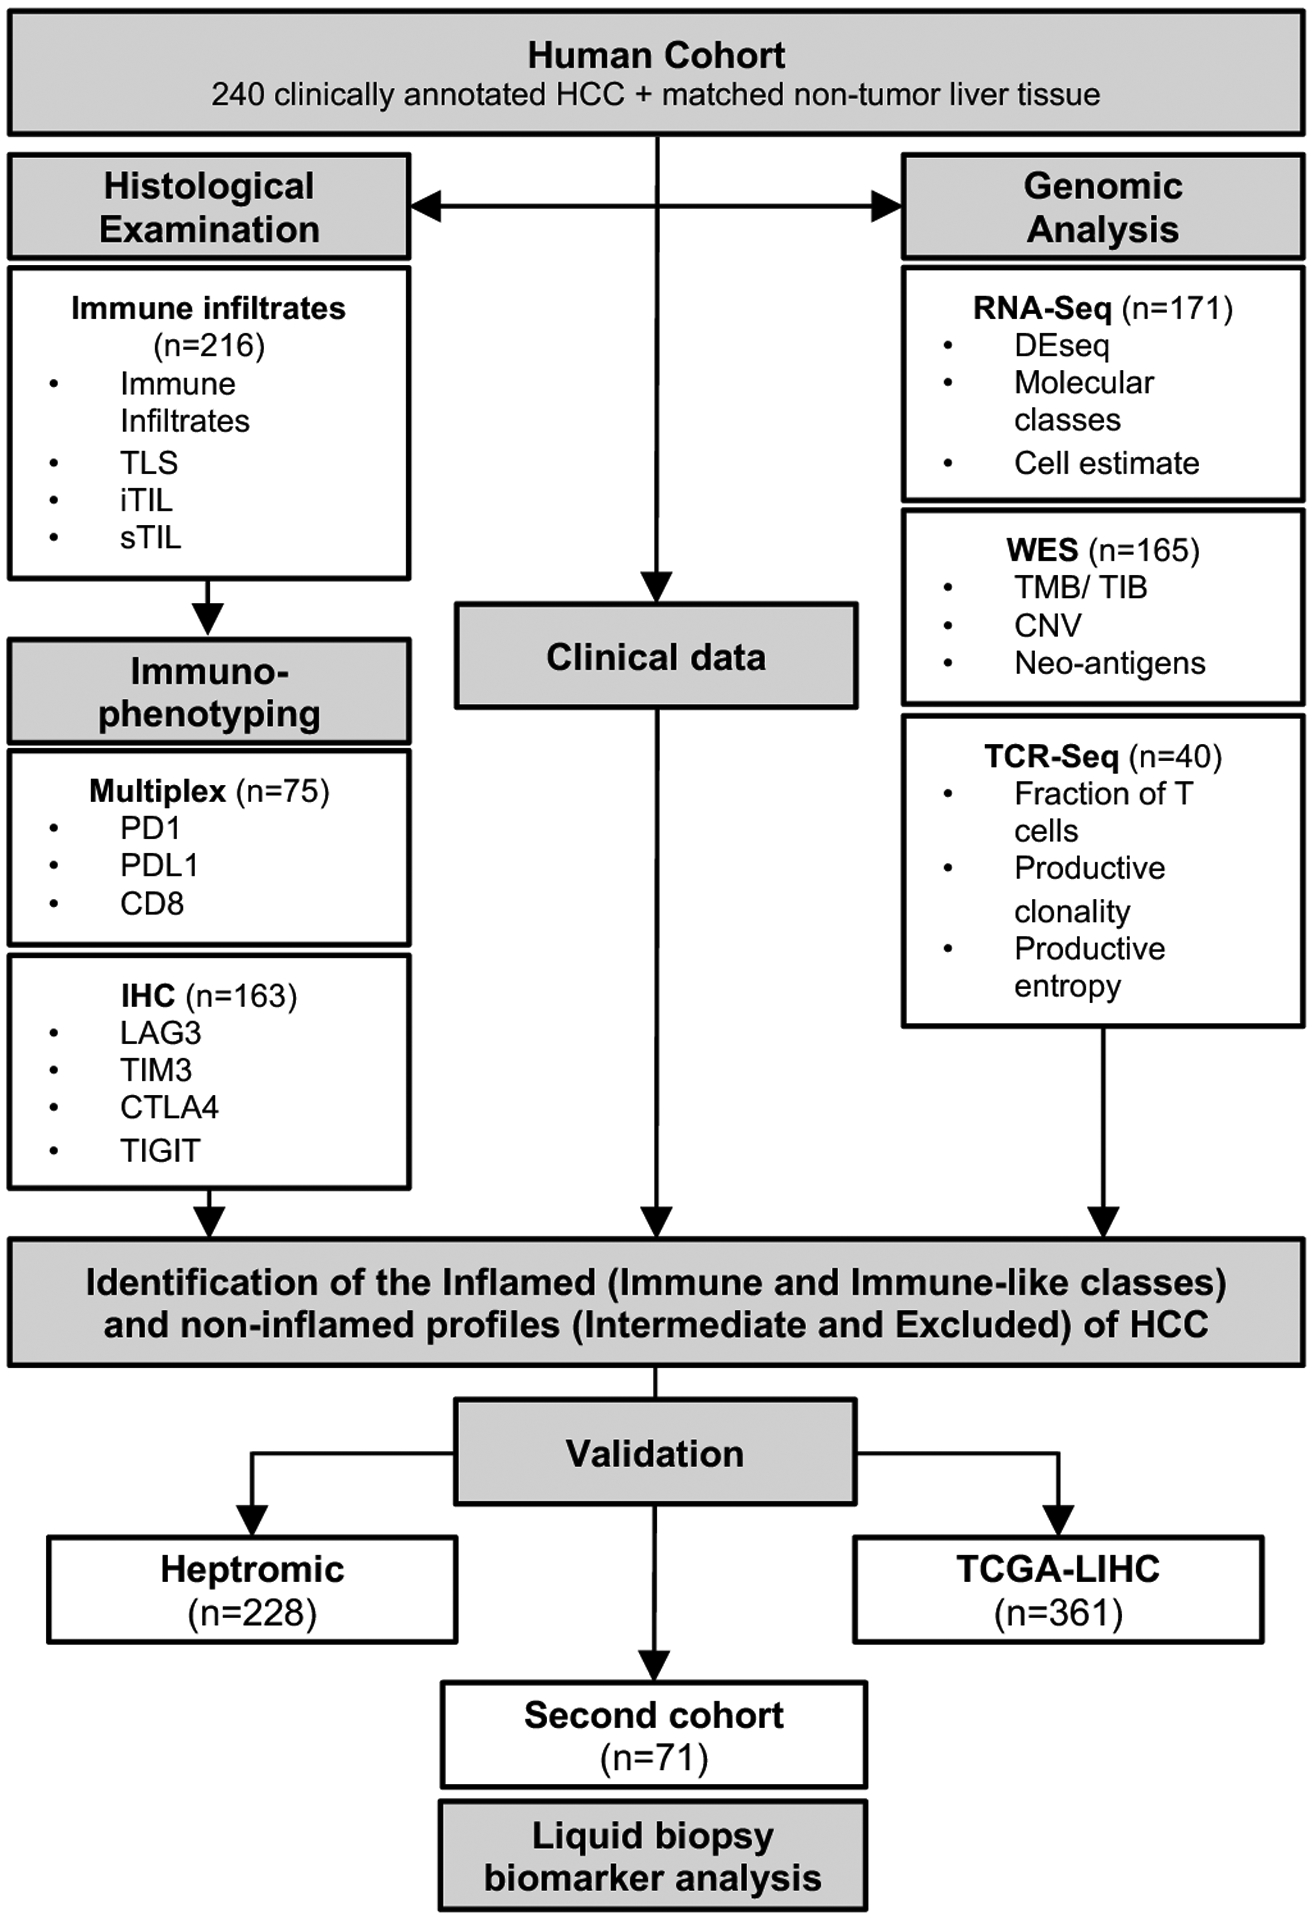
Design: We performed RNA and whole-exome sequencing, T-cell receptor (TCR)-sequencing, multiplex immunofluorescence and immunohistochemistry in a novel cohort of 240 HCC patients and validated our results in other cohorts comprising 660 patients.

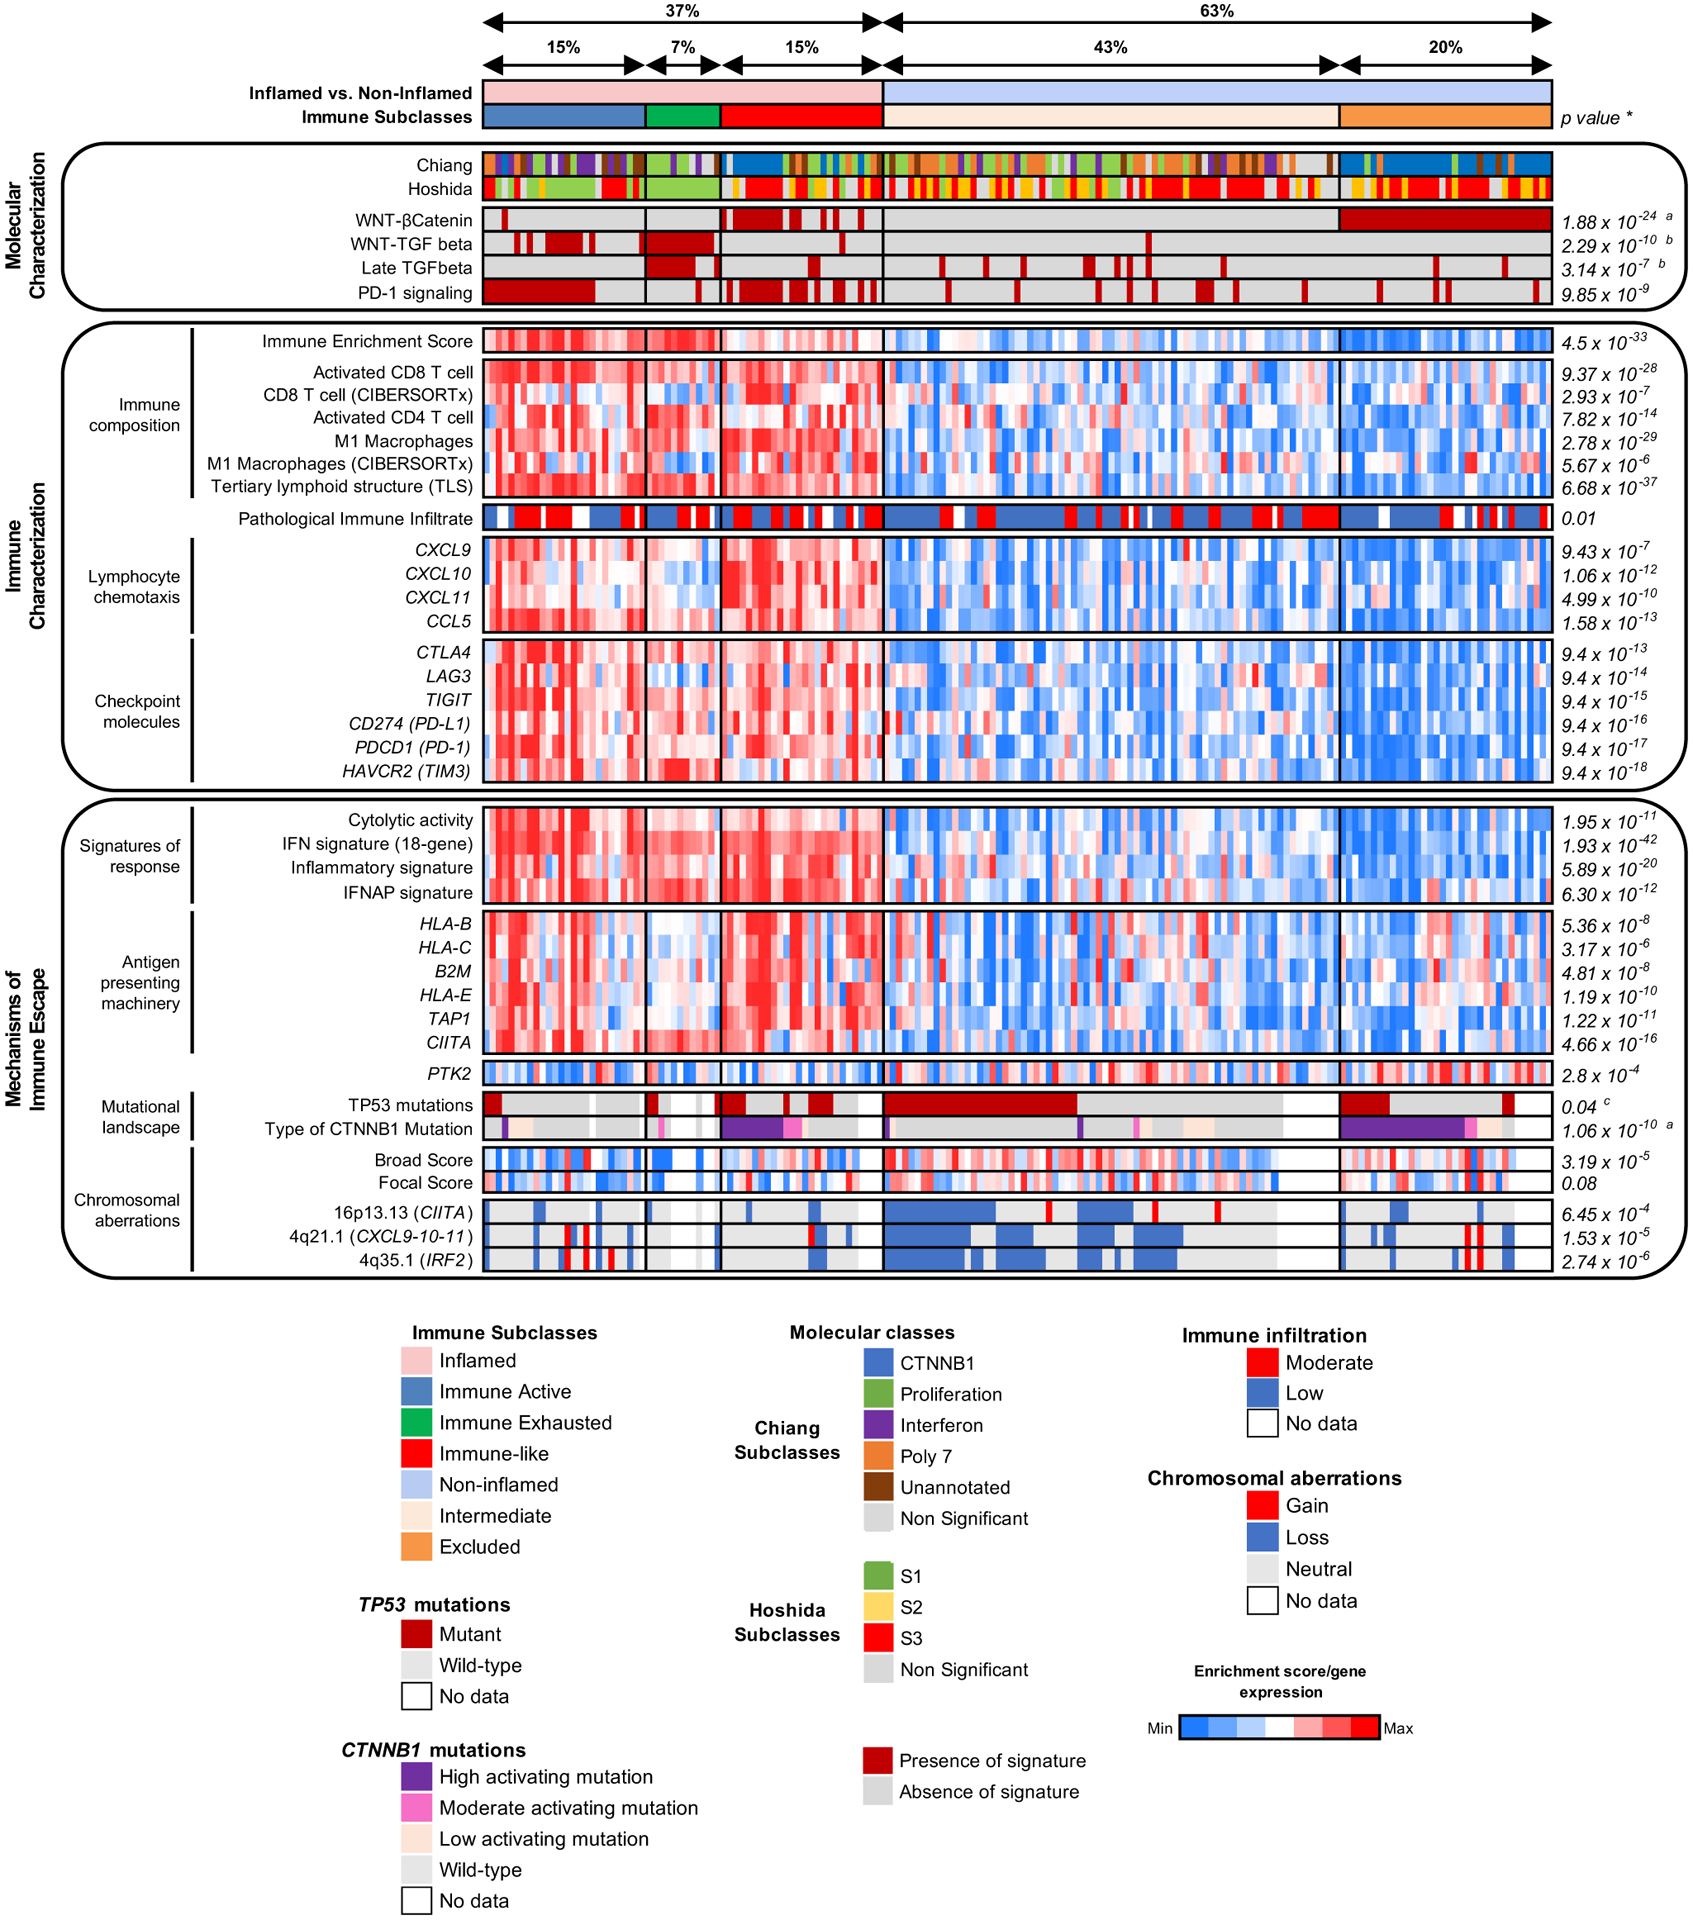
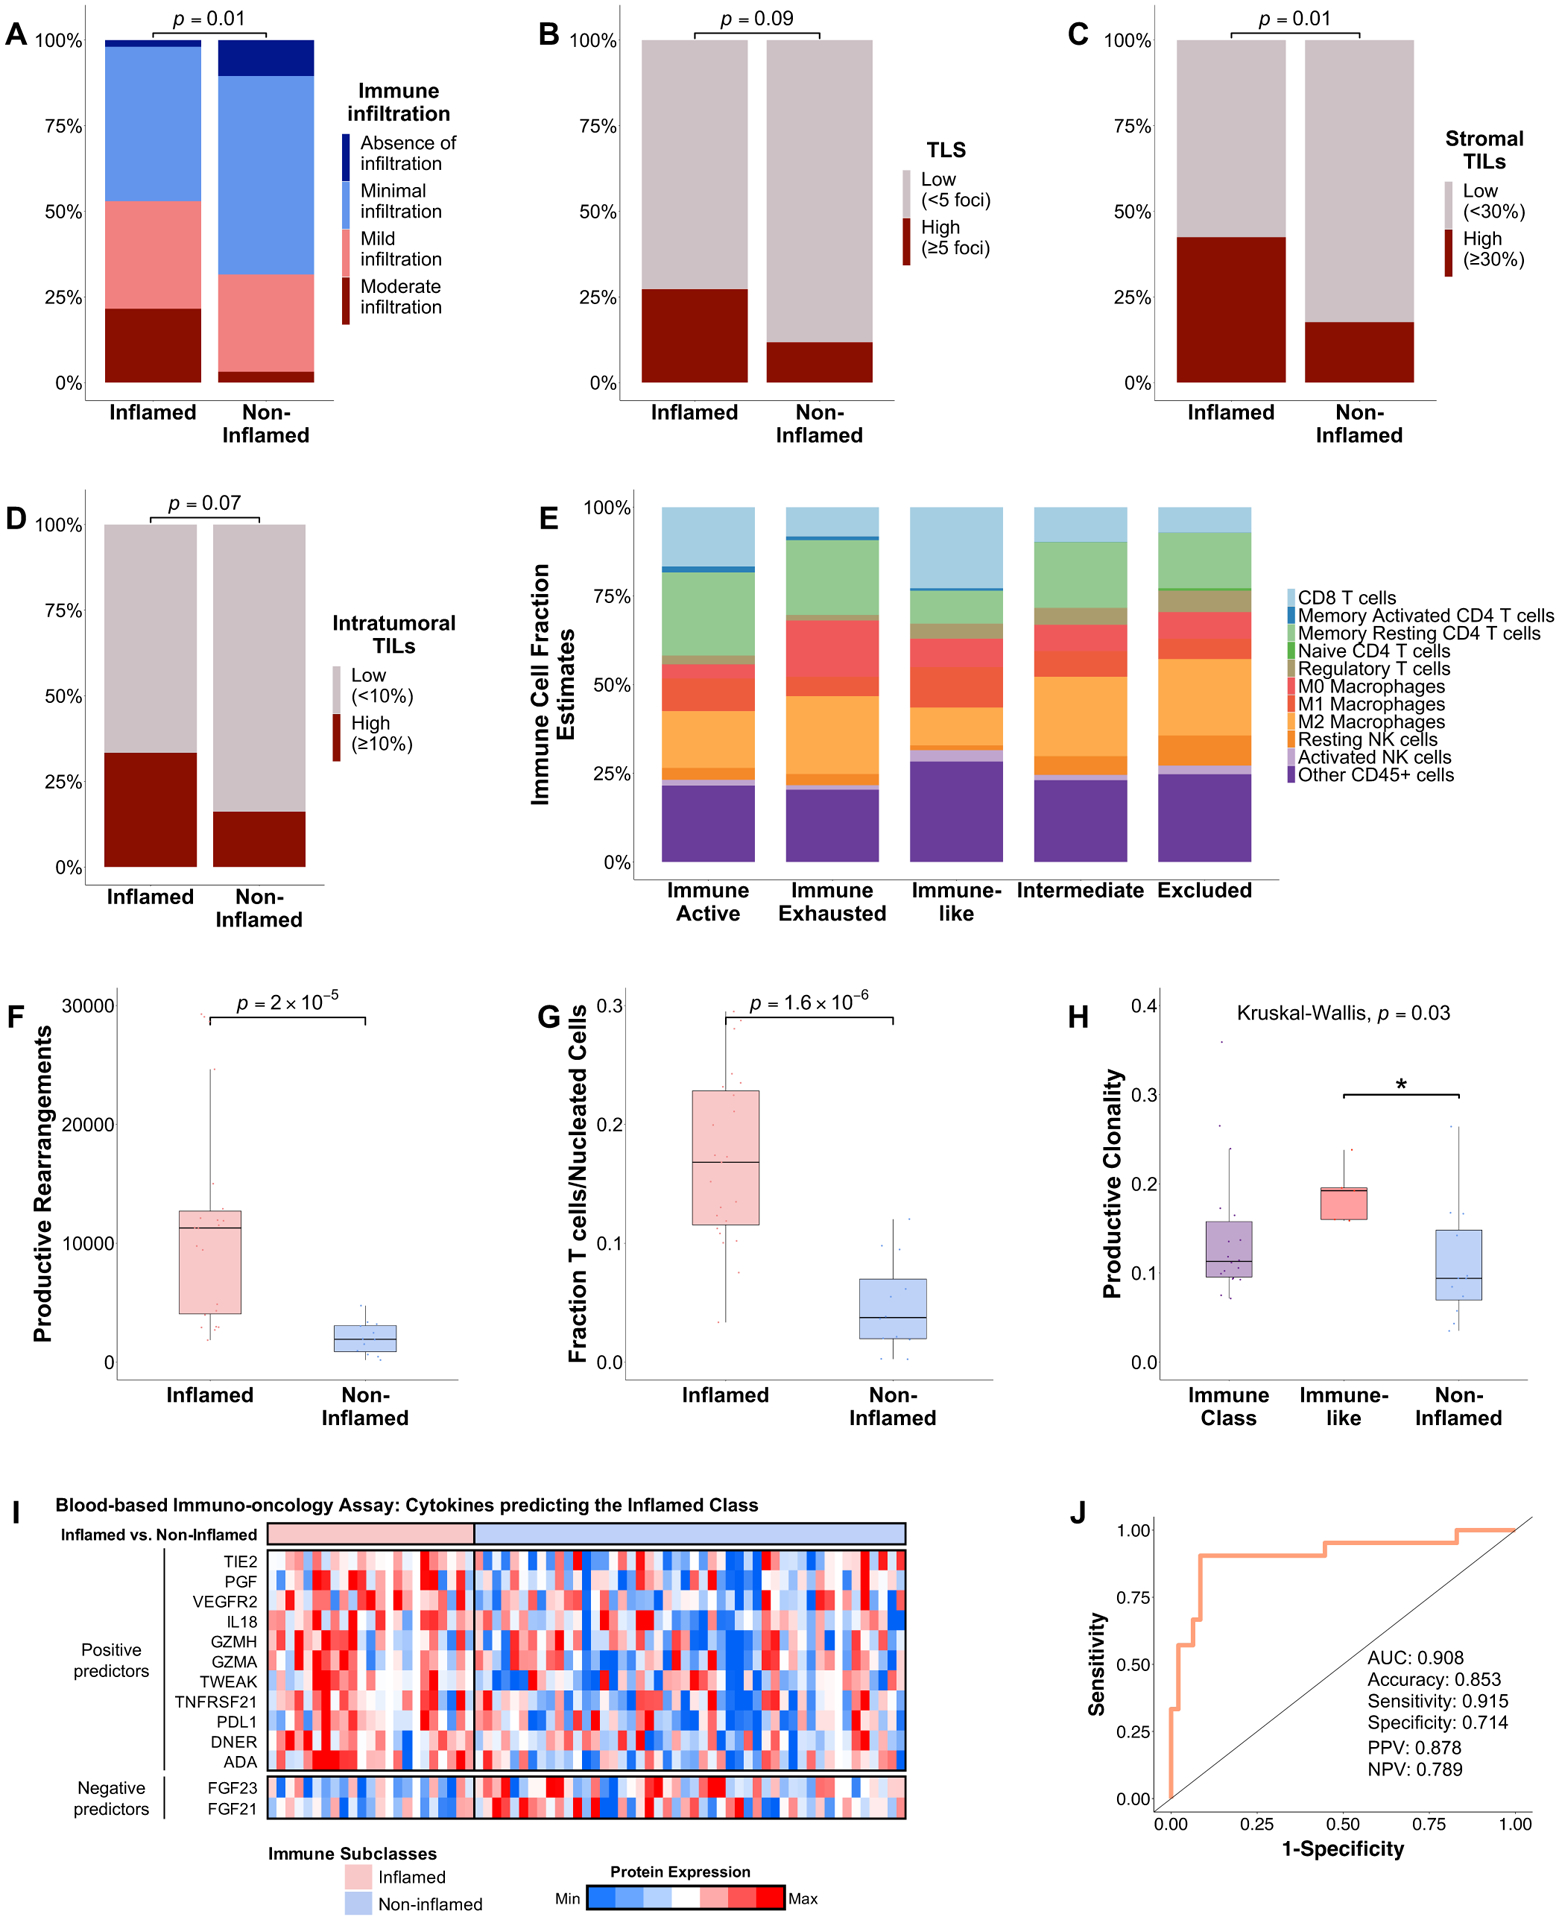
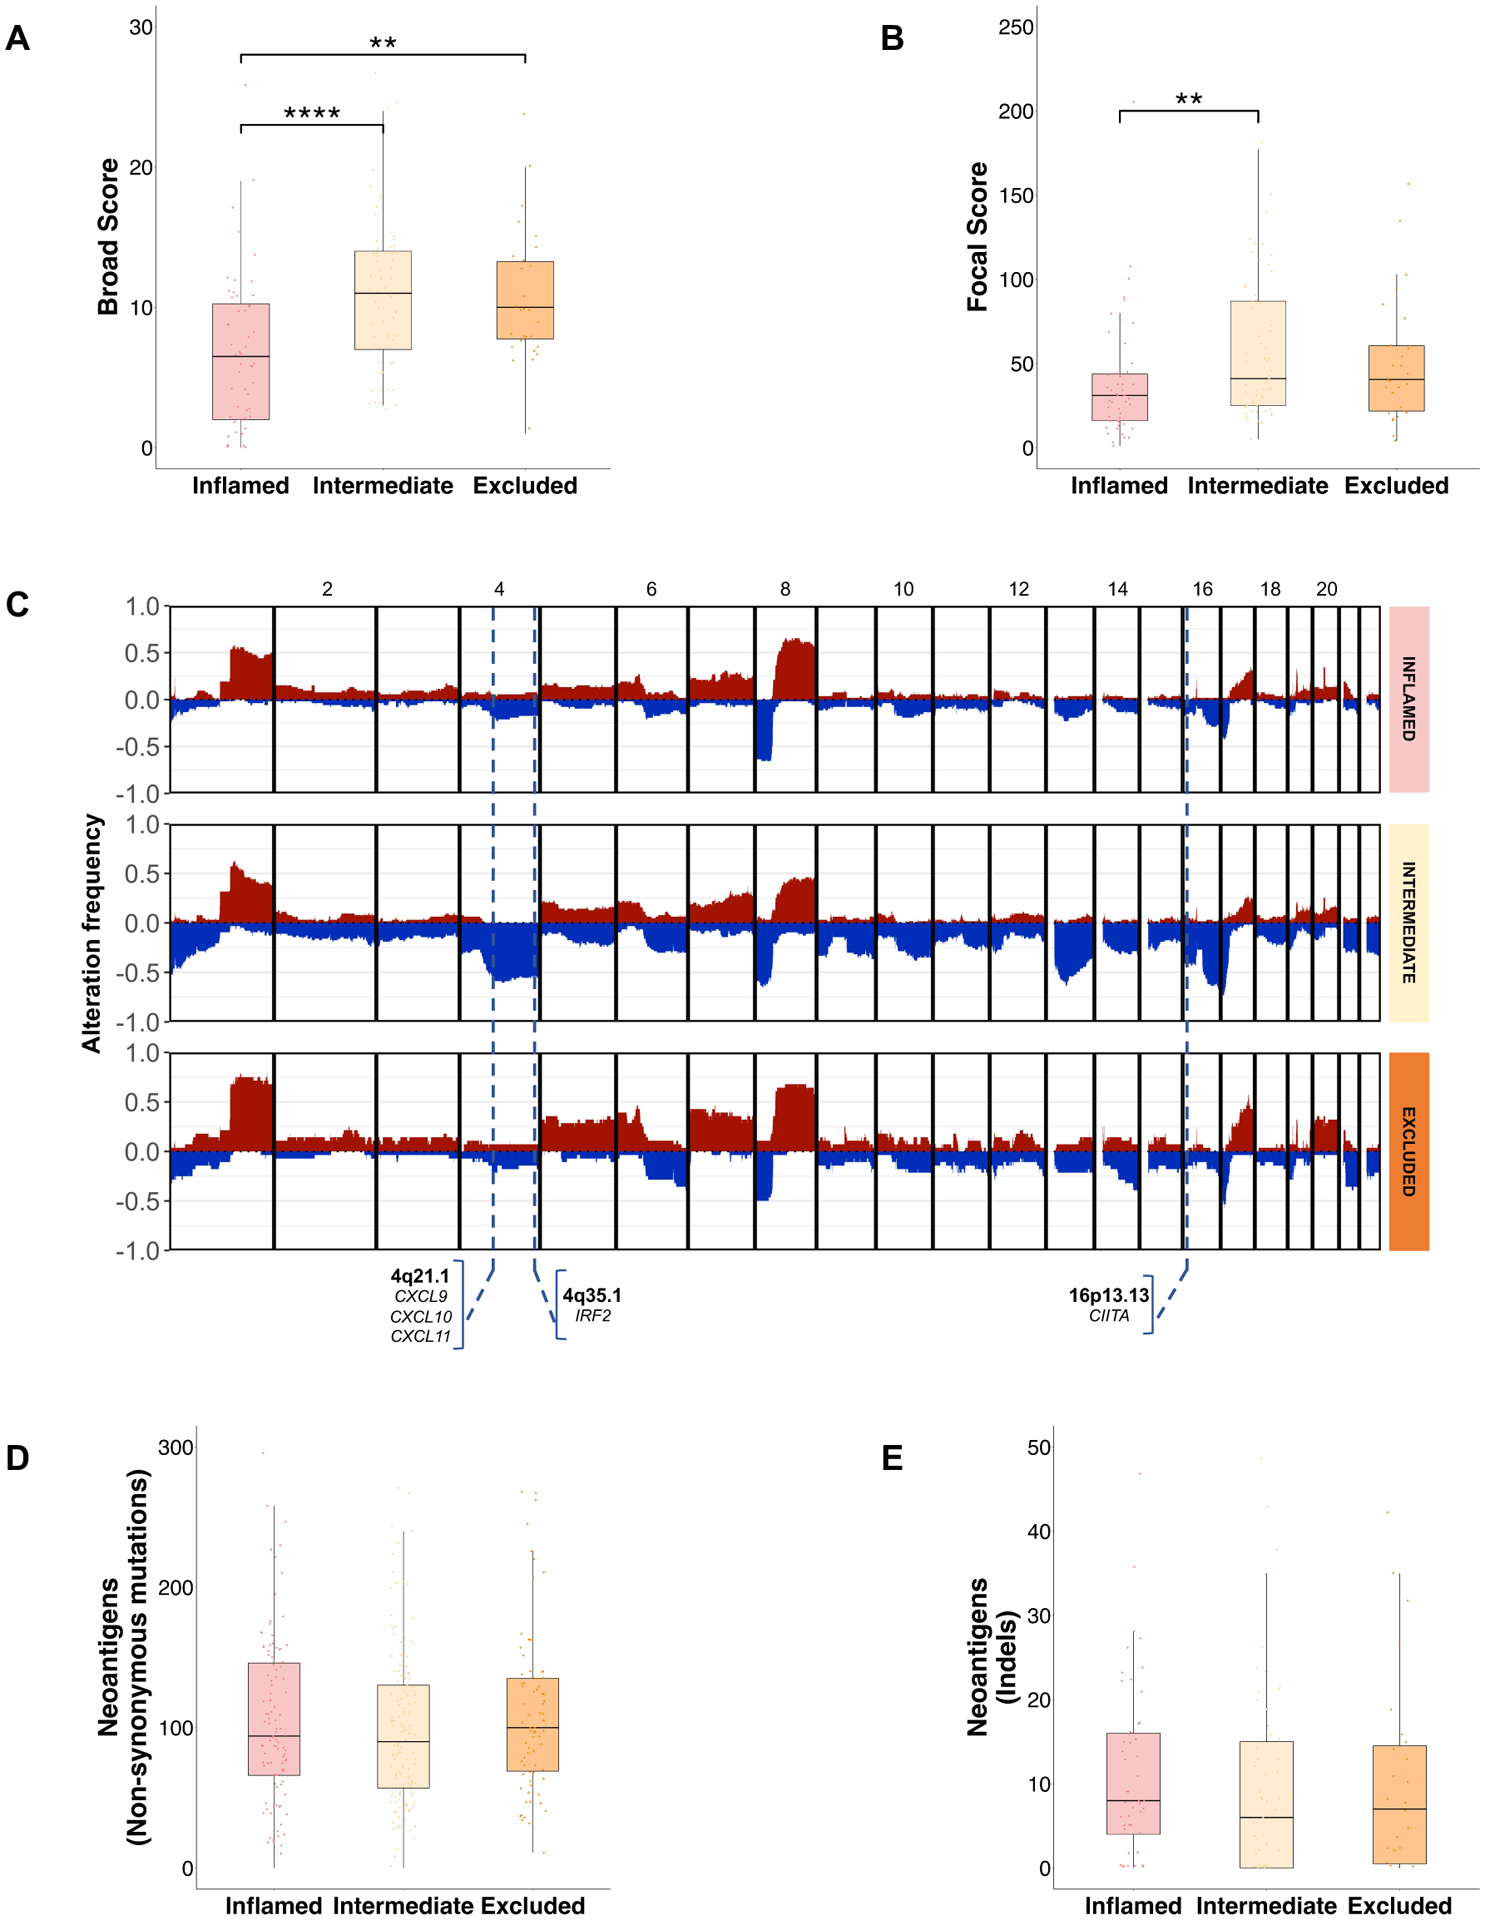
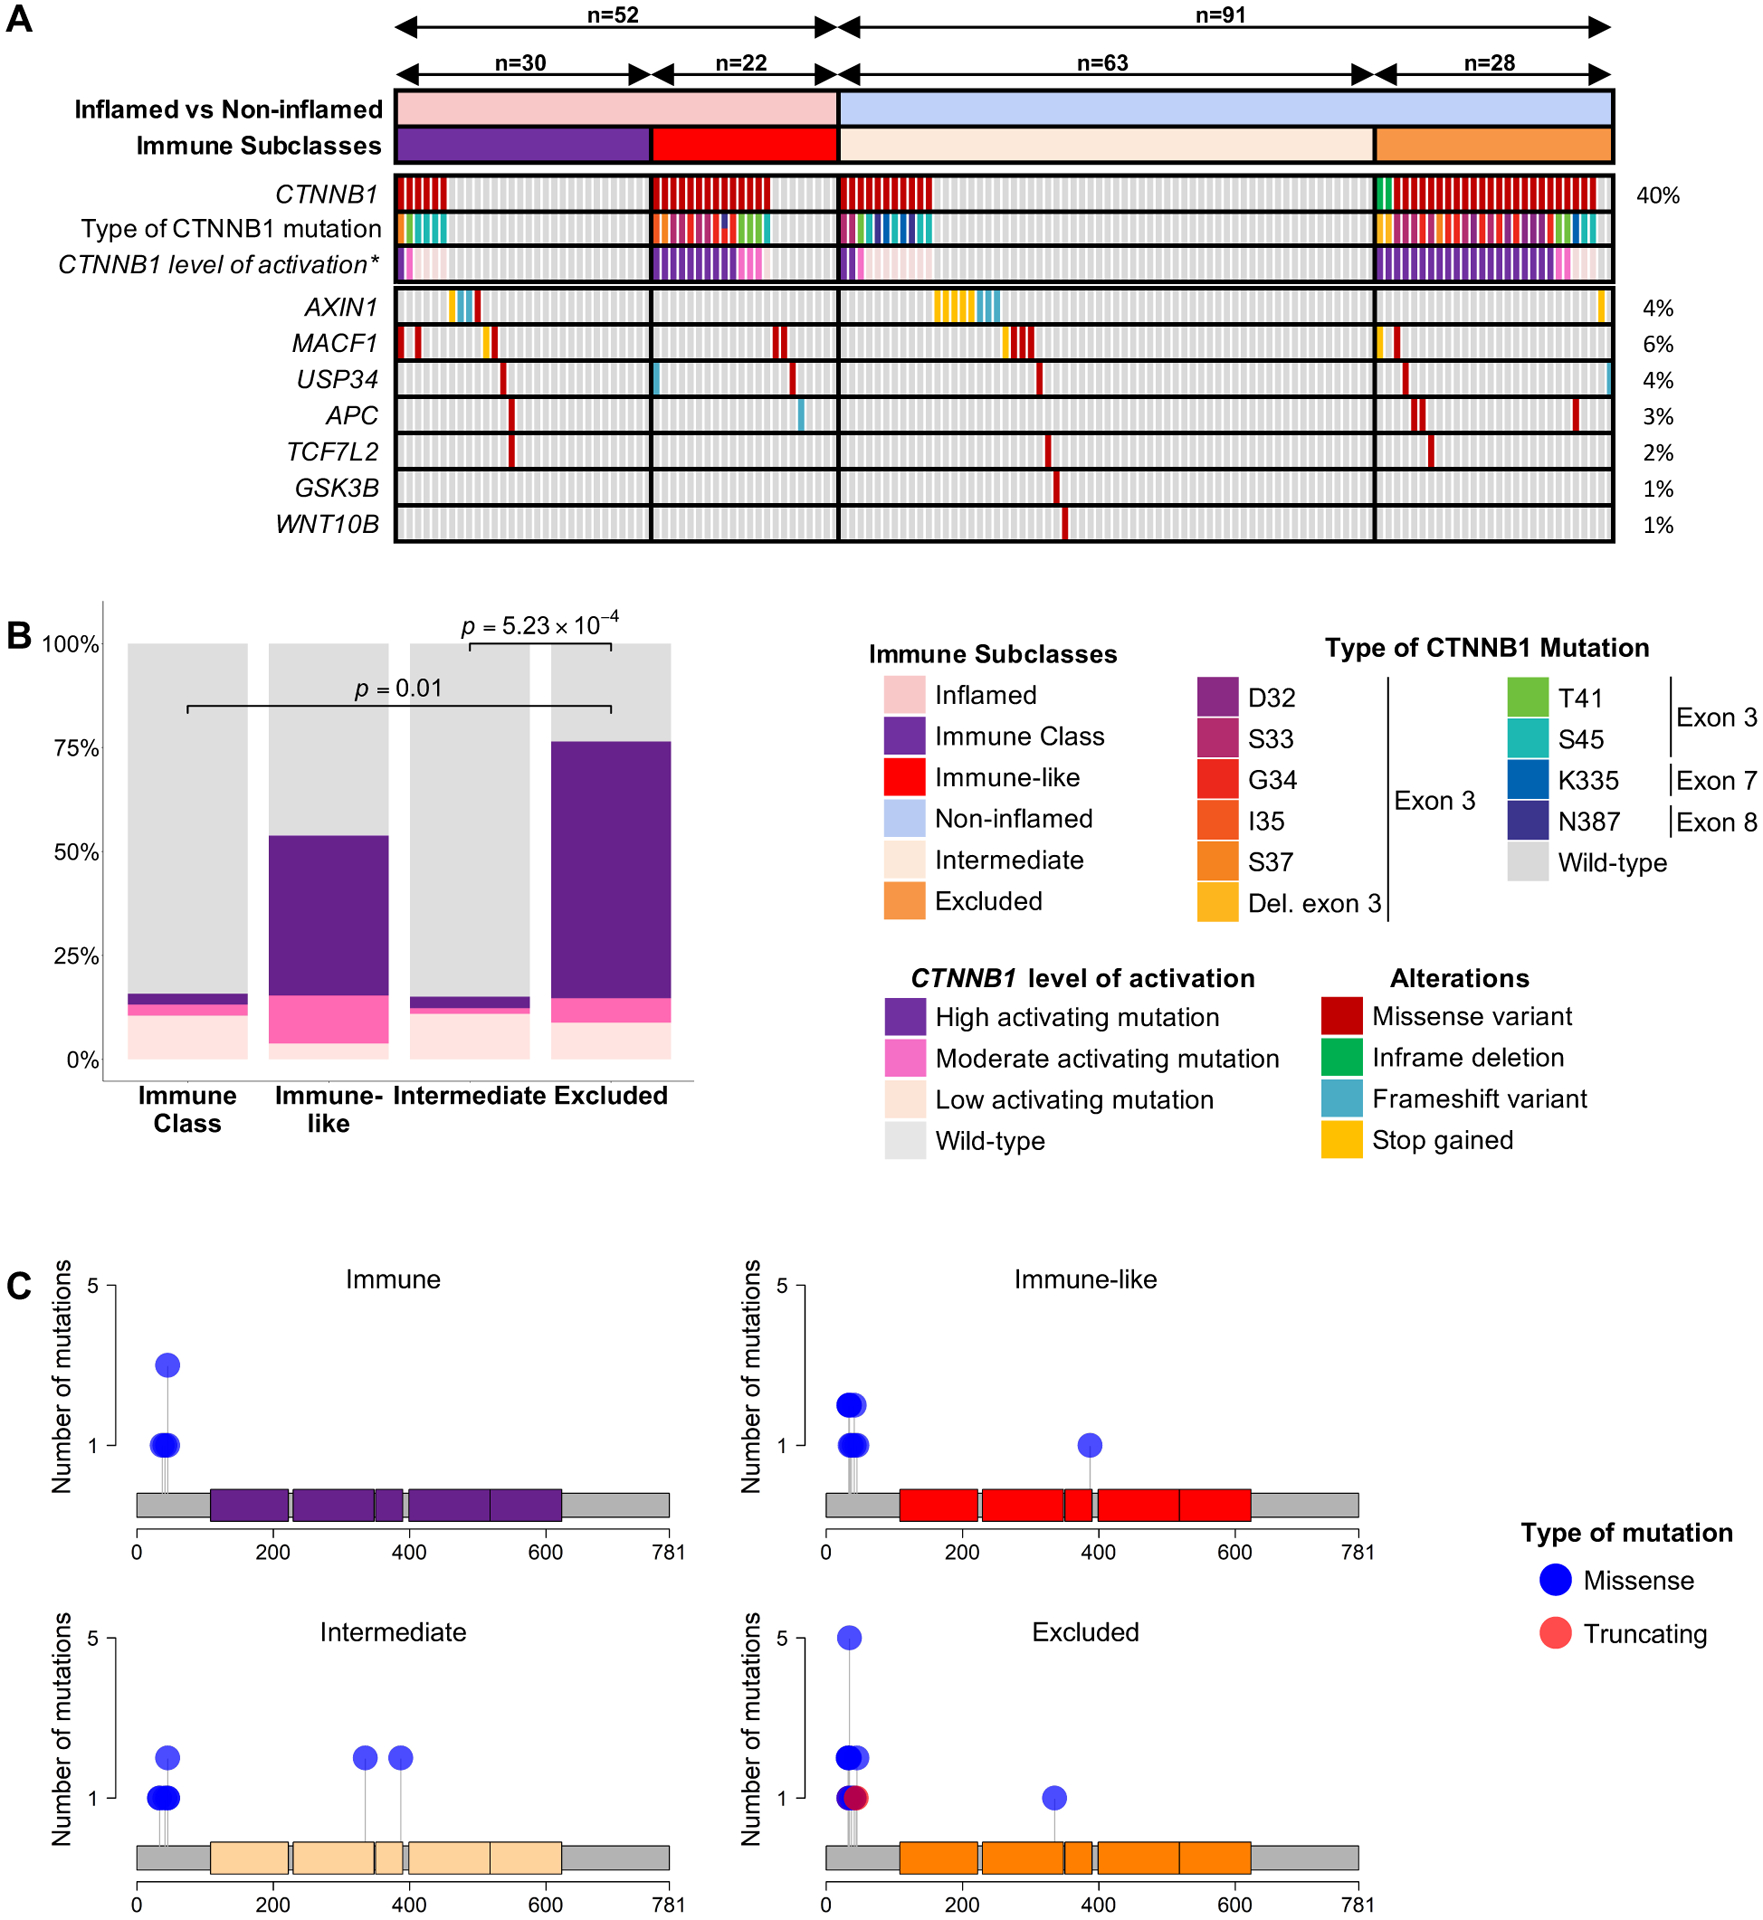
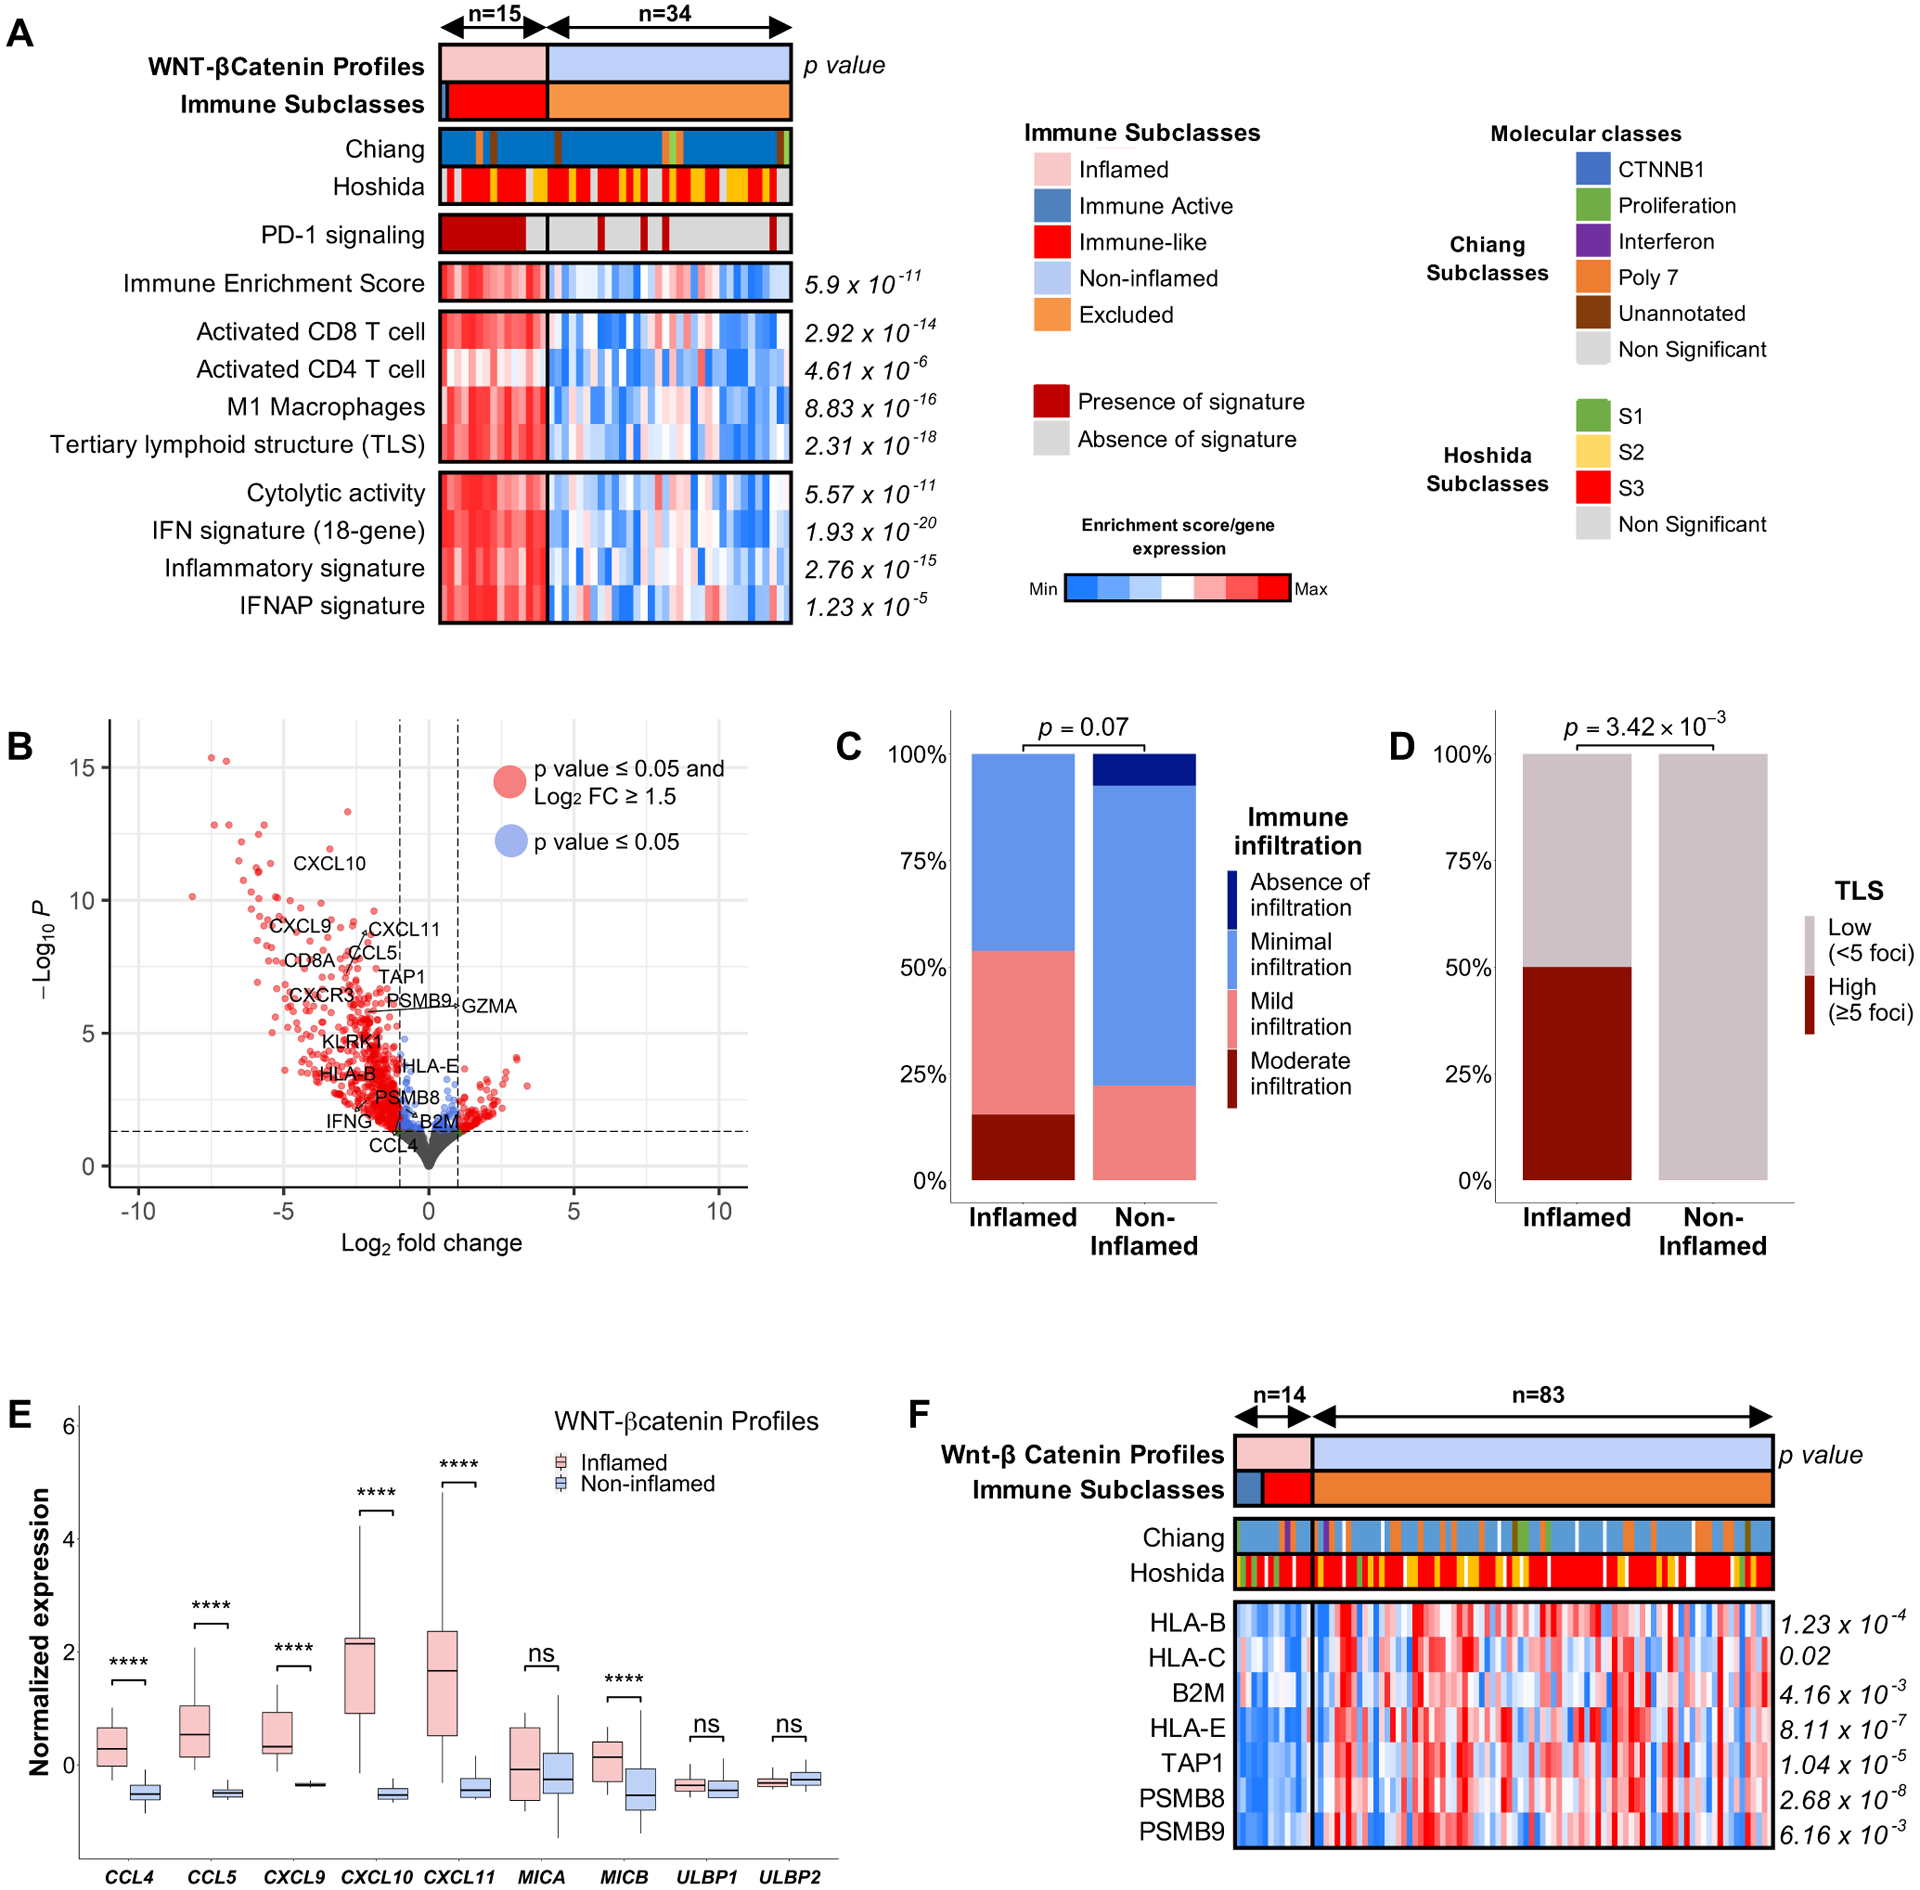
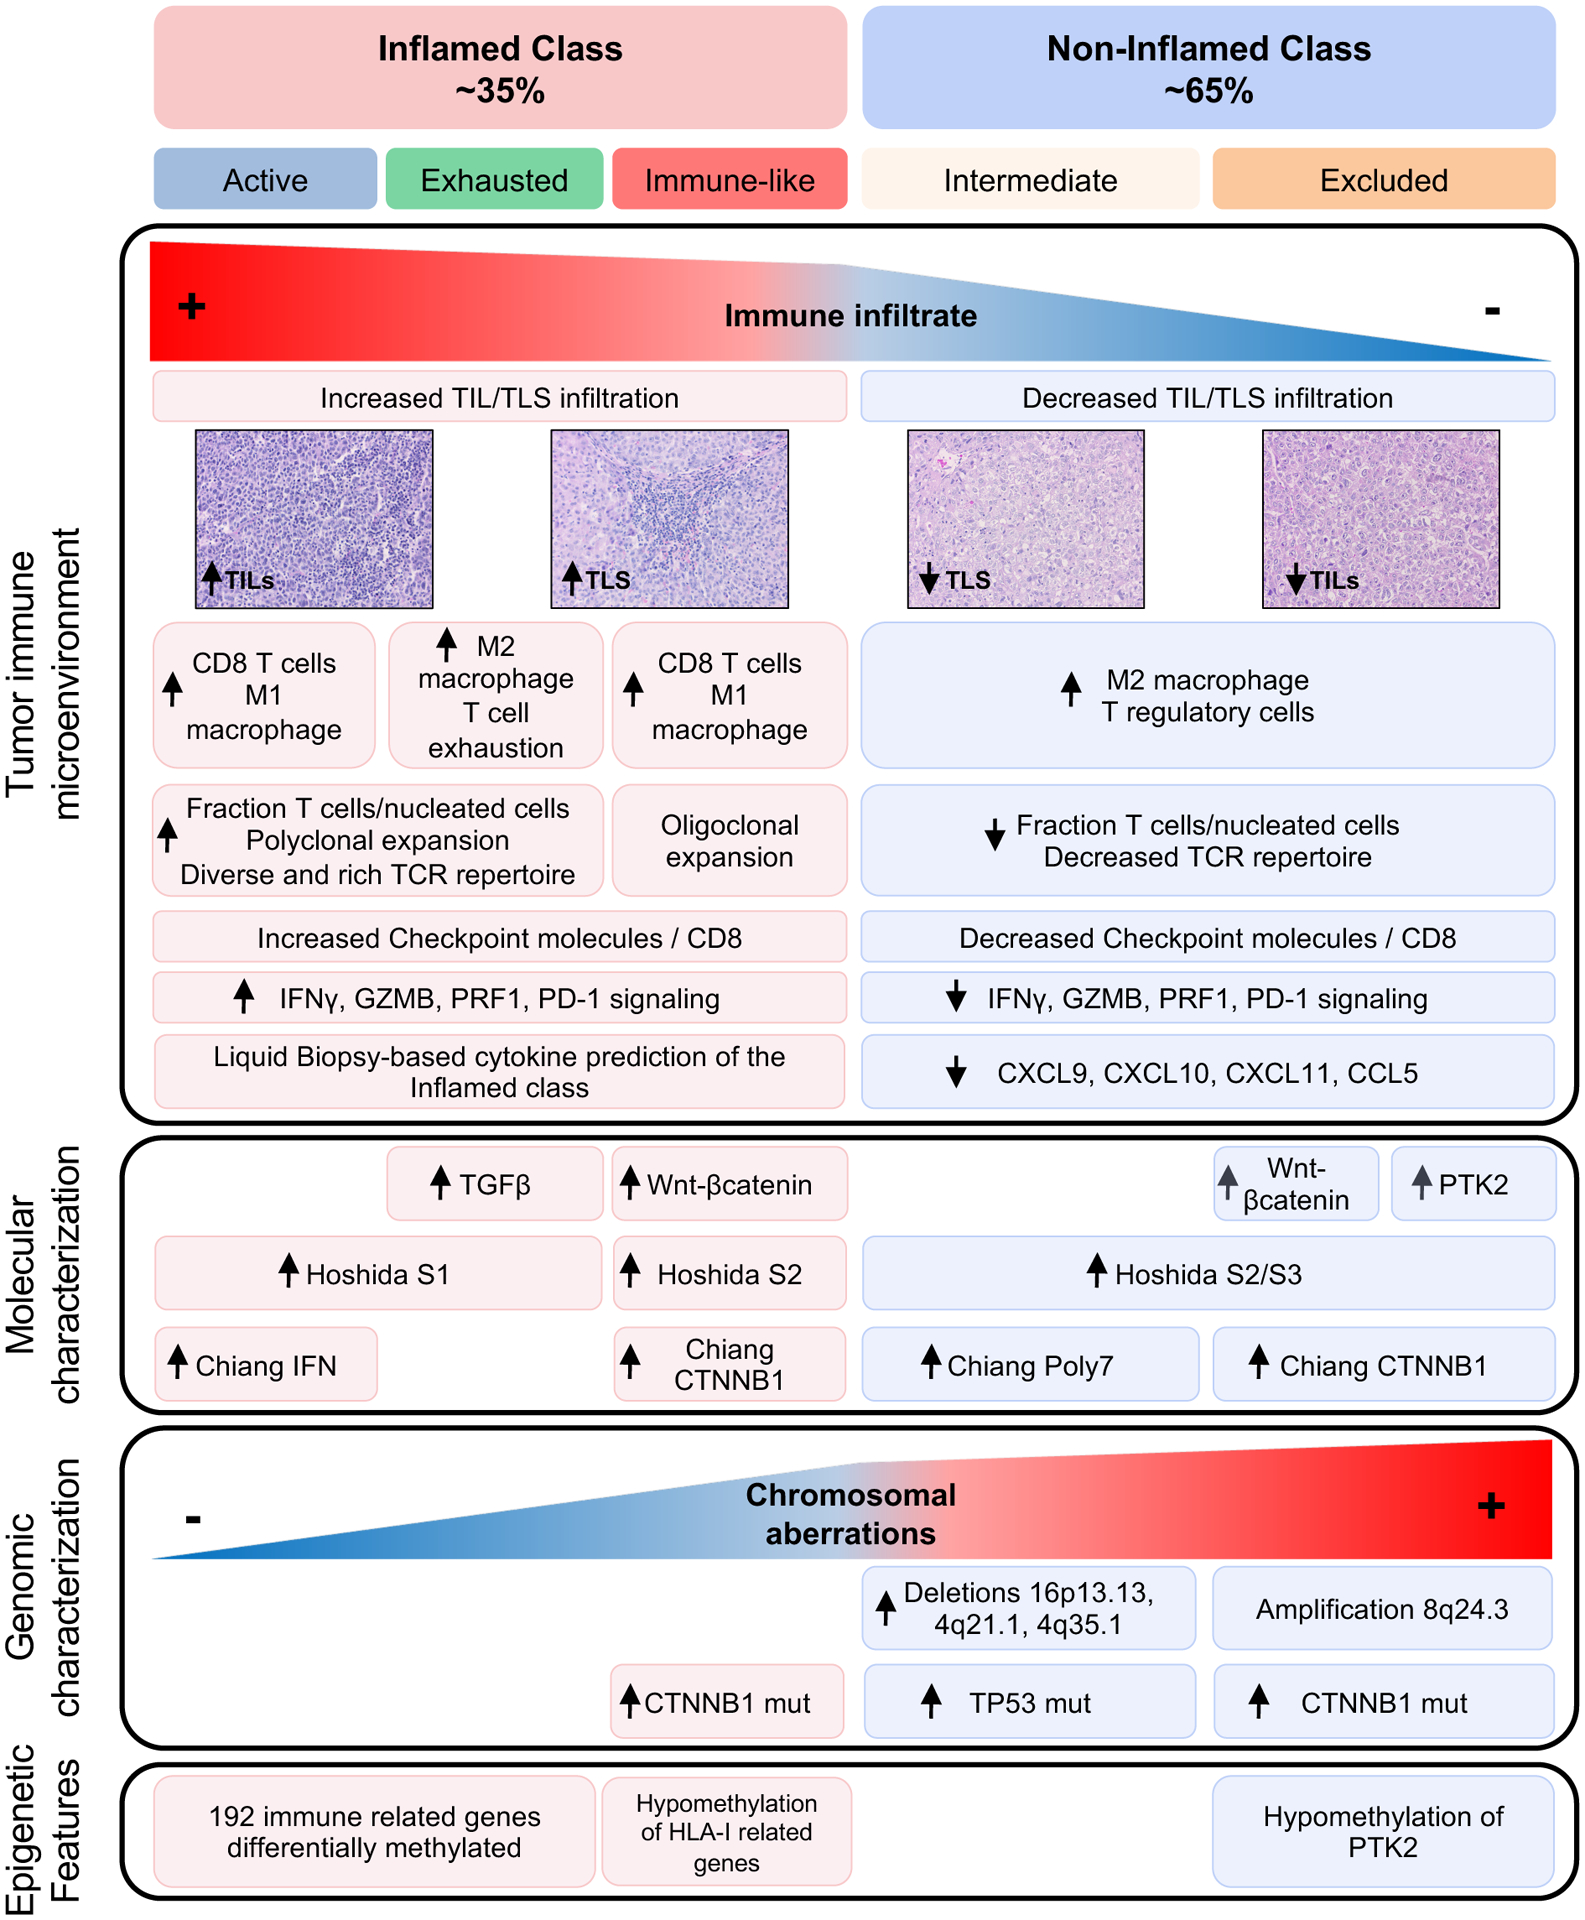
Results: Our integrative analysis led to define: (1) the inflamed class of HCC (37%), which includes the previously reported immune subclass (22%) and a new immune-like subclass (15%) with high interferon signalling, cytolytic activity, expression of immune-effector cytokines and a more diverse T-cell repertoire. A 20-gene signature was able to capture ~90% of these tumours and is associated with response to immunotherapy. Proteins identified in liquid biopsies recapitulated the inflamed class with an area under the ROC curve (AUC) of 0.91; (2) The intermediate class, enriched in TP53 mutations (49% vs 29%, p=0.035), and chromosomal losses involving immune-related genes and; (3) the excluded class, enriched in CTNNB1 mutations (93% vs 27%, p<0.001) and PTK2 overexpression due to gene amplification and promoter hypomethylation. CTNNB1 mutations outside the excluded class led to weak activation of the Wnt-βcatenin pathway or occurred in HCCs dominated by high interferon signalling and type I antigen presenting genes.

Conclusion: We have characterised the immunogenomic contexture of HCC and defined inflamed and non-inflamed tumours. Two distinct CTNNB1 patterns associated with a differential role in immune evasion are described. These features may help predict immune response in HCC.

Keywords: hepatocellular carcinoma; immune response; immunotherapy; liver immunology; molecular oncology.


Conflict of interest statement

Competing interests: JA and JN are staff scientists from Bristol-Myers Squibb. JML is receiving research support from Bayer HealthCare Pharmaceuticals, Eisai Inc, Bristol-Myers Squibb, Boehringer-Ingelheim and Ipsen, and consulting fees from Eli Lilly, Bayer HealthCare Pharmaceuticals, Bristol-Myers Squibb, Eisai Inc, Celsion Corporation, Exelixis, Merck, Ipsen, Genentech, Roche, Glycotest, Nucleix, Sirtex, Mina Alpha Ltd and AstraZeneca. The remaining coauthors have nothing to disclose related to this manuscript.

Figures

Figure 1:
Figure 1:. Flow chart of the study.
A total of 240 clinically annotated HCC and matched non-tumour tissue samples were used in this study as the discovery cohort. findings were then validated in two additional datasets comprising 589 additional patients and a new cohort of 71 patients with baseline tissue and blood samples. CD8, cluster of differentiation 8; CTLA4, cytotoxic T-lymphocyte associated protein 4; HCC, hepatocellular carcinoma; iTIL, intratumoural TILs; sTIL, stromal tumour infiltrating lymphocytes; IHC, immunohistochemistry; LAG3, lymphocyte-activation gene 3; PD1, programmed cell death protein 1; PDL1, programmed death-ligand 1; TCGA-LIHC, The Cancer Genome Atlas Liver Hepatocellular Carcinoma; TIGIT, T cell immunoreceptor with Ig and ITIM domains; TIM3, T-cell immunoglobulin domain and mucin domain 3; TMB, tumour mutational burden.
Figure 2:
Figure 2:. Heatmap representation of the main molecular and immune features of the distinct immune-related profiles.
*P-values shown are calculated by Student’s T test for continuous variables or Fisher’s exact test for categorical variables. Unless otherwise indicated, it represents differences between the inflamed and non-inflamed classes; aCompares Excluded vs rest of the cohort. bCompares Exhausted vs rest of the cohort; cCompares Intermediate vs rest of the cohort.
Figure 3:
Figure 3:. The Inflamed class shows high immune infiltration and features of inflammation.
(A–D) Barplot depicting (A) the richness of the immune infiltrate, (B) density of TLS, (C) the stromal TILs and (D) the intratumoural TILs as assessed by H&E examination. (E) Stacked barplot depicting the fraction of 22 immune cell types inferred by CIBERSORTx. (F–H) TCR sequencing results showing (F) the number of productive rearrangements, (G) fraction of T cells and the (H) productive clonality. (I) Heatmap representation of 11 cytokines which positively predict the inflamed class and two cytokines which were enriched in the non-inflamed class. (J) AUC showing the performance of the devised 13-protein signature in capturing the Inflamed class. P value are calculated by (A–D) Fisher’s exact test, (F–G) Wilcoxon’s rank-sum test and (H) Kruskal-Wallis test with post hoc Dunn’s test. *P < 0.05; **p < 0.01; ***p < 0.001; ****p < 0.0001. AUC, area under the ROC curve; NPV, negative predictive value; PPV, positive predictive value; TILs, tumour infiltrating lymphocytes; TLS, tertiary lymphoid structures.
Figure 4:
Figure 4:. Genomic overview of the distinct Immune classes of HCC.
(A, B) Boxplot depicting the distribution of (A) broad and (B) focal chromosomal aberration as assessed by the CNApp algorithm. Kruskal-Wallis, p=9.5×10⁻⁵ and Kruskal-Wallis, p=0.02, respectively. (C) Genomic overview showing the percentage of samples with copy number events among each immune class. Blue represent deletions, red represent gains, the Y axis depicts the percentage of these events across each immune class. Potentially Impactful subcytobands in immune evasion are indicated with a dotted line. (D) Boxplot showing the distribution of inferred neoantigens and (E) neoantigens from insertions and deletions. Kruskal-Wallis, p=0.87 and Kruskal- Wallis, p=0.3, respectively. For (A, B, D, E), p values are calculated by Kruskal-Wallis test with post hoc Dunn’s test. *P < 0.05; **p < 0.01; ***p < 0.001; ****p < 0.0001. HCC, hepatocellular carcinoma.
Figure 5:
Figure 5:. Mutational landscape of CTNNB1 mutations across the Immune class.
(A) Heatmap representation of the distribution of mutations of key genes involved in the Wnt-βcatenin pathway. (B) Stacked barplot showing the distribution of the type of CTNNB1 mutations across immune classes. (C) Lollipop plots showing the distribution of CTNNB1 mutations in the distinct immune classes. P values are calculated by (B) Student’s t-test and (C) Fisher’s exact test. *CTNNB1 level of activation is based on Rebouissou S, Franconi A, Calderaro J, et al.[34]
Figure 6:
Figure 6:. Two distinct profiles of Wnt-βcatenin activated tumours are identified based on immune features.
(A) Heatmap representation of the main immune features of the distinct profiles. (B) Volcano plot showing the differentially expressed genes between inflamed and non-inflamed profiles. (C, D) Barplot representation of (C) the richness of the immune infiltrate and (D) TLS density as assessed by H&E examination. (E) Boxplot comparing the expression of cytokines and ligands repressed by Wnt-βcatenin pathway. (F) Heatmap comparing the methylation of genes involved in antigen type I presentation in the TCGA cohort. P values are calculated by (A, F) Student’s t-test, (C, D) Fisher’s exact test and (E) Wilcoxon rank-sum test. *P < 0.05; **p < 0.01; ***p < 0.001; ****p < 0.0001. ns, not significant. TCGA, The Cancer Genome Atlas Liver Hepatocellular Carcinoma; TLS, tertiary lymphoid structures.
Figure 7:
Figure 7:. Graphic representation of the distinct Immune profiles of HCC.
The figure summarizes the main molecular and histopathological features according to current findings and data previously published[3,8]. HCC, hepatocellular carcinoma; TIL, tumor infiltrating lymphocyte.

Comment in

References

    1. Llovet JM, Kelley RK, Villanueva A, et al. Hepatocellular carcinoma. Nature Reviews Disease Primers 2021;7:7. doi:10.1038/s41572-021-00245-6 - DOI - PubMed
    1. Villanueva A Hepatocellular Carcinoma. New England Journal of Medicine 2019;380:1450–62. doi:10.1056/NEJMra1713263 - DOI - PubMed
    1. Llovet JMM, Castet F, Heikenwalder M, et al. Immunotherapies for hepatocellular carcinoma. Nature reviews Clinical oncology 2021;:Online ahead of print. doi:10.1038/S41571-021-00573-2 - DOI - PubMed
    1. Finn RS, Qin S, Ikeda M, et al. Atezolizumab plus Bevacizumab in Unresectable Hepatocellular Carcinoma. New England Journal of Medicine 2020;382:1894–905. doi:10.1056/NEJMoa1915745 - DOI - PubMed
    1. Cheng A-L, Qin S, Ikeda M, et al. Updated efficacy and safety data from IMbrave150: atezolizumab plus bevacizumab vs. sorafenib for unresectable hepatocellular carcinoma. Journal of Hepatology Published Online First: December 2021. doi:10.1016/j.jhep.2021.11.030 - DOI - PubMed

Publication types