. 2022 Feb 23;13(1):1009.
doi: 10.1038/s41467-022-28515-1.

Proteomic profiling reveals CDK6 upregulation as a targetable resistance mechanism for lenalidomide in multiple myeloma

Affiliations

Proteomic profiling reveals CDK6 upregulation as a targetable resistance mechanism for lenalidomide in multiple myeloma

Yuen Lam Dora Ng et al. Nat Commun. .

Abstract

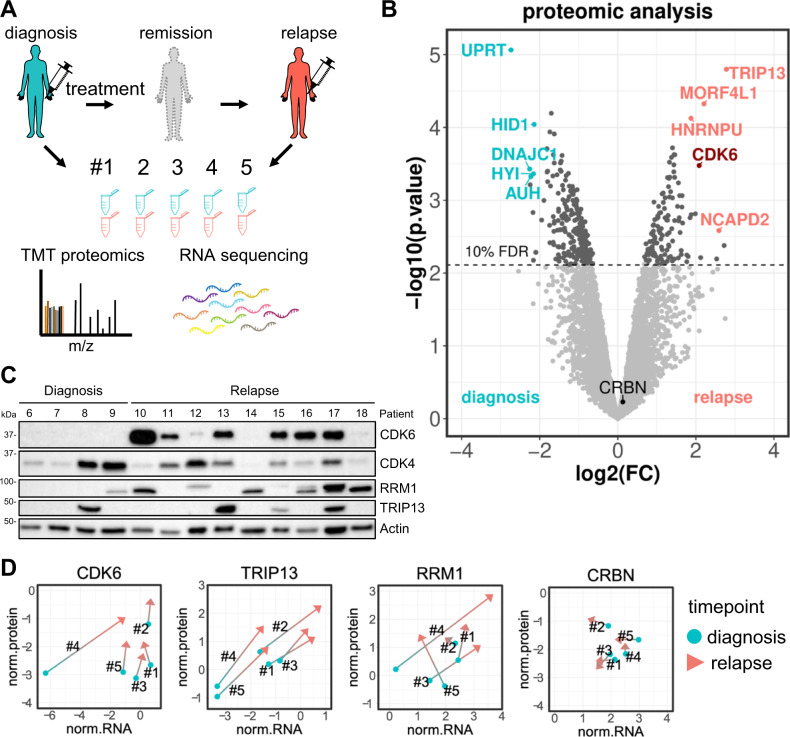
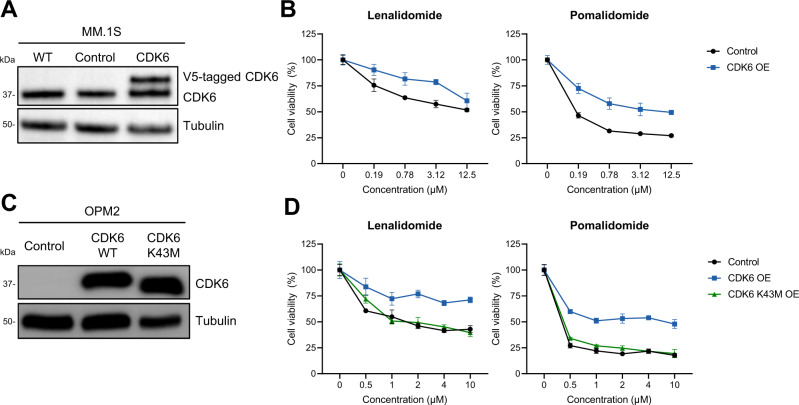
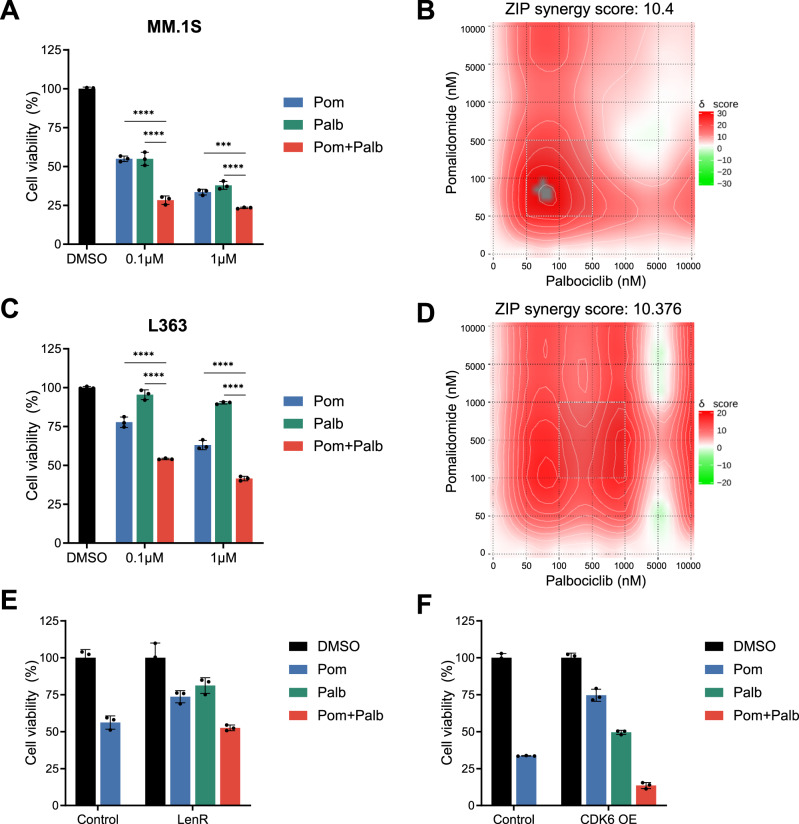
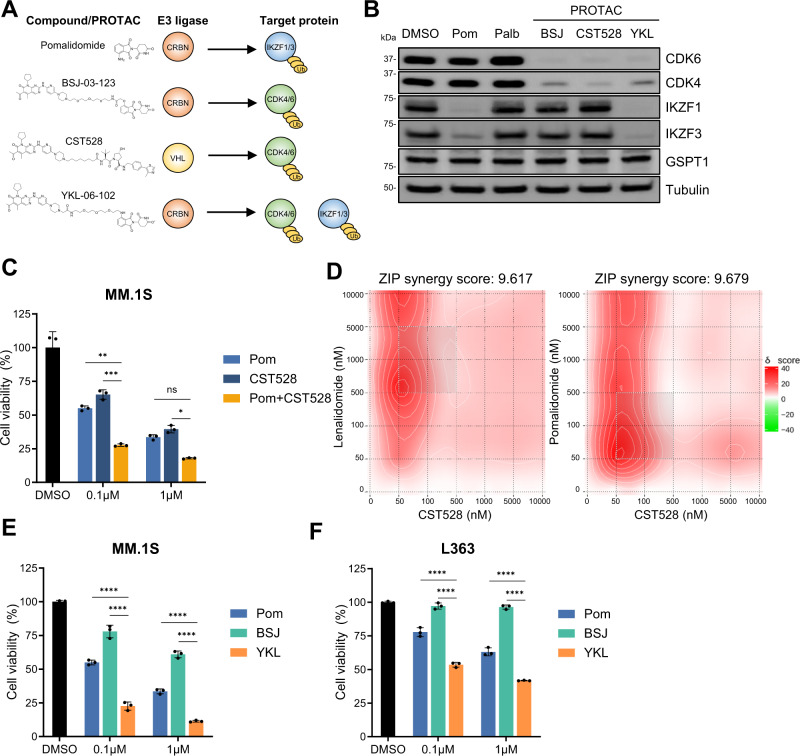
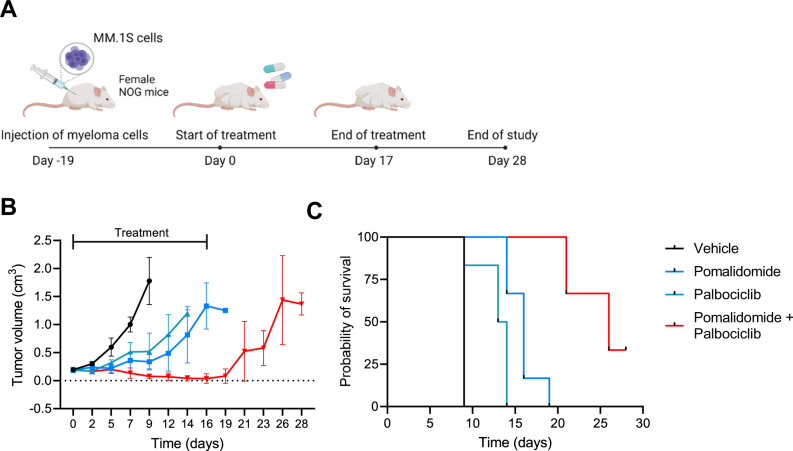
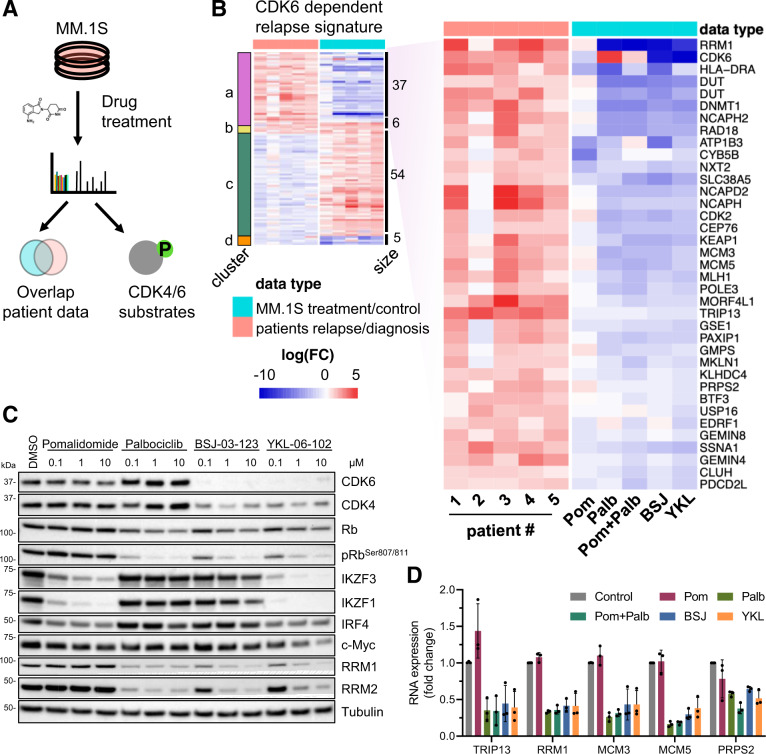
The immunomodulatory drugs (IMiDs) lenalidomide and pomalidomide are highly effective treatments for multiple myeloma. However, virtually all patients eventually relapse due to acquired drug resistance with resistance-causing genetic alterations being found only in a small subset of cases. To identify non-genetic mechanisms of drug resistance, we here perform integrated global quantitative tandem mass tag (TMT)-based proteomic and phosphoproteomic analyses and RNA sequencing in five paired pre-treatment and relapse samples from multiple myeloma patients. These analyses reveal a CDK6-governed protein resistance signature that includes myeloma high-risk factors such as TRIP13 and RRM1. Overexpression of CDK6 in multiple myeloma cell lines reduces sensitivity to IMiDs while CDK6 inhibition by palbociclib or CDK6 degradation by proteolysis targeting chimeras (PROTACs) is highly synergistic with IMiDs in vitro and in vivo. This work identifies CDK6 upregulation as a druggable target in IMiD-resistant multiple myeloma and highlights the use of proteomic studies to uncover non-genetic resistance mechanisms in cancer.


Conflict of interest statement

J.K. has received fees for advisory boards from BMS, Takeda, and Janssen. All other authors declare no competing interests.

Figures

Fig. 1
Fig. 1. Identification of CDK6 protein upregulation in relapsed multiple myeloma patients.
A Bone marrow samples of five multiple myeloma patients were obtained at diagnosis and at relapse. Samples were subjected to TMT-based quantitative proteomic analysis and RNA sequencing. B Protein level changes at relapse/diagnosis were determined for each patient (N = 5) and analyzed with a moderated 1-sample t-test. Average log2(fold change) of each protein is plotted against its –log10(p-value). Top regulated proteins passing the 0.1 FDR significance cutoff are highlighted in color. C Western blot validation of top candidates in an independent patient cohort of primary patient samples obtained pre-treatment and at relapse (N = 13 patient samples). D Median normalized protein intensities (log2 TMT intensities) of CDK6, TRIP13, RRM1 and CRBN in all 10 samples were plotted against their respective normalized RNA expression levels (log2 TPM values). Samples from the same patient are connected. Source data are provided as a Source Data file.
Fig. 2
Fig. 2. High expression levels of CDK6 confers augmented IMiD-resistance.
A Overexpression of CDK6 in MM.1S cells using lentiviral transduction confirmed through western blot analysis. B Cell viability of CDK6-overexpressing MM.1S cells upon 96 h treatment with lenalidomide and pomalidomide at indicated concentrations. (N = 3 biologically independent replicates). C Overexpression of CDK6 in OPM2 cells using retroviral transduction confirmed through western blot analysis. D Cell viability of CDK6 WT or K43M-overexpressing OPM2 cells upon 96 h treatment with lenalidomide and pomalidomide at indicated concentrations. (N = 3 biologically independent replicates) Control denotes empty vector. Cell viability is normalized to respective DMSO conditions. Data represent the mean ± SD of biological triplicates. Source data are provided as a Source Data file.
Fig. 3
Fig. 3. CDK6 inhibition by palbociclib synergizes with IMiD treatment of multiple myeloma cells.
A Cell viability of MM.1S cells treated 96 h with pomalidomide (pom), palbociclib (palb), or in combination. (N = 3 biologically independent replicates). B Synergy map of MM.1S cells treated with palbociclib in combination with lenalidomide or pomalidomide. C Cell viability of L363 cells treated with pomalidomide, palbociclib, or in combination (N = 3 biologically independent replicates). D Synergy map of L363 cells treated with palbociclib in combination with lenalidomide or pomalidomide. E Cell viability of MM.1S LenR cells (N = 3 biologically independent replicates) and F OPM2 CDK6 OE cells upon combination treatment of pomalidomide and palbociclib (N = 3 biologically independent replicates) Synergy levels are indicated with ZIP synergy scores. Synergy maps were generated with SynergyFinder. Cell viability is normalized to respective DMSO conditions. Data represent the mean ± SD of biological triplicates. One-way ANOVA is applied. P values are displayed as follows: n.s. = P > 0.05; *P ≤ 0.05; **P ≤ 0.01; ***P ≤ 0.001; ****P ≤ 0.0001. Source data are provided as a Source Data file.
Fig. 4
Fig. 4. CDK6 inhibition synergizes with IKZF1/3 degradation.
A Chemical structure, hijacked E3 ligase, and targets of pomalidomide (pom), PROTAC BSJ-03-123 (BSJ), PROTAC CST528, and PROTAC YKL-06-102 (YKL). B Western blot analysis of MM.1S cells treated with 1 µM of pomalidomide, palbociclib, BSJ-03-123, CST528, and YKL-06-102 for 16 h (N = 3 biologically independent replicates). C Cell viability of MM.1S cells treated 96 h with pomalidomide, CST528 and in combination (N = 3 biologically independent replicates). D Synergy map of MM.1S cells treated with CST528 in combination with lenalidomide or pomalidomide. E Cell viability of 96 h treatment with pomalidomide, BSJ-03-123 and YKL-06-102 in MM.1S cells (N = 3 biologically independent replicates) and F L363 cells (N = 3 biologically independent replicates). Synergy levels are indicated with ZIP synergy scores. Synergy maps were generated with SynergyFinder. Cell viability is normalized to respective DMSO conditions. Data represent the mean ± SD of biological triplicates. One-way ANOVA is applied. P values are displayed as follows: n.s. = P > 0.05; *P ≤ 0.05; **P ≤ 0.01; ***P ≤ 0.001; ****P ≤ 0.0001. Source data are provided as a Source Data file.
Fig. 5
Fig. 5. Combination treatment of pomalidomide and palbociclib has high therapeutic efficacy in multiple myeloma in vivo.
A MM.1S cells were injected into NOG mice and treatment started 19 days after injection of myeloma cells when tumors were ~0.2 cm3. Mice were treated on a daily basis with vehicle control, pomalidomide (5 mg/kg), palbociclib (50 mg/kg) or the combination p.o. for 17 days and observed until day 28. B Tumor growth in treated mice of monotherapy of pomalidomide and palbociclib, and in combination. Mice were taken out of the study when tumors exceeded a size of 1.2 cm3. C Survival of the four groups. Statistical differences were analyzed by log-rank Mantel–Cox test. All comparisons of survival curves resulted in P-vaues < 0.01. Data represent mean ± SD of biological replicates. Group size: n = 5 for vehicle group; n = 6 for pomalidomide treatment group; n = 6 for palbociclib treatment group; n = 6 for pomalidomide + palbociclib treatment group. Figure A was created with BioRender.com. Source data are provided as a Source Data file.
Fig. 6
Fig. 6. Targeting CDK6 in myeloma cells reverses a relapse protein signature.
A Proteomic and phosphoproteomic changes of MM1.S cells treated with different drugs and combinations were assessed with TMT-based proteomics. B Combined heatmap displaying protein levels of paired-patient data and cell perturbation data. MM.1S cells were treated for 24 h with pomalidomide (pom), palbociclib (palb), in combination (pom + palb), BSJ-03-123 (BSJ), and YKL-06-102 (YKL). C Western blot analysis of MM.1S cells treated for 16 h with respective treatments at indicated concentrations (N = 3 biologically independent replicates). D mRNA levels of downstream CDK6 targets in MM.1S cells upon treatment of 1 µM with pomalidomide, palbociclib, or in combination, BSJ-03-123 and YKL-06-102 (N = 3 biologically independent replicates) mRNA expression is normalized to respective GAPDH levels and DMSO conditions. Data represent the mean ± SD of biological triplicates. Source data are provided as a Source Data file.

References

    1. Kumar SK, Rajkumar V, Kyle RA, Van Duin M, Sonneveld P. Multiple myeloma. Nat. Rev. Dis. Prim. 2017;3:1–20. - PubMed
    1. Ito T, et al. Identification of a primary target of thalidomide teratogenicity. Science. 2010;327:1345–1350. - PubMed
    1. Krönke J, et al. Lenalidomide causes selective degradation of IKZF1 and IKZF3 in multiple myeloma cells. Science. 2014;343:301–305. - PMC - PubMed
    1. Lu G, et al. The myeloma drug lenalidomide promotes the cereblon-dependent destruction of ikaros proteins. Science. 2014;343:305–309. - PMC - PubMed
    1. Zhu YX, et al. Identification of cereblon-binding proteins and relationship with response and survival after IMiDs in multiple myeloma. Blood. 2014;124:536–545. - PMC - PubMed

Publication types

MeSH terms