. 2022 Feb 23;13(1):1018.
doi: 10.1038/s41467-022-28508-0.

Protective immune trajectories in early viral containment of non-pneumonic SARS-CoV-2 infection

Affiliations

Protective immune trajectories in early viral containment of non-pneumonic SARS-CoV-2 infection

Kami Pekayvaz et al. Nat Commun. .

Abstract

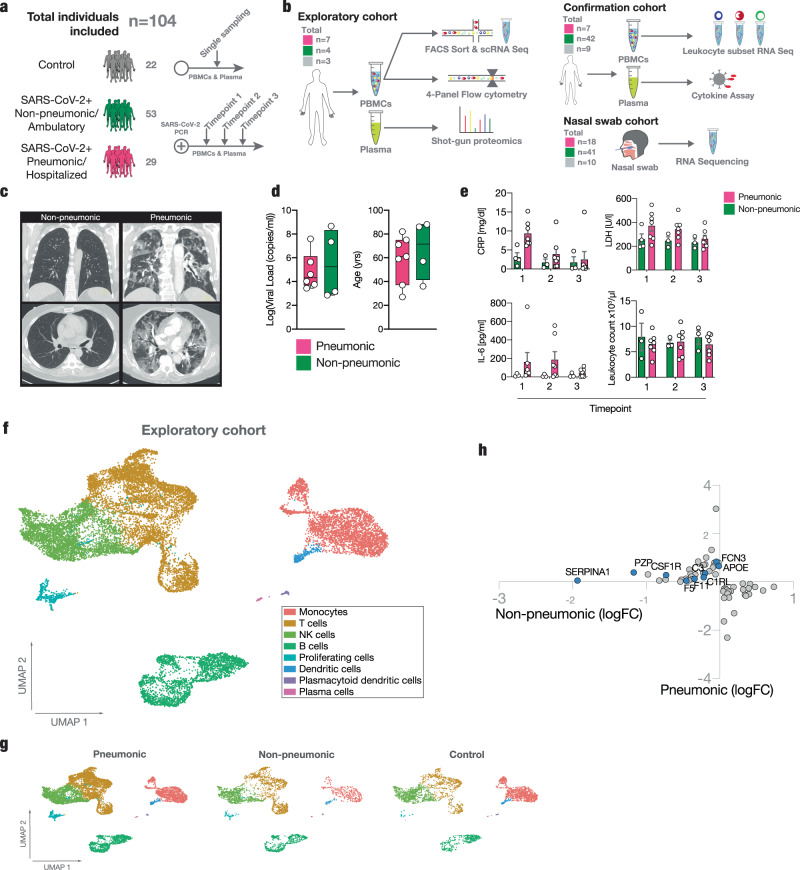
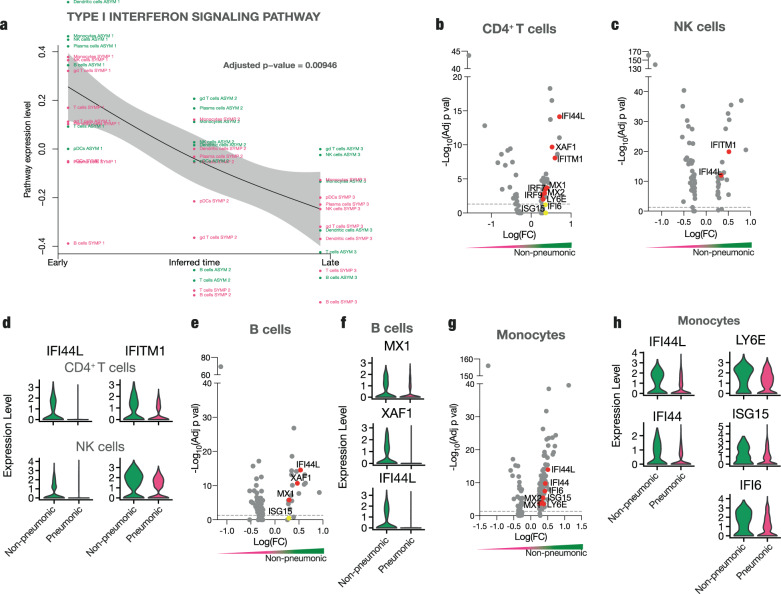
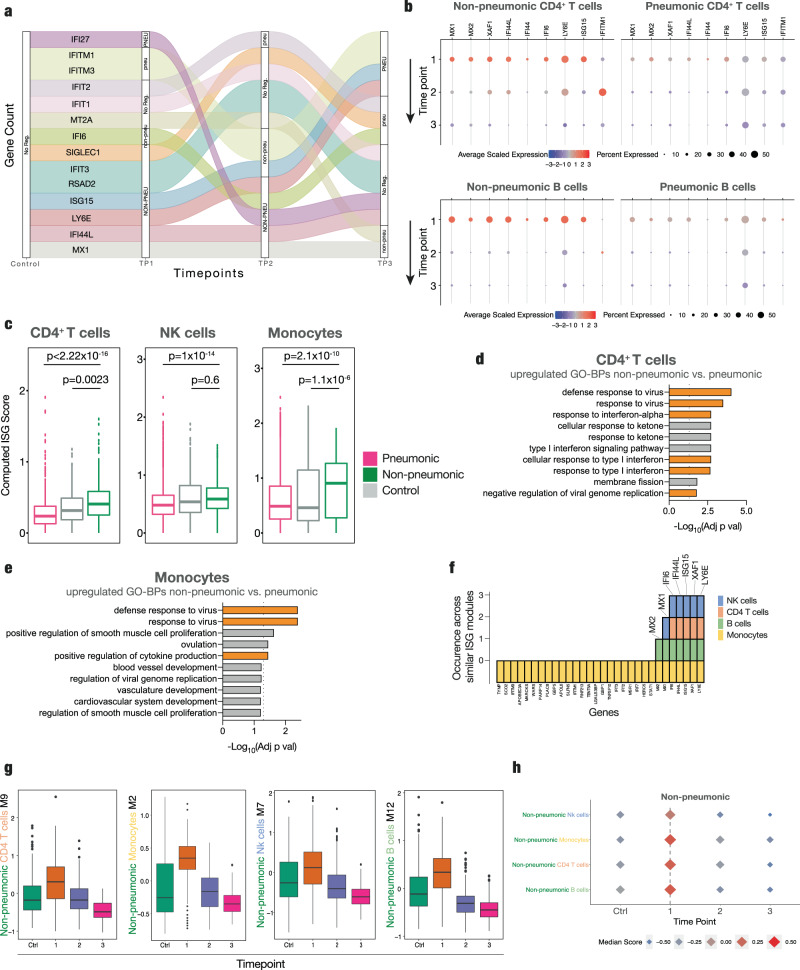
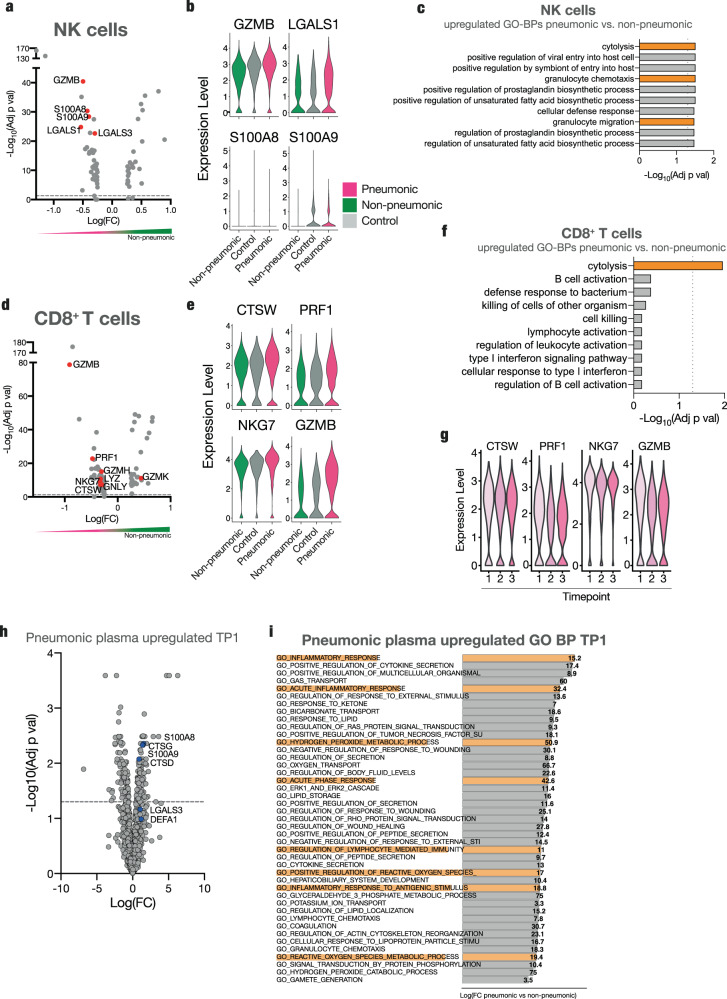
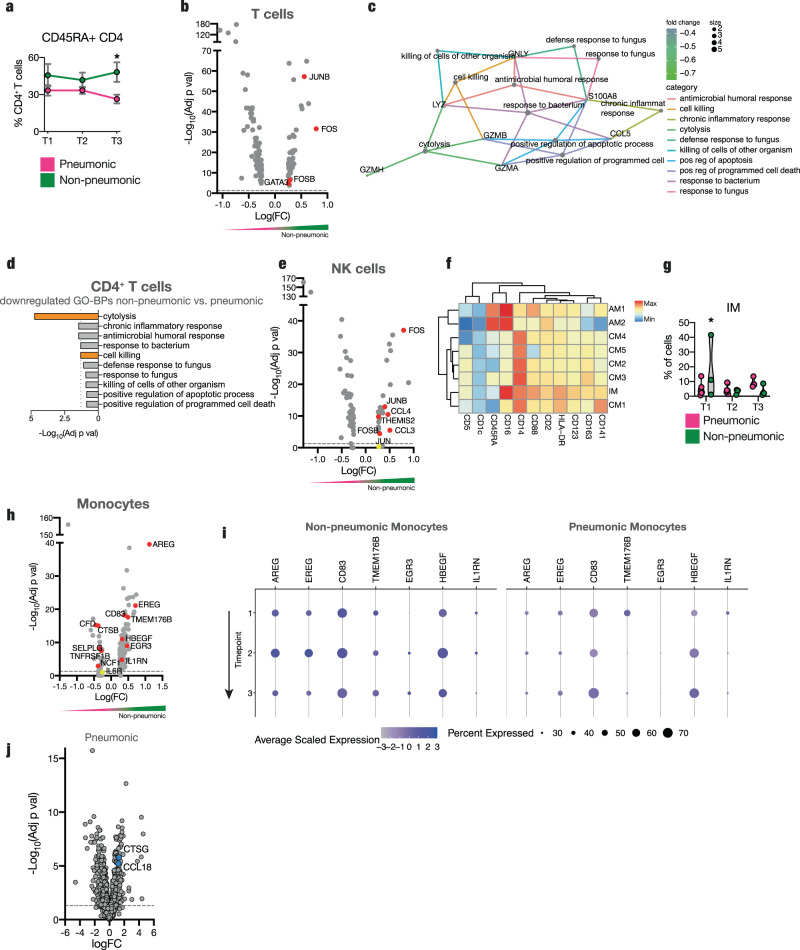
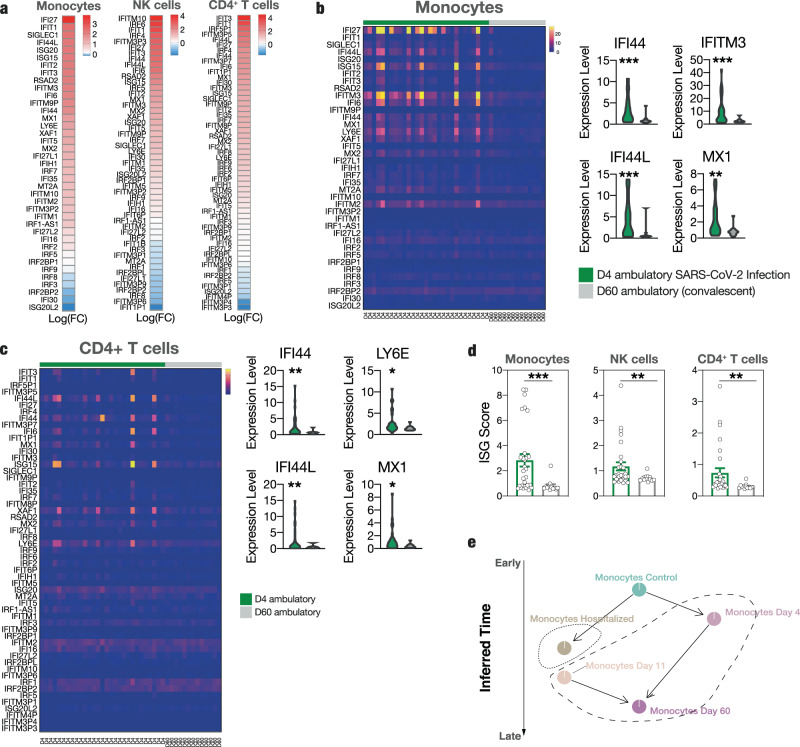
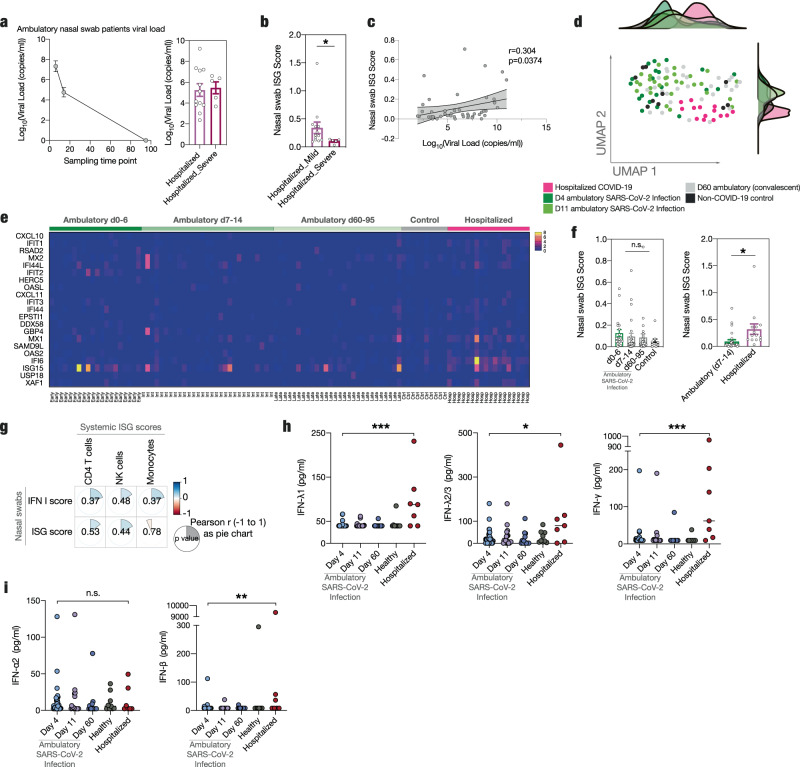
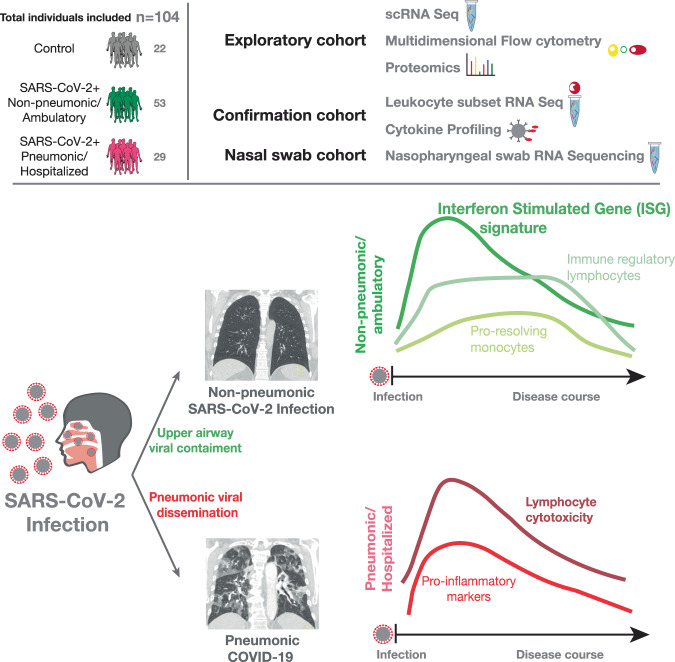
The antiviral immune response to SARS-CoV-2 infection can limit viral spread and prevent development of pneumonic COVID-19. However, the protective immunological response associated with successful viral containment in the upper airways remains unclear. Here, we combine a multi-omics approach with longitudinal sampling to reveal temporally resolved protective immune signatures in non-pneumonic and ambulatory SARS-CoV-2 infected patients and associate specific immune trajectories with upper airway viral containment. We see a distinct systemic rather than local immune state associated with viral containment, characterized by interferon stimulated gene (ISG) upregulation across circulating immune cell subsets in non-pneumonic SARS-CoV2 infection. We report reduced cytotoxic potential of Natural Killer (NK) and T cells, and an immune-modulatory monocyte phenotype associated with protective immunity in COVID-19. Together, we show protective immune trajectories in SARS-CoV2 infection, which have important implications for patient prognosis and the development of immunomodulatory therapies.


Conflict of interest statement

The authors declare no conflict of interest.

Figures

Fig. 1
Fig. 1. Study overview and longitudinal clinical and cellular dynamics in non-pneumonic and pneumonic SARS-CoV-2 infection.
a, b Experimental setup and processing pipeline. a Plasma and PBMCs of n = 22 non-infected Controls, n = 29 pneumonic/hospitalized COVID-19, n = 53 non-pneumonic/ambulatory infected patients were sampled b Exploratory cohort: longitudinal samples from 11 pneumonic and non-pneumonic infected patients and one timepoint from three non-infected control patients were used for shotgun plasma proteomics, 50-dimensional flow cytometry or single-cell RNA sequencing. scRNA sequencing: n = 12 patients (n = 6 pneumonic, n = 3 non-pneumonic, n = 3 control), 4-panel flow cytometry: n = 11 patients (n = 7 pneumonic, n = 4 non-pneumonic), shot-gun proteomics: n = 14 patients (n = 7 pneumonic, n = 4 non-pneumonic, n = 3 control). Not all patients from one cohort were included into every analysis due to a lack of respective sample availability. Confirmation cohort: Longitudinal samples were used for leukocyte subset RNA sequencing: n = 55 patients (n = 39 ambulatory patients, n = 7 hospitalized patients, n = 9 controls) and cytokine assays n = 56 (n = 40 ambulatory patients n = 7 hospitalized patients, n = 9 controls). Nasal swab cohort: RNAseq of nasal swabs n = 69 (n = 41 ambulatory patients n = 18 hospitalized patients, n = 10 controls). Nasal swabs were included from both hospitalized and ambulatory patients that were either already included in the two independent cohorts mentioned above (n = 37) or were additionally recruited (n = 32). c Representative axial and coronal computed-tomographic scans of hospitalized pneumonic and non-pneumonic infected patients. d Baseline characteristics of the exploratory group: log10 of viral load as measured in copies/ml of upper respiratory tract swap samples. n = 6 pneumonic COVID-19, n = 4 non-pneumonic infected patients. Age in years of patients. n = 7 pneumonic COVID-19, n = 4 non-pneumonic. Box-and-whiskers plot (median, IQR and min-max). e Qualitative longitudinal clinical laboratory values of CRP (mg/dl), LDH(U/l), IL-6 (pg/ml), and total leukocyte count (1000/µl) at time points 1–3. n = 7 pneumonic COVID-19 per time point, n = 3 non-pneumonic COVID-19 patients per time point, except TP1 CRP and LDH n = 4. f Integrated UMAP representation of the pooled exploratory cohort showing the assigned cell populations. g Integrated UMAP representation of the sequenced samples showing the assigned cell populations per group for all time points. h Plot depicting significantly (p < 0.05) differentially expressed proteins in plasma samples pooled across all three time points. Log fold changes are computed relative to the control proteins’ expression. All error bars are mean ± s.e.m. unless otherwise noted. Source data are provided as a Source Data file.
Fig. 2
Fig. 2. Enhanced interferon response across immune cell populations defines protective immunity in SARS-CoV-2 infection.
a Tempora based analysis of longitudinally alternating gene pathways across cell clusters of pneumonic and non-pneumonic patients yielding “Type I Interferon signaling pathway” as a temporally significantly regulated pathway, non-pneumonic clusters are depicted in green, pneumonic clusters are in red, timepoints are chronologically set throughout the inferred time axis and depicted in the cluster names, statistical test conducted using the Tempora method. b, c Volcano plots of differentially regulated genes in CD4+ T cells and NK cells of pneumonic compared to non-pneumonic samples. Genes enriched in pneumonic samples have negative log(FC), genes enriched in non-pneumonic samples have positive log(FC). The color scale underneath emphasizes this (red pneumonic, green non-pneumonic) d Violin plots of expression of IFI44L and IFITM1 in CD4+ T cells and NK cells for pneumonic and non-pneumonic samples. e Volcano plot of differentially regulated genes in B cells of pneumonic compared to non-pneumonic samples. f Violin plots of expression of MX1, XAF1, and IFI44L in B cells for pneumonic and non-pneumonic samples. g Volcano plot of differentially regulated genes in monocytes of pneumonic compared to non-pneumonic samples. h Violin plots of expression of IFI44L, IFI44, LY6E, ISG15, and IFI6 in monocytes for pneumonic and non-pneumonic samples. b, c, e, g Red annotations are significantly upregulated (adj p val < 0.05), yellow ones are non-significantly differentially expressed. Positive fold change signifies higher expression in the non-pneumonic group. Line denotes adj p val < 0.05. Statistical testing for volcano plots described in methods. bh Longitudinal samples are pooled if not otherwise indicated.
Fig. 3
Fig. 3. Differentially regulated interferon response across time points.
a Double-differential time series plot of monocytes depicting which patient group shows increased expression of predefined ISGs, always in comparison to non-infected controls at baseline, binned by the 0.25 and 0.75 quantiles of all (absolute) double-differential fold changes into PNEU, pneu, No Reg, non-pneu, and NON-PNEU, which display different magnitudes of differential regulation. b Dot-plot of the scaled average expression and percent expressing cells of selected interferon-stimulated genes in CD4+ T-cells and B cells by sampling time point in non-pneumonic and pneumonic patients. c Box plots of ISG-scores (see methods) of CD4+ T cells (n =  725 pneumonic n = 388 non- pneumonic and n = 162 control cells), NK cells (n =  2550 pneumonic n = 888 non- pneumonic and n = 903 control cells) and monocytes (n =  1713 pneumonic n = 380 non- pneumonic and n = 1303 control cells). P values are shown above, non-pneumonic with pneumonic and control with pneumonic are compared. Box-and-whiskers plot (median, IQR, and 1.5IQR), two-sided t-tests. d, e Top 10 Gene Ontology - Biological Processes (GO-BPs) terms from upregulated genes of non-pneumonic vs pneumonic samples. Pathways of interest are marked, line shows adj p val < 0.05. Statistical testing described in methods. ce Longitudinal samples are pooled if not otherwise indicated. f Number of identical occurrence of genes of ISG GMs of non-pneumonic patients in four immune cell subsets. g Box-plots showing temporal development of the specific ISG-GMs in non-pneumonic patients. Box-and-whiskers plot (median, IQR, and 1.5IQR). h Dot plots displaying the median score of respective ISG-modules of NK-cells, Monocytes, CD4 T cells, B cells throughout time in non-pneumonic patients and in control patients. CD4 T cells n = 162,155,185 and 48 per TP respectively, monocytes n = 1303,131,208 and 41 per TP respectively, NK cells n = 903,314,495 and 79 per TP respectively and B cells n = 440,264,279 and 103 per TP respectively. Source data are provided as a Source Data file.
Fig. 4
Fig. 4. Downregulation of cytotoxic potential in lymphocytes in non-pneumonic SARS-CoV-2 infection.
a Volcano plot of differentially regulated genes in NK cells of pneumonic compared to non-pneumonic samples. b Violin plots of expression of GZMB, S100A8, LGALS1, and S100A9 in NK cells for pneumonic, control, and non-pneumonic samples. c Top 10 GO-BPs from upregulated genes of non-pneumonic vs pneumonic samples in NK cells. Pathways of interest are marked, line shows adj p val < 0.05. d Volcano plot of differentially regulated genes in CD8+ T cells of pneumonic compared to non-pneumonic samples. a, d Red annotations are significantly differentially regulated (adj p val < 0.05. Positive fold change signifies higher expression in the non-pneumonic group. Line denotes adj p val < 0.05. e Violin plots of expression of CTSW, PRF1, NKG7, and GZMB in CD8+ T cells for pneumonic, control, and non-pneumonic samples. f Top 10 upregulated GP-BPs of non-pneumonic vs pneumonic samples in CD8+ T cells. Pathways of interest are marked, line shows adj p val < 0.05. g Violin plots of expression of CTSW, PRF1, NKG7, and GZMB in CD8+ T cells per sampling time point. h Volcano plot of differentially expressed plasma proteins at TP1 of pneumonic samples compared to control samples. Line denotes adj p val < 0.05. i Top significantly enriched GO-BPs for pneumonic plasma proteins compared to non-pneumonic plasma proteins. Pathways of interest to lymphocyte cytotoxicity are marked. Statistical testing for GO-BPs and volcanos described in methods. Source data are provided as a Source Data file.
Fig. 5
Fig. 5. Abundant unexperienced and immune-modulatory T-cells and antiviral NK-cells and anti-inflammatory and anti-thrombotic monocytes in non-pneumonic SARS-CoV-2 infection.
a Percentage of CD45RA+ CD4+ T cells of live PBMCs measured by flow cytometry per sampling time point. Two-sided t-test, n = 4 per time point for non-pneumonic, n = 7,4 and 7 per time point respectively for pneumonic. p = 0.0170. b Volcano plot of differentially regulated genes in all T cells of pneumonic compared to non-pneumonic samples. c, d GO-BP network analysis and Top10 downregulated GP-BPs of non-pneumonic vs pneumonic samples in CD4+ T cells. Pathways of interest are marked, line shows adj p val < 0.05. e Volcano plot of differentially regulated genes in NK cells of non-pneumonic compared to pneumonic samples. f Heat map of surface marker expression by FlowSOM group of flow cytometric measurement of monocytes. g Violin plot of Mono0 FlowSOM cluster per time point. Mixed-effects model analysis. Post-hoc Sidak’s multiple comparisons test for individual significant differences between pneumonic and non-pneumonic samples per time point. n = 3,4 and 4 per time point respectively for non-pneumonic, n = 7,7 and 3 per time point respectively for pneumonic. p = 0.0426. h Volcano plot of differentially up- and downregulated genes in monocytes of non-pneumonic compared to pneumonic samples. i Expression of selected genes from h in monocytes by disease condition and sampling time point. j Volcano plot of differentially expressed plasma proteins of pneumonic samples (all time points pooled) compared to control samples (one-sample moderated t-test). Line denotes adj p val < 0.05. b, e, h Red annotations are significantly upregulated adj p val < 0.05. Positive fold change signifies higher expression in the non-pneumonic group. Statistical testing for GO-BPs and volcanos described in methods. Source data are provided as a Source Data file. Line denotes adj p val < 0.05. All error bars are mean ± s.e.m. *p < 0.05.
Fig. 6
Fig. 6. Robust early upregulation of ISGs in a large ambulatory SARS-CoV-2 infected cohort.
a Heat maps of differentially expressed interferon stimulated genes in leukocyte subsets (monocytes, NK cells, CD4+ T cells) of day 4 ambulatory compared to day 60 (convalescent) COVID-19. Monocytes: n = 33 upregulated, n = 6 downregulated. NK cells: n = 26 upregulated, n = 15 downregulated CD4+ T cells: n = 44 upregulated, n = 7 downregulated. b, c Heat maps and violin plots of differentially expressed interferon stimulated genes in monocytes and CD4+ T cells of day 4 ambulatory compared to day 60 (convalescent) COVID-19. Individual ISG expressions of exemplary ISGs. Monocytes IFI44 p = 0.0005 IFITM3 p = 0.0004 IFI44L p = 0.0005 MX1 p = 0.013. CD4 T cells IFI44 p = 0.0066 LY6E p = 0.106 IFI44L p = 0.0070 MX1 p = 0.101. d Computed ISG scores for monocytes p = 0.0004, NK cells p = 0.0087 and CD4+ T cells p = 0.0066. bd Unpaired two-sided t-test with Welch’s correction. n = 29 d4, n = 13 d60. e Tempora based analysis of monocyte trajectories from hospitalized and ambulatory patients in a longitudinal fashion. Source data are provided as a Source Data file. Mean ± sem is shown unless otherwise specified. *p < 0.05, **p < 0.01, ***p < 0.001.
Fig. 7
Fig. 7. Distinct antiviral immune responses at a local vs. systemic level.
a Longitudinal viral load course ambulatory nasal swab patients and hospitalized patients used RNA-sequencing of nasopharyngeal swab material. Log10(Viral Load (copies/ml) is depicted at sampling time points day 0–6 (n = 20), 7–14 (n = 29) and 60–95 (n = 27) post positive SARS-CoV-2 PCR (last day of sampling range used in graph). mean±sem. Hospitalized and severe hospitalized patient viral load, n = 12 and n = 5 respectively. b Nasal swab ISG score of nasopharyngeal swabs of hospitalized (n = 13) and severe hospitalized non-ICU patients (n = 5, see methods). Unpaired two-sided t-test with Welch’s correction, p = 0.0415. c Correlation between ambulatory d0-14 patient viral load and nasal swab ISG score. r and p value shown. n = 47 patients. p-value denotes slope non-zero. d UMAP clustering of patient samples. e Heat map of differentially expressed interferon-stimulated genes used for nasal swab ISG score. f Computed nasal swab ISG scores. Unpaired two-sided t-test with Welch’s correction. p = 0.0408 (df): d0-6 n = 20, d7-14 n = 29, d60-d95 n = 28, controls n = 10, hospitalized n = 14. g Pearson correlation between nasal swab ISG score and IFN I computed scores and systemic ISG scores of CD4 T cells, NK cells, and monocytes for ambulatory patients that had both early nasal swab and early blood sampling. P value is shown in center of each field (none <0.05). Pie charts show Pearson’s r from maximum 1 (clockwise and blue) to −1 (anticlockwise and red). n = 22 ambulatory patients. h, i Measurements of IFN-λ1 (p = 0.0003), IFN-λ2/3 (p = 0.0249), IFN-γ (p = 0.0001) (h), IFN-α2 (p = 0.8638), IFN-β (p = 0.0091) (i) in plasma samples. d4, 11 and 60 longitudinal ambulatory COVID-19 samples. n = 9 controls, n = 40 d4, n = 18 d11, n = 14 d60, n = 7 hospitalized COVID-19. Unpaired, two-sided Mann–Whitney U tests between d4 and all other groups. Non-significant results not shown, besides for hospitalized. Source data are provided as a Source Data file. Line denotes median. Mean ± sem is shown unless otherwise specified. *p < 0.05, **p < 0.01, ***p < 0.001.
Fig. 8
Fig. 8. Graphical abstract.
Upper left: schematic of the combined patient cohorts used. Upper right: Schematic of experimental setup. The study was divided into an exploratory cohort using scRNA-Seq, multidimensional flow cytometry of PBMCs, and shotgun plasma proteomics. The confirmation cohort was used to validate findings from the exploratory cohort, using in-depth RNA-Seq of FACS-sorted PBMCs and multiplex plasma cytokine profiling. Nasal swabs were included from both hospitalized and ambulatory patients that were either already included in the two independent cohorts mentioned above or were additionally recruited. Exact numbers for every cohort and method are depicted in Fig. 1a, b and in methods. Bottom: explanation of findings. After infection with SARS-CoV-2, the virus is either contained in the upper airway tract (“non-pneumonic SARS-CoV-2 infection”) or it disseminates into the lung (“pneumonic COVID-19”). Our study shows that non-pneumonic SARS-CoV-2 infection is characterized by an early strong interferon-stimulated-gene (ISG) signature, as well as an immune regulatory lymphocyte signature and pro-resolving monocytes in the peripheral blood. In contrast, in case of viral dissemination, pneumonic COVID-19 is characterized by lymphocyte cytotoxicity and a proinflammatory marker profile in the peripheral blood.

Similar articles

Cited by

References

    1. Zhu, N., et al. A novel coronavirus from patients with pneumonia in China, 2019. New Engl. J. Med.382, 727–733 (2020). - PMC - PubMed
    1. Zhou P, et al. A pneumonia outbreak associated with a new coronavirus of probable bat origin. Nature. 2020;579:270–273. - PMC - PubMed
    1. Ruan, Q., Yang, K., Wang, W., Jiang, L. & Song, J. Clinical predictors of mortality due to COVID-19 based on an analysis of data of 150 patients from Wuhan, China. Intensive Care Med.46, 846–848 (2020). - PMC - PubMed
    1. Chen G, et al. Clinical and immunological features of severe and moderate coronavirus disease 2019. J. Clin. Invest. 2020;130:2620–2629. - PMC - PubMed
    1. Laing AG, et al. A dynamic COVID-19 immune signature includes associations with poor prognosis. Nat. Med. 2020;26:1623–1635. - PubMed

Publication types