. 2022 Mar;603(7899):124-130.
doi: 10.1038/s41586-022-04424-7. Epub 2022 Feb 23.

TDP-43 represses cryptic exon inclusion in the FTD-ALS gene UNC13A

Affiliations

TDP-43 represses cryptic exon inclusion in the FTD-ALS gene UNC13A

X Rosa Ma et al. Nature. 2022 Mar.

Abstract

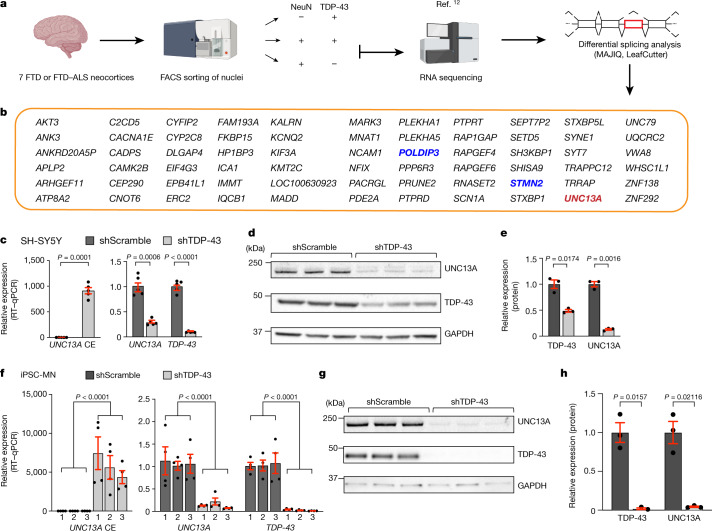
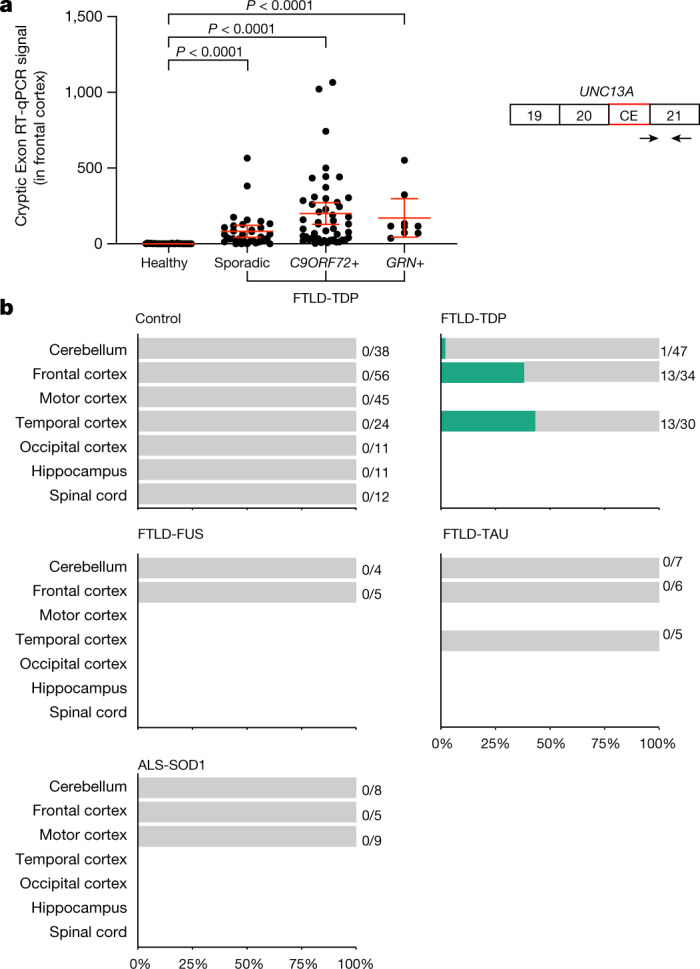
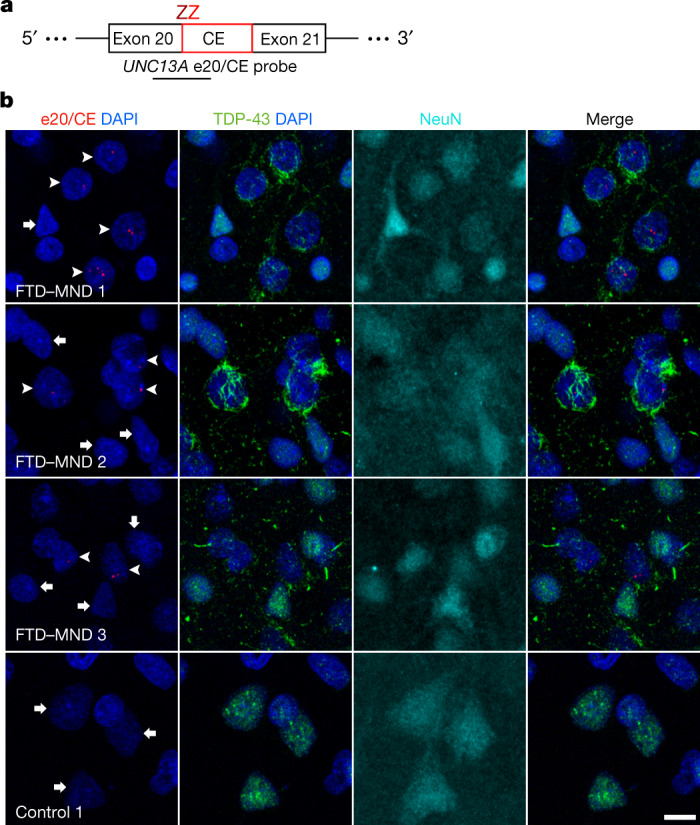
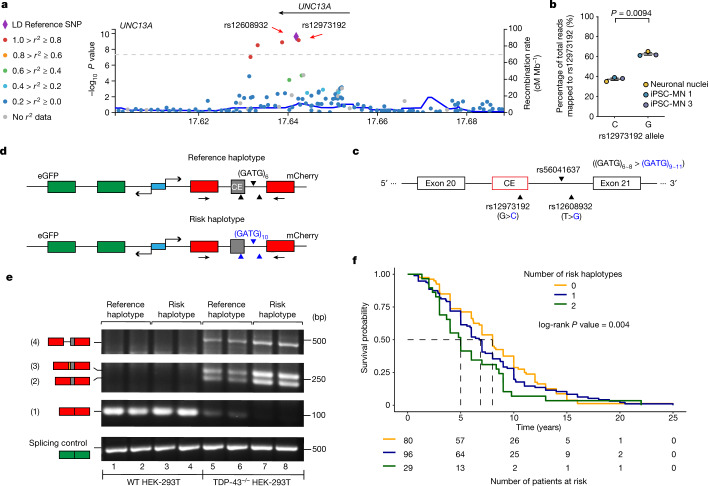
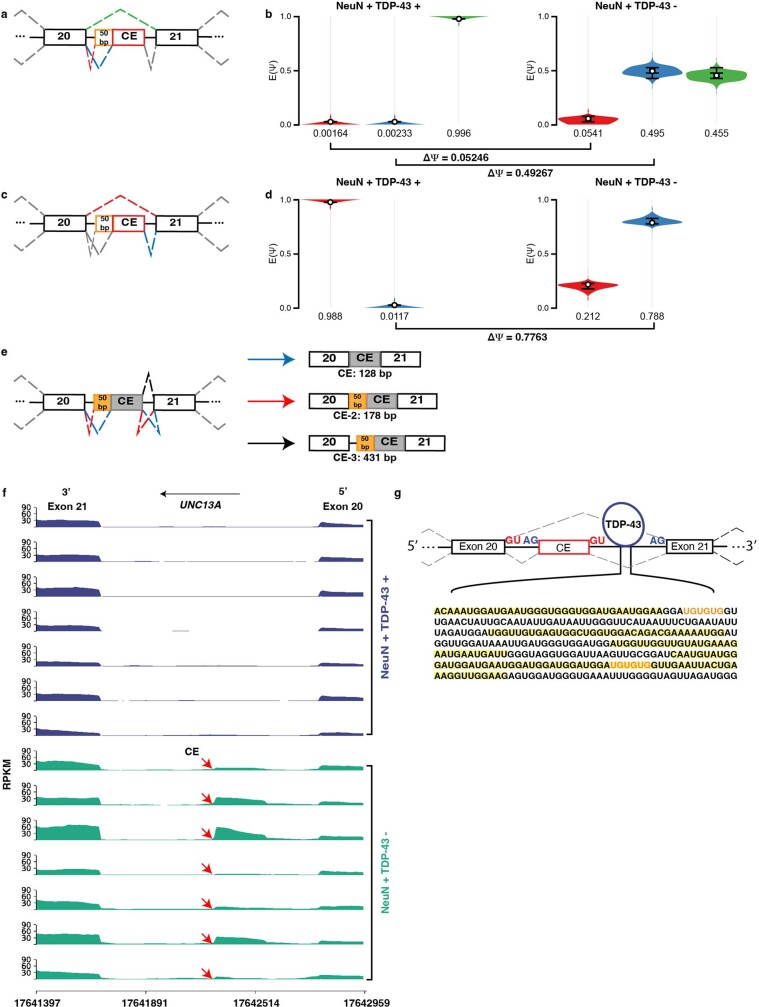
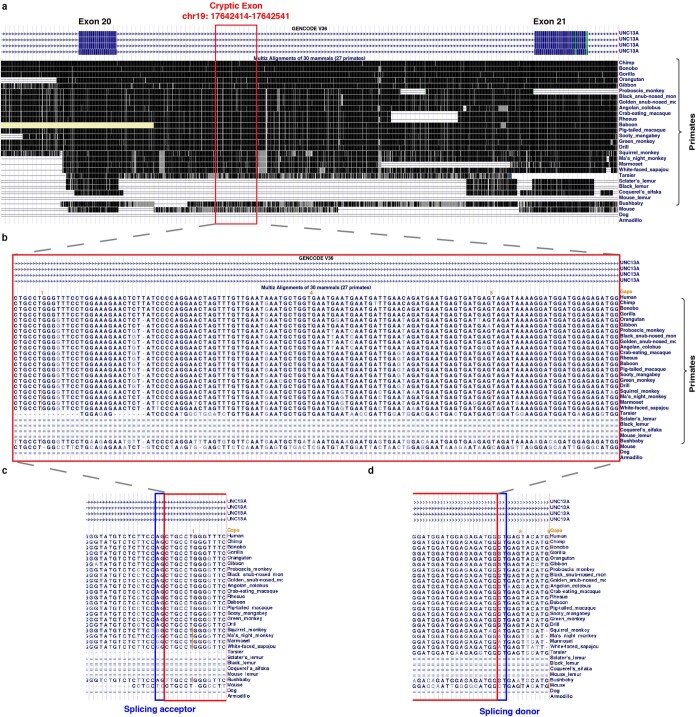
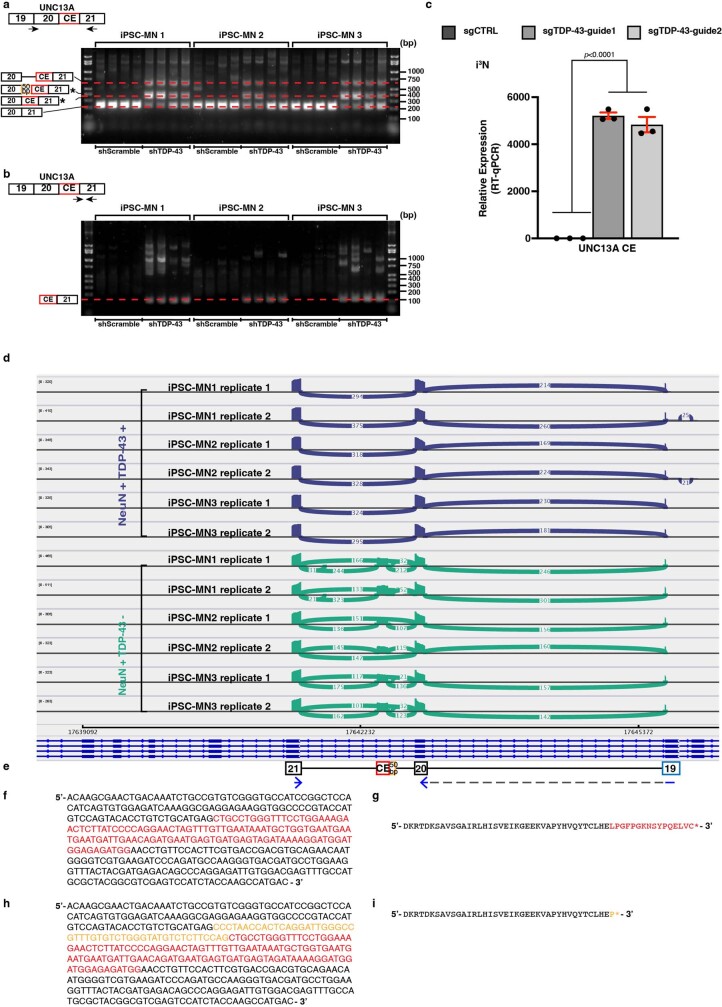
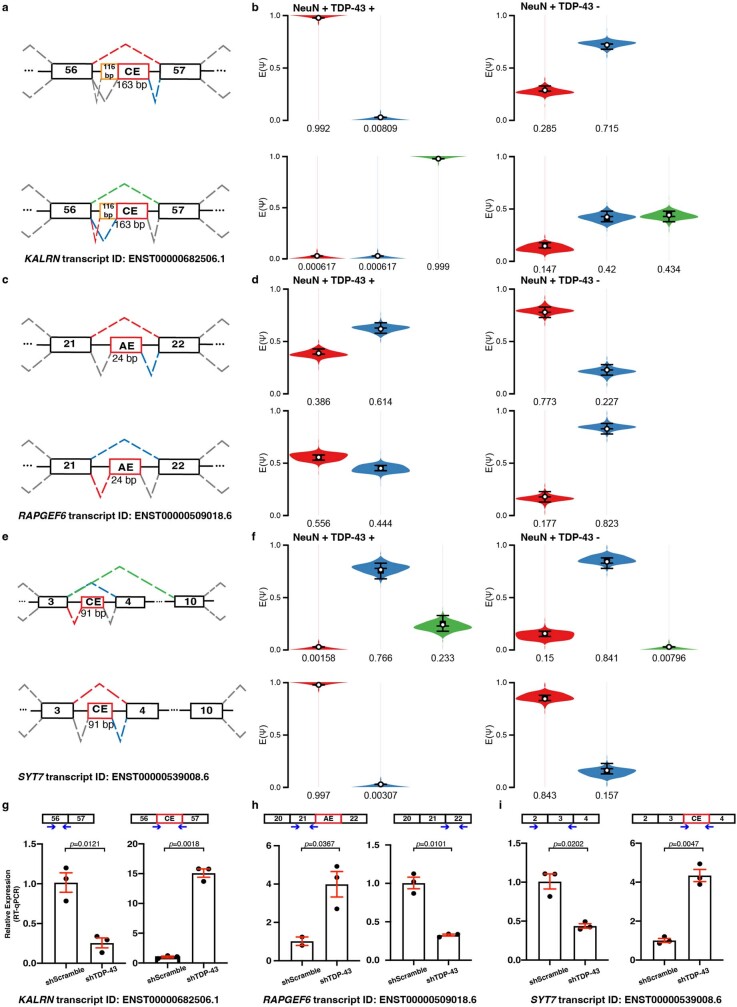
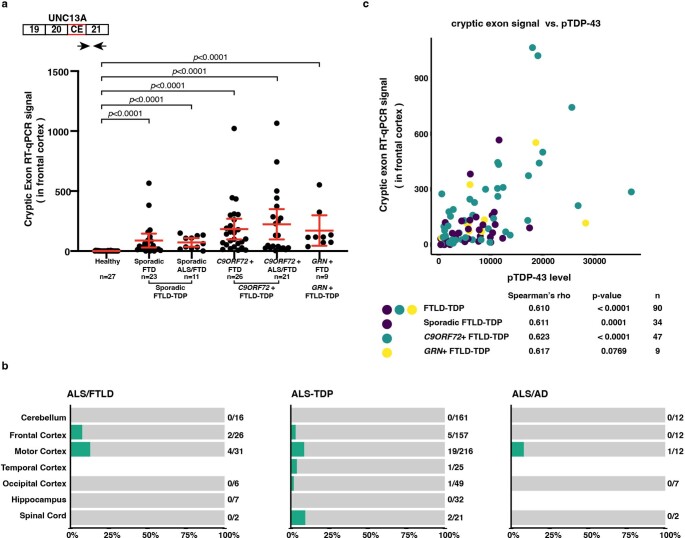
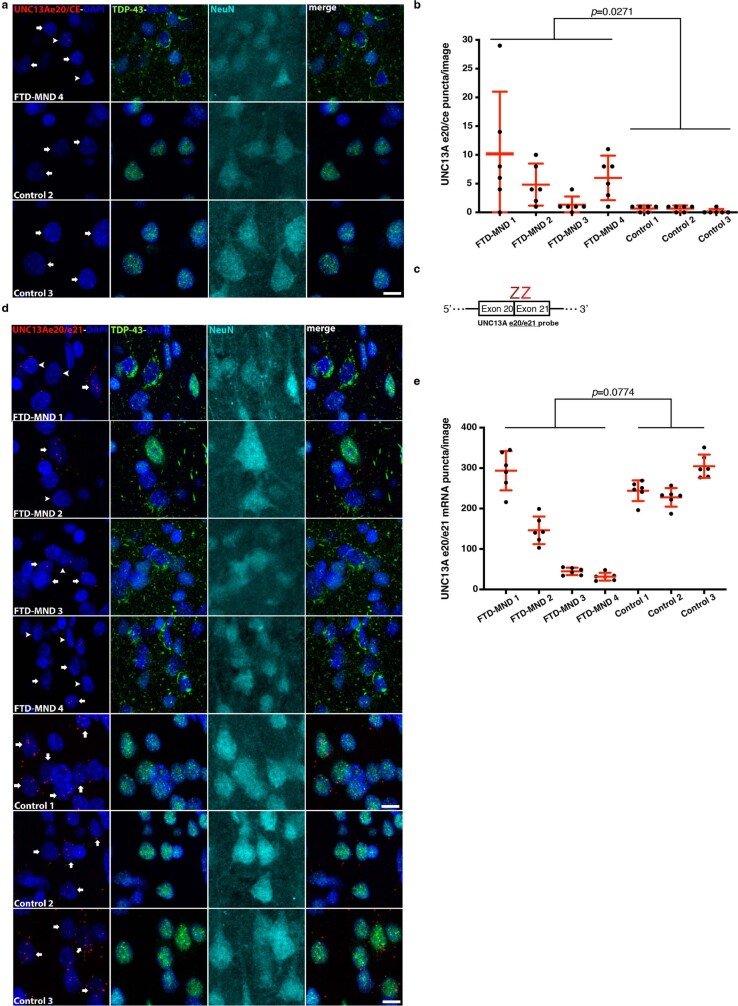
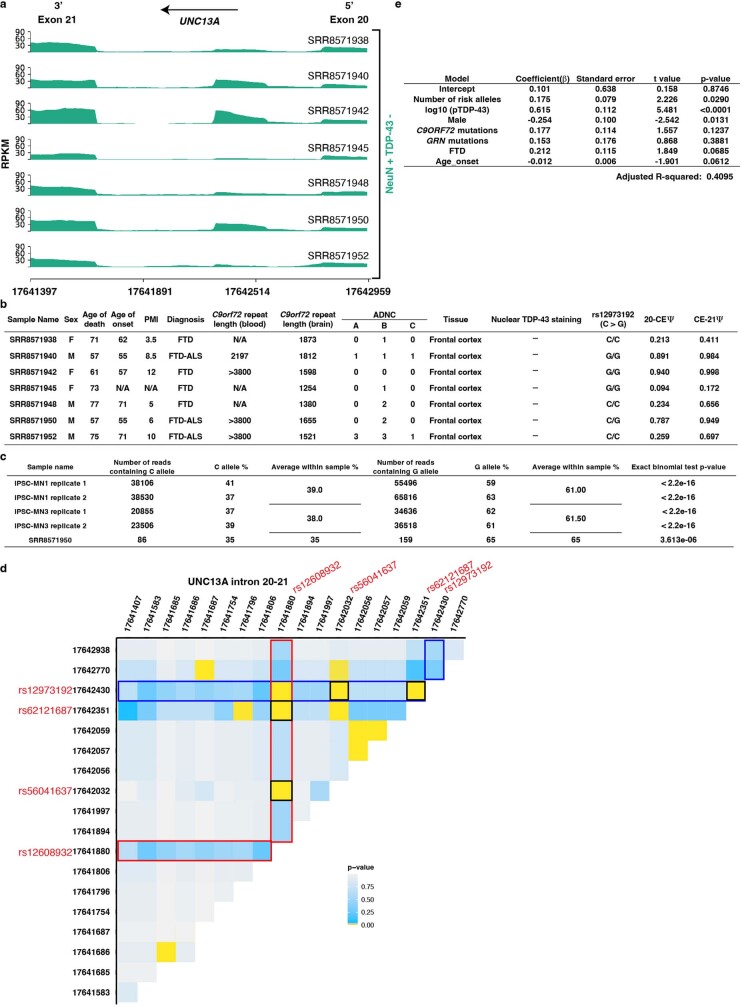
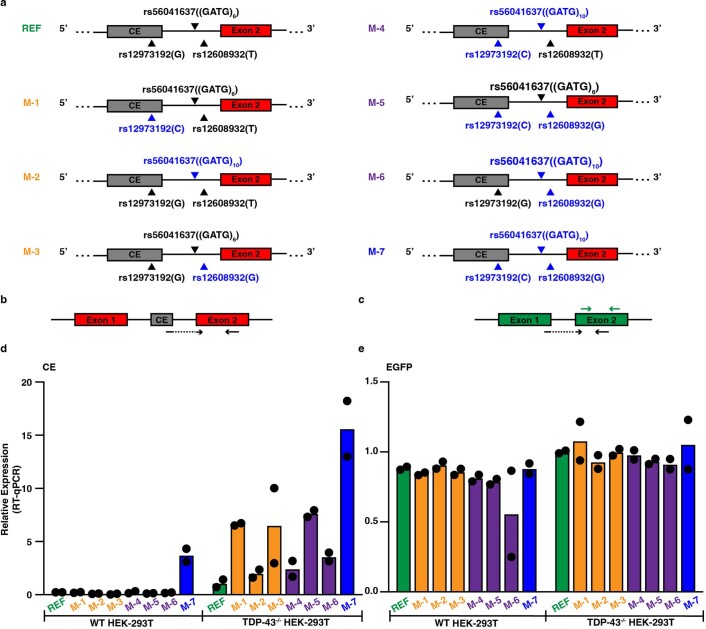
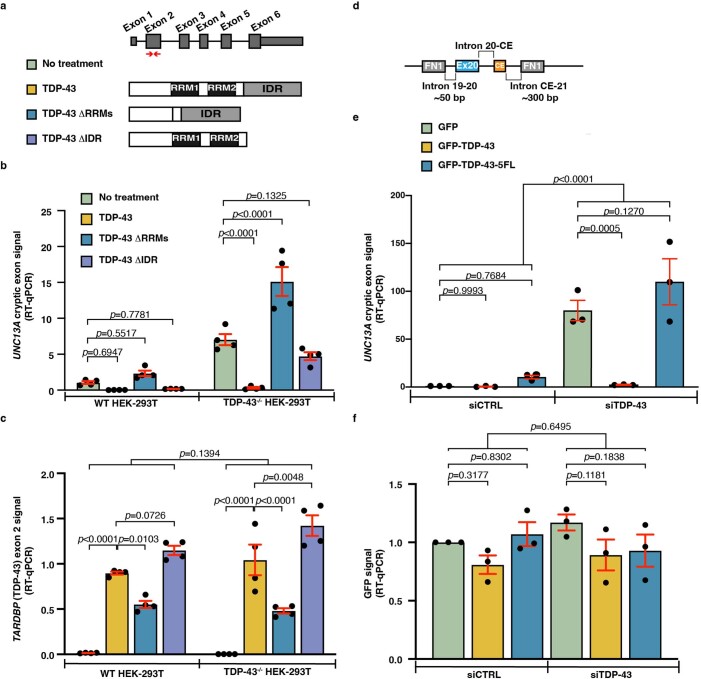
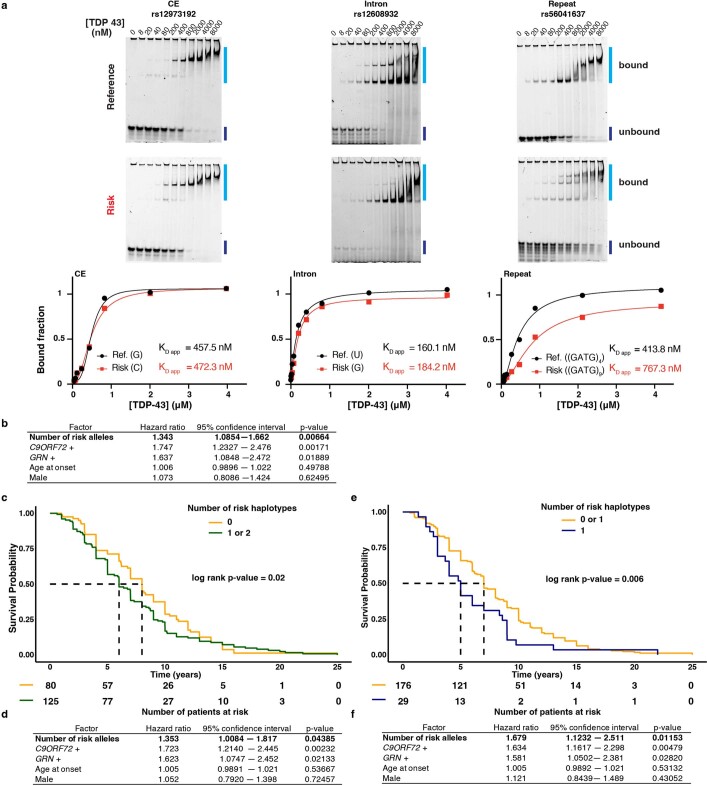
A hallmark pathological feature of the neurodegenerative diseases amyotrophic lateral sclerosis (ALS) and frontotemporal dementia (FTD) is the depletion of RNA-binding protein TDP-43 from the nucleus of neurons in the brain and spinal cord1. A major function of TDP-43 is as a repressor of cryptic exon inclusion during RNA splicing2-4. Single nucleotide polymorphisms in UNC13A are among the strongest hits associated with FTD and ALS in human genome-wide association studies5,6, but how those variants increase risk for disease is unknown. Here we show that TDP-43 represses a cryptic exon-splicing event in UNC13A. Loss of TDP-43 from the nucleus in human brain, neuronal cell lines and motor neurons derived from induced pluripotent stem cells resulted in the inclusion of a cryptic exon in UNC13A mRNA and reduced UNC13A protein expression. The top variants associated with FTD or ALS risk in humans are located in the intron harbouring the cryptic exon, and we show that they increase UNC13A cryptic exon splicing in the face of TDP-43 dysfunction. Together, our data provide a direct functional link between one of the strongest genetic risk factors for FTD and ALS (UNC13A genetic variants), and loss of TDP-43 function.


Conflict of interest statement

A.D.G. is a scientific founder of Maze Therapeutics. X.R.M. served as a consultant for Maze Therapeutics. M.P. and L.P. serve as consultants for Target ALS. F.H., B.B.C., D.W.W., K.K., G. Miller, S. Mekhoubad, N.S. and E.G. are employees of Maze Therapeutics, which has filed a patent (63/171,522) on methods to modulate splicing of UNC13A.

Figures

Fig. 1
Fig. 1. Nuclear depletion of TDP-43 causes CE inclusion in UNC13A RNA and reduced expression of UNC13A protein.
a, Splicing analyses were performed on RNA-sequencing results from TDP-43-positive and TDP-43-negative neuronal nuclei isolated from frontal cortices of seven patients with FTD or FTD–ALS. Some illustrations were created with BioRender.com. b, Sixty-six alternatively spliced genes identified by both MAJIQ (PΨ > 0.1) > 0.95) and LeafCutter (P < 0.05). Genes in blue are previously validated TDP-43 splicing targets,,,. c, f, RT–qPCR confirmed inclusion of CE in UNC13A mRNA upon TDP-43 depletion in SH-SY5Y cells (n = 5 cell culture experiments for each condition; two sided-Welch two-sample t-test; mean ± s.e.m.) (c) and in 3 independent lines of iPSC-MNs (n = 2 independent cell culture experiments, each with 2 technical replicates for each iPSC-MN) (f). RPLP0 was used to normalize RT–qPCR. Three-way ANOVA; mean ± s.e.m. TDP-43 is also known as TARDBP. d, e, g, h, Immunoblotting for UNC13A and TDP-43 protein levels in SH-SY5Y cells (d; quantified in e) and iPSC-MNs (g; quantified in h) treated with scramble (shScramble) or TDP-43 shRNA (n = 3 independent cell culture experiments for each condition). GAPDH served as a loading control. Two-sided Welch two-sample t-test, mean ± s.e.m. Gel source data are shown in Supplementary Fig. 1a, b. Source data
Fig. 2
Fig. 2. UNC13A CE inclusion in human TDP-43 proteinopathies.
a, UNC13A CE expression level is increased in the frontal cortices of patients with FTLD-TDP. GAPDH and RPLP0 were used to normalize the RT–qPCR (two-tailed Mann–Whitney test, mean ± 95% confidence interval). The schematic to the right shows the localization of the primer pair (arrows) used for the RT–qPCR assay. Healthy: n = 27; sporadic FTLD-TDP: n = 34; C9ORF72+ FTLD-TDP: n = 47; GRN+ FTLD-TDP: n = 9. b, UNC13A CE is detected in nearly 50% of frontal cortical tissues and temporal cortical tissues from neuropathologically confirmed FTLD-TDP patients in bulk RNA-sequencing from the NYGC ALS Consortium cohort. CE is absent in tissues from healthy controls and patients with FTLD-FUS, FTLD-TAU or ALS-SOD1. Source data
Fig. 3
Fig. 3. UNC13A cryptic splicing is associated with loss of nuclear TDP-43 in patients with FTD and motor neuron disease.
a, The design of the UNC13A e20/CE BaseScope probe targeting the alternatively spliced UNC13A transcript. Each Z binds to the transcript independently, and both must be in close proximity for successful signal amplification, ensuring binding specificity. b, BaseScope in situ hybridization using the UNC13A e20/CE probe, combined with immunofluorescence for TDP-43 and NeuN, was performed on sections from the medial frontal pole of patients with FTD and motor neuron disease (FTD–MND) and healthy controls. Representative images illustrate the presence of UNC13A CE (arrowheads) in neurons showing depletion of nuclear TDP-43. Neurons with normal nuclear TDP-43 in patients and controls show no CE signal (arrows). Images are maximum intensity projections of a confocal image z-stack. Scale bar, 10 µm. Images representative of six non-overlapping images from each individual. We optimized UNC13A probes on two cases and two controls in three separate experiments, with similar findings.
Fig. 4
Fig. 4. UNC13A risk haplotype associated with ALS or FTD susceptibility potentiates CE inclusion when TDP-43 is dysfunctional.
a, LocusZoom plot showing SNPs associated with ALS or FTD in UNC13A. SNPs are coloured on the basis of levels of linkage equilibrium; SNPs rs12608932 and rs12973192 are in strong linkage disequilibrium (LD). b, There is a higher percentage inclusion of the risk allele (G) at rs12973192 in the UNC13A splice variant (n = 3 biologically independent samples; two-sided paired t-test; mean ± s.e.m.). Quantification in Extended Data Fig. 7c. c, Location of rs56041637 relative to the two known FTD–ALS GWAS hits and UNC13A CE. d, Design of UNC13A CE minigene reporter constructs and location of the primer pair used for RT–PCR. Black (reference alleles) and blue (risk alleles) triangles represent the genetic variants as shown in c. e, Splicing of minigene reporters was assessed in wild-type (WT) and TDP-43−/− HEK 293T cells. In addition to the inclusion of CE (2), some splice variants showed inclusion of one of the other two cryptic splicing products (3 and 4) (Extended Data Figs. 1a–e, 3a, Supplementary Note 2). The risk haplotype-carrying minigene showed an almost complete loss of canonical splicing product (1) and an increase in alternatively spliced products (2, 3 and 4). n = 2 independent cell culture experiments for each condition. f, Top, survival curves of FTLD-TDP patients stratified on the basis of the number of risk haplotypes. Heterozygous (1) and homozygous (2) patients had shorter survival time after disease onset (n = 205, Mayo Clinic Brain Bank; score (log-rank) test, P = 0.004). Dashed lines mark median survival for each genotype. Risk haplotype effect is modelled additively using Cox multivariable analysis adjusted for genetic mutations, sex and age at onset. Bottom, risk table. Summary results of the analysis are shown in Extended Data Fig. 10b. Source data
Extended Data Fig. 1
Extended Data Fig. 1. Splicing analysis using MAJIQ demonstrates inclusion of cryptic exon between exon 20 and exon 21 of UNC13A.
(a, b) Depletion of TDP-43 introduces two alternative 3′ splicing acceptors in the intron 20–21: one is near chr19:17642591(ΔΨ = 0.05246) and the other one is near chr19:17642541(ΔΨ = 0.49267). (c, d) An alternative 5′ splicing donor is also introduced near chr19:17642414 (ΔΨ = 0.7763). See Supplementary Note 2. (a, c) Splice graphs showing the inclusion of the cryptic exon (CE) between exon 20 and exon 21 of UNC13A. (b, d) Violin plots corresponding to (a and c) respectively. Each violin in (b and d) represents the posterior probability distribution of the expected relative inclusion (PSI or Ψ) for the color matching junction in the splice graph. The tails of each violin represent the 10th and 90th percentile. The box represents the interquartile range with the line in the middle indicating the median. The white circles mark the expected PSI (E[Ψ]). The change in the relative inclusion level of each junction between two conditions is referred to as ΔΨ or ΔPSI. (e) The three versions of cryptic exons resulting from the loss of TDP-43. (f) Visualization of RNA-sequencing alignment between exon 20 and exon 21 in UNC13A (hg38). Libraries were generated as described in Fig. 1a. CE, cryptic exon. (g) iCLIP for TDP-43 (from Tollervey et al.) indicates that TDP-43 binds to intron 20–21. The sequence shown is an example of a region in intron 20-21 that is frequently bound by TDP-43 (shown by mapped reads from ERR039843, ERR039845 and ERR039855).
Extended Data Fig. 2
Extended Data Fig. 2. Intron 20-21 of UNC13A is conserved among most primates.
The Primates Multiz Alignment & Conservation track on UCSC genome browser (http://genome.ucsc.edu) includes 30 mammals, 27 of which are primates. (a) Exon 20 and exon 21 of UNC13A is well conserved among mammals. The location of the 128 bp cryptic exon is highlighted in red. However, intron 20-21 (a), the cryptic exon (b), and the splicing acceptor site (highlighted in blue) upstream of the cryptic exon (c) and splicing donor site (highlighted in blue) downstream of the cryptic exon (d) are only conserved in primates.
Extended Data Fig. 3
Extended Data Fig. 3. Depletion of TDP-43 from iPSC derived motor neurons (iPSC-MNs) and iPSC derived neurons (i3Ns) leads to cryptic exon inclusion in UNC13A.
(a) RT-PCR confirmed the expression of the cryptic exon-containing UNC13A splice variant upon TDP-43 depletion in three independent iPSC-MNs (n = 4 independent cell culture experiments for each condition). Gel picture shows results from all 4 experiments performed. In addition to the splice variant containing the 128 bp and 178 bp cryptic exons, we also detected inclusion of the complete intron upstream of the cryptic exon (Fig. 4e, Supplementary Note 2). The 128 bp and 178 bp cryptic exons cannot be distinguished here but they are detected through amplicon sequencing the corresponding band (d). The PCR products represented by each band are marked to the left of each gel. The location of the PCR primer pair used is shown on top of each gel image. (b) The PCR primer pairs spanning the cryptic exon and exon 21 junction confirms cryptic exon inclusion only occurs upon TDP-43 knockdown. For gel source data, see Supplementary Fig. 1c, d. (c) RT-qPCR analyses confirmed the inclusion of UNC13A cryptic exon upon TDP-43 depletion in iPSC derived neurons (i3Ns). TDP-43 was depleted by expressing two different sgRNAs: sgTDP-43-guide1 and sgTDP-43-guide2 in i3Ns stably expressing CRISPR inactivation machinery (CRISPRi). RPLP0 and GAPDH were used to normalize RT-qPCR. (n = 3 independent cell culture experiments for each condition; Ordinary one-way ANOVA with Dunnett’s multiple comparisons test, mean ± s.e.m.). (d) Sashimi plot visualization of the alignment (hg38) of the amplicon (2 × 250 bp) sequencing reads of the sequences amplified using primers (blue) shown in (e). Both the 128 bp and the 178 bp cryptic exons were supported by the sequencing reads. (e) Schematic of the exons amplified by the primers (blue). (f, h) DNA sequence of the 128 bp and 178 bp cryptic exons and their flanking exons. The sequences are color coded according to (e). (g, i) The amino acid sequences correspond to the DNA sequences in (f, h). The asterisks indicate stop codons are encountered. Source data
Extended Data Fig. 4
Extended Data Fig. 4. Validation of additional splicing targets.
(a–f) Depletion of TDP-43 introduces cryptic exons into KALRN mRNA and SYT7 mRNA; In RAPGEF6, TDP-43 depletion leads to a decrease in the usage of the exon AE (for alternative exon) between exon 21 and exon 22 of the isoform ENST0000509018.6. Exon AE does exist in some other isoforms of RAPGEF6, indicating the depletion of TDP-43 could lead to changes in isoform composition. (b, d, f) Violin plots corresponding to (a, c, e), respectively. Each violin in (b, d, f) represents the posterior probability distribution of the expected relative inclusion (PSI or Ψ) for the color matching junction in the splice graph. The tails of each violin represent the 10th and 90th percentile. The box represents the interquartile range with the line in the middle indicating the median. The white circles mark the expected PSI (E[Ψ]). The change in the relative inclusion level of each junction between two conditions is referred to as ΔΨ or ΔPSI. (g–i) RT-qPCR analyses confirmed changes in exon usage upon TDP-43 depletion in iPSC-derived neurons. RPLP0 and GAPDH were used to normalize RT-PCR. (n = 3 independent cell culture experiments for each condition, two sided-Welch Two Sample t-test, mean ± s.e.m.). Source data
Extended Data Fig. 5
Extended Data Fig. 5. UNC13A cryptic exon inclusion is detected in disease relevant tissues of FTLD-TDP, ALS/FTLD, ALS-TDP and ALS/AD patients, and is correlated with phosphorylated TDP-43 levels in frontal cortices of FTLD-TDP patients.
(a) UNC13A cryptic exon expression level is significantly increased in the frontal cortices of patients with FTD and ALS/FTD clinical diagnoses (Mayo Clinic Brain Bank). GAPDH and RPLP0 were used to normalize RT-qPCR (the sample size of each group is listed under the corresponding group; two-tailed Mann-Whitney test, mean ± 95% confidence interval). The schematic on top shows the localization of the primer pair (arrows) used for the RT-qPCR assay. (b) UNC13A splice variants are observed in ALS patients with unconfirmed pathology. ALS-FTLD refers to patients who have concurrent FTD and ALS. ALS patients were categorized based on whether they carry SOD1 mutations (ALS-SOD1 (Fig. 2b) vs. ALS-TDP). ALS-AD refers to ALS patients with suspected Alzheimer’s disease. The diagnoses of these patients (NYGC) are not neuropathologically confirmed. Therefore, it is unclear whether TDP-43 mislocalization is present. (c) UNC13A cryptic exon signal is positively correlated with phosphorylated TDP-43 levels in frontal cortices of FTLD-TDP patients in Mayo Clinic Brain Bank (Spearman’s rho = 0.610, n = 90, p-values were calculated by one-sided t-test). Data points are colored according to patients’ reported genetic mutations. The correlation within each genetic mutation group and the corresponding p-value and sample size is also shown. Source data
Extended Data Fig. 6
Extended Data Fig. 6. UNC13A cryptic splicing is associated with loss of nuclear TDP-43 in patients with FTD and motor neuron disease (MND).
(a) Additional patients and control subjects used in the study (but not shown in Fig. 3), demonstrating UNC13A cryptic splicing. Scale bar equals 10 µm. (b) Quantification of UNC13A cryptic exon BaseScope™ in situ hybridization. Six non-overlapping Z-stack images from layer 2–3 of medial frontal pole were captured, per subject, using a 63X oil objective and flattened into a maximum intensity projection image. Puncta counts per image were derived using the “analyze particle” plugin in ImageJ. Each data point represents the number of UNC13A cryptic exon puncta in a single image. Cryptic exon quantity varies between patients but always exceeds the technical background of the assay, as observed in controls. (n = 6 non-overlapping Z-stack images; Linear mixed model, mean ± s.d.). (c) The design of the UNC13A e20/e21 BaseScope™ probe targeting canonical UNC13A transcript. Each “Z” binds to the transcript independently. Both “Z”s must be in close proximity for successful signal amplification, ensuring binding specificity. (d) Representative images showing expression of UNC13A mRNA in layer 2–3 neurons from the medial frontal pole using the probe shown in (b). UNC13A mRNA expression is restricted to neurons (arrows) and is decreased in cells exhibiting TDP-43 nuclear depletion. Arrowheads represent neurons with loss of nuclear TDP-43 and accompanying cytoplasmic inclusions, and arrows indicate neurons with normal nuclear TDP-43. Images are maximum intensity projections of a confocal image Z-stack. Scale bar equals 10 µm. (e) Quantification of UNC13A mRNA BaseScope™ in situ hybridization. UNC13A mRNA puncta were quantified as described in (b). Each data point represents the number of UNC13A mRNA puncta in a single image. This suggests some variability in UNC13A mRNA levels potentially attributable to technical or biological factors. More importantly, the control UNC13A mRNA levels suggest that failure to detect UNC13A cryptic exons in controls is not due to nonspecific RNA degradation. There is variability of UNC13A mRNA detected per sample but we observe a trend of reduced UNC13A mRNA in patient samples compared to controls. (Linear mixed model, mean ± s.d.). The final BaseScope™ experimental run was performed once involving all the cases and controls. Six non-overlapping images were captured from each individual, and representative images are shown. UNC13A probes were first optimized by testing them on 2 cases and 2 controls in 3 separate pilot experiments, showing similar findings. Source data
Extended Data Fig. 7
Extended Data Fig. 7. Levels of UNC13A cryptic exon inclusion are influenced by the number of risk haplotypes.
(a) Visualization of RNA-Seq alignment between exon 20 and exon 21 of UNC13A. RNA-Seq libraries were generated from TDP-43-negative neuronal nuclei as described in Fig. 1a. (b) Samples that are heterozygous (C/G) or homozygous (G/G) at rs12973192 have higher relative inclusion (Ψ) of the cryptic exon except for SRR8571945. Information about the patients were obtained from Liu et al. . (c) Percentages of C and G alleles in the UNC13A spliced variants in TDP-43 depleted iPSC-MNs and SRR8571950 neuronal nuclei. Exact binomial test was done for each replicate to test whether the observed difference in percentages differ from what was expected if both alleles are equally included in the cryptic exon. (d) rs56041637 and rs62121687 are in strong linkage disequilibrium with both GWAS hits in intron 20-21 of UNC13A (Method). Along the axes of the heatplot are all loci that show variation among the 297 patients from Answer ALS in July 2020. Each tile represents the p-value from the corresponding Chi-Square test. P-value < 0.05 are shown in yellow and others are shown in blue or gray. Red and blue blocks highlight the associations of rs12608932 and rs12973192 with other genetic variants in intron 20-21 respectively. Significant associations common to both are circled in black. (e) The summary results of multiple linear regression modeling the effects of the number of UNC13A risk alleles on the abundance of UNC13A cryptic exon inclusion measured by RT-qPCR. A multivariable model was derived adjusting for phosphorylated TDP-43 levels (pTDP-43), sex, known genetic mutations, disease types, and the age of onset. As shown in Extended Data Fig. 5c, pTDP-43 levels have a strong effect on the abundance of UNC13A cryptic exon inclusion. Normality of residuals is tested by Shapiro-Wilk normality test (p-value = 0.2014). Source data
Extended Data Fig. 8
Extended Data Fig. 8. The impact of variants at rs12973192, rs12608932 and rs56041637 on splicing.
(a) Diagrams showing the design of the UNC13A minigene reporter constructs used to assess the impact of the variants at each locus. The complete design of the reporter construct is shown in Fig. 4d. For clarity, the mCherry and GFP exons that are closest to the promoter (blue in Fig. 4d) are labeled as exon 1, and the downstream exon are labeled as exon 2. REF is the reporter that carries the reference haplotype. M-1 to M-3 carry a single risk variant. M-4 to M-6 carry two risk variants. M-7 carries all three variants, the risk haplotype. (b, c) The locations of the RT-qPCR primer pairs used to detect the inclusion of the cryptic exon (b) and the splicing of EGFP (c, shown in black). (d, e) The expression level of the cryptic exon (d) or the splicing of EGFP (e) in each condition is calculated with reference to the expression level of cryptic exon or the splicing of EGFP from the WT construct in TDP-43-/- HEK-293T cells. The expression of the reporter construct measured using a pair of primers aligned to the second exon of EGFP (c, shown in green) was used to normalize RT-qPCR. The cryptic exon expression levels of each pair of reporters expressed within the same cell line were compared. The splicing of EGFP remained constant across all conditions, verifying equal reporter expression levels and the integrity of the splicing machinery independent of TDP-43. Source data
Extended Data Fig. 9
Extended Data Fig. 9. TDP-43-dependent minigene splicing reporter assay in HEK293T cells and HeLa cells.
(a) Schematic of various TDP-43 overexpression constructs used in HEK293T cells. RRM1&RRM2: RNA recognition motifs 1 & 2; IDR: intrinsically disordered region; adapted from. The RT-qPCR primers (red arrows) for measuring the expression levels of the TDP-43 overexpression constructs are mapped to the second exon of TARDBP. The primer pair can detect all the TDP-43 overexpression constructs, including the endogenous TDP-43. Since the HEK293T TDP-43 knock-out cells do not have TDP-43, using the primers does not interfere with measurement of TDP-43 construct expression levels in TDP-43-/- HEK293T. (b) Expression of full-length TDP-43 rescued the splicing defects in HEK293T. TDP-43 lacking both RRMs (TDP-43 ∆RRMs) exacerbates the splicing defects and TDP-43 lacking the IDR (TDP-43 ∆IDR) has a much weaker rescue effect compared to full length TDP-43. (c) The expression levels of the second exon of TDP-43 across different conditions in HEK293T measured by RT-qPCR. The expression levels differ significantly, possibly due to the autoregulation of TDP-43. Despite the variability, the full length TDP-43 is significantly better at reducing the cryptic exon in UNC13A compared to TDP-43 ∆RRMs and TDP-43 ∆IDR. (n = 4 independent cell culture experiments for each condition in (b, c)). (d) Schematic of the pTB UNC13A minigene construct in HeLa cells. The pTB UNC13A minigene construct containing UNC13A cryptic exon sequence and the flanking sequences upstream (from 50 bp at the of end of intron 19 to the cryptic exon) and downstream (~300 bp intron 20) were expressed using the pTB vector, which we have previously used to study TDP-43 splicing regulation of other TDP-43 targets. (e) Depletion of TDP-43 by siRNA in HeLa cells resulted in inclusion of the cryptic exon, which was rescued by expressing an siRNA-resistant form of TDP-43 (GFP-TDP-43) but not by an RNA-binding deficient mutant TDP-43 (GFP-TDP-43-5FL). (f) RT-qPCR of GFP demonstrating expressions of the constructs are similar across different conditions. (n = 3 independent cell culture experiments in (e, f)). GAPDH and RPLP0 were used to normalize RT-qPCR in (c) and (f). For all RT-PCR analysis, two-way ANOVA with Dunnett’s ’s multiple comparisons test was used for all RT-qPCR analysis, mean ± s.e.m.). Source data
Extended Data Fig. 10
Extended Data Fig. 10. UNC13A risk haplotype is associated with diminished binding affinity of TDP-43 and reduced survival time of FTLD-TDP patients.
(a) Reference vs. risk allele RNA binding assay using electrophoretic mobility shift assay (EMSA). Exponentially increasing concentrations (0–8 μM) of purified TDP-43 were incubated with 1 nM Cy5 labeled RNA substrate for the reference and risk alleles of CE (rs12973192), intron (rs12608932), and repeat sequences (rs56041637) (see Methods). 8 mM values were excluded in plots due to significant aggregation at this concentration. The total bound population was quantified at each TDP-43 condition and used to plot the binding curve and calculate the apparent binding affinity, KD app. Experiments were performed three times for introns and two times for exons and repeats, which produced similar results. For gel source data, see Supplementary Fig. 1g. (b) UNC13A risk haplotype is associated with reduced survival time of FTLD-TDP patients. Summary results of Cox multivariable analysis (adjusted for genetic mutations, sex and age at onset) of an additive model. (c, e) Survival curves of FTLD-TDP patients (n = 205, Mayo Clinic Brain Bank), according to a dominant model (c) and a recessive model (e) and their corresponding risk tables. Summary results of Cox multivariable analysis (adjusted for genetic mutations, sex and age at onset) of a dominant model (d) and a recessive model (f). Both the dominant model (c, d) and the recessive model (e, f) show that the presence of the risk haplotype can reduce the survival of FTLD-TDP patients. Dashed lines mark the median survival for each genotype. Log rank p-values were calculated using Score (logrank) test. (b, d, f) The significance of each factor was calculated by Wald test. Source data

Comment in

References

    1. Neumann M, et al. Ubiquitinated TDP-43 in frontotemporal lobar degeneration and amyotrophic lateral sclerosis. Science. 2006;314:130–133. - PubMed
    1. Ling JP, Pletnikova O, Troncoso JC, Wong PC. TDP-43 repression of nonconserved cryptic exons is compromised in ALS–FTD. Science. 2015;349:650–655. - PMC - PubMed
    1. Melamed Z, et al. Premature polyadenylation-mediated loss of stathmin-2 is a hallmark of TDP-43-dependent neurodegeneration. Nat. Neurosci. 2019;22:180–190. - PMC - PubMed
    1. Klim JR, et al. ALS-implicated protein TDP-43 sustains levels of STMN2, a mediator of motor neuron growth and repair. Nat. Neurosci. 2019;22:167–179. - PMC - PubMed
    1. Van Es MA, et al. Genome-wide association study identifies 19p13.3 (UNC13A) and 9p21.2 as susceptibility loci for sporadic amyotrophic lateral sclerosis. Nat. Genet. 2009;41:1083–1087. - PubMed

MeSH terms

Supplementary concepts