. 2022 Mar;603(7899):131-137.
doi: 10.1038/s41586-022-04436-3. Epub 2022 Feb 23.

TDP-43 loss and ALS-risk SNPs drive mis-splicing and depletion of UNC13A

Collaborators, Affiliations

TDP-43 loss and ALS-risk SNPs drive mis-splicing and depletion of UNC13A

Anna-Leigh Brown et al. Nature. 2022 Mar.

Erratum in

  • Author Correction: TDP-43 loss and ALS-risk SNPs drive mis-splicing and depletion of UNC13A.
    Brown AL, Wilkins OG, Keuss MJ, Kargbo-Hill SE, Zanovello M, Lee WC, Bampton A, Lee FCY, Masino L, Qi YA, Bryce-Smith S, Gatt A, Hallegger M, Fagegaltier D, Phatnani H; NYGC ALS Consortium; Newcombe J, Gustavsson EK, Seddighi S, Reyes JF, Coon SL, Ramos D, Schiavo G, Fisher EMC, Raj T, Secrier M, Lashley T, Ule J, Buratti E, Humphrey J, Ward ME, Fratta P. Brown AL, et al. Nature. 2024 Jul;631(8020):E7. doi: 10.1038/s41586-024-07577-9. Nature. 2024. PMID: 38890465 Free PMC article. No abstract available.

Abstract

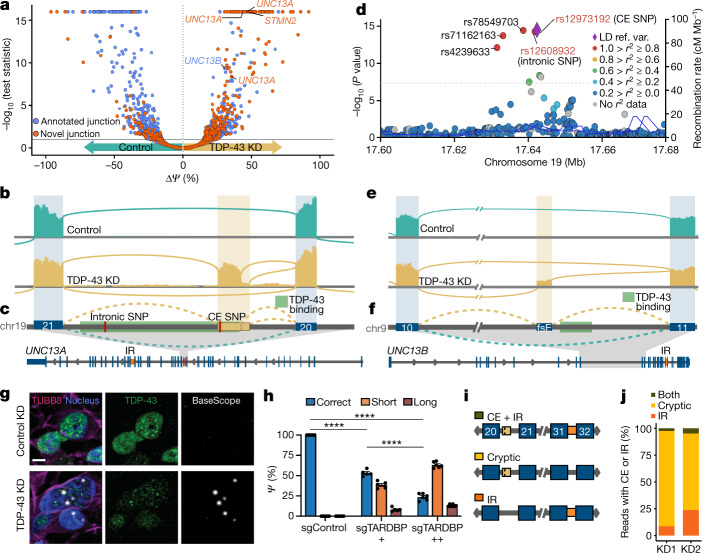
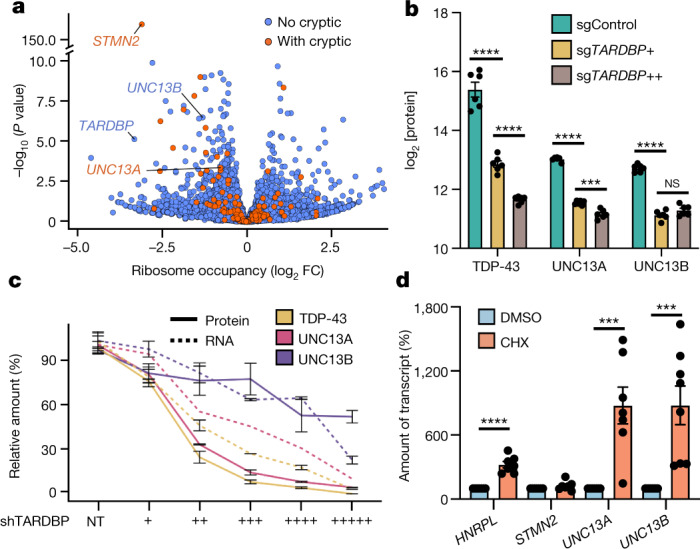
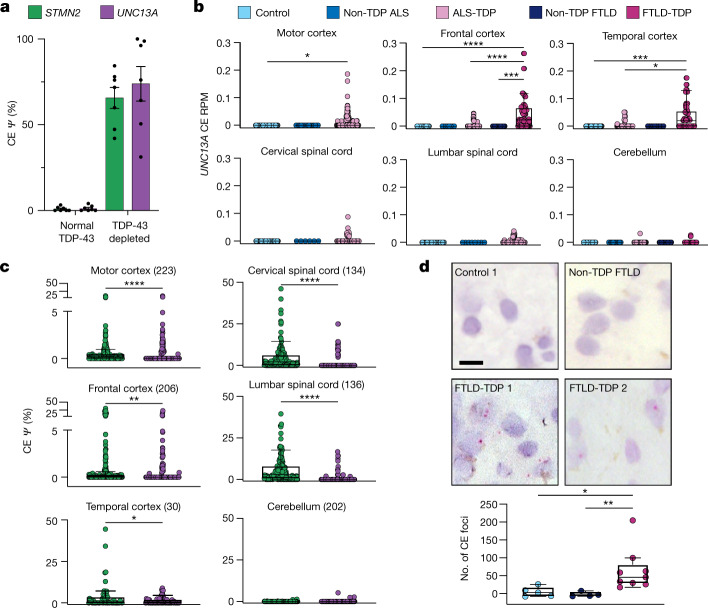
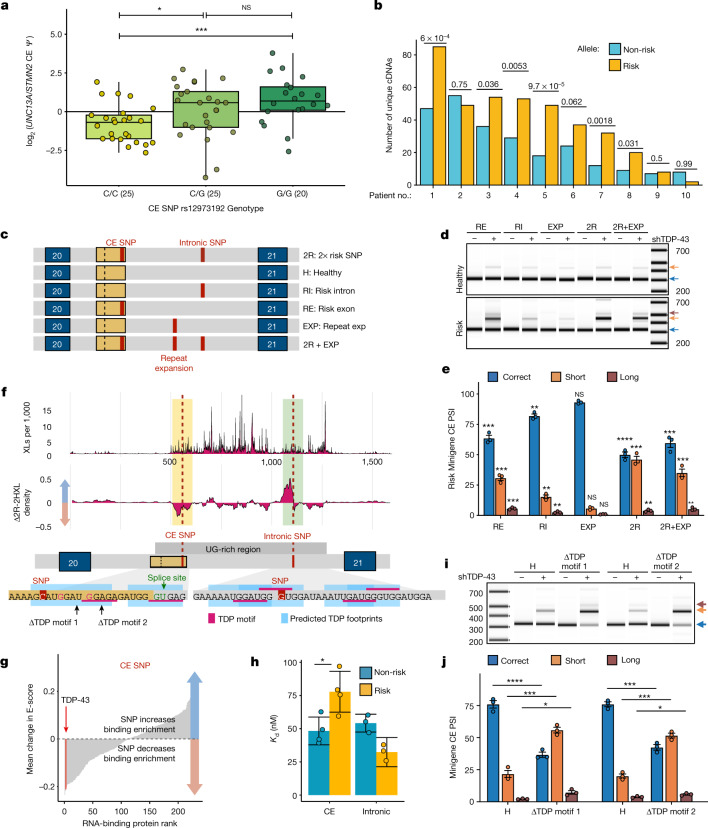
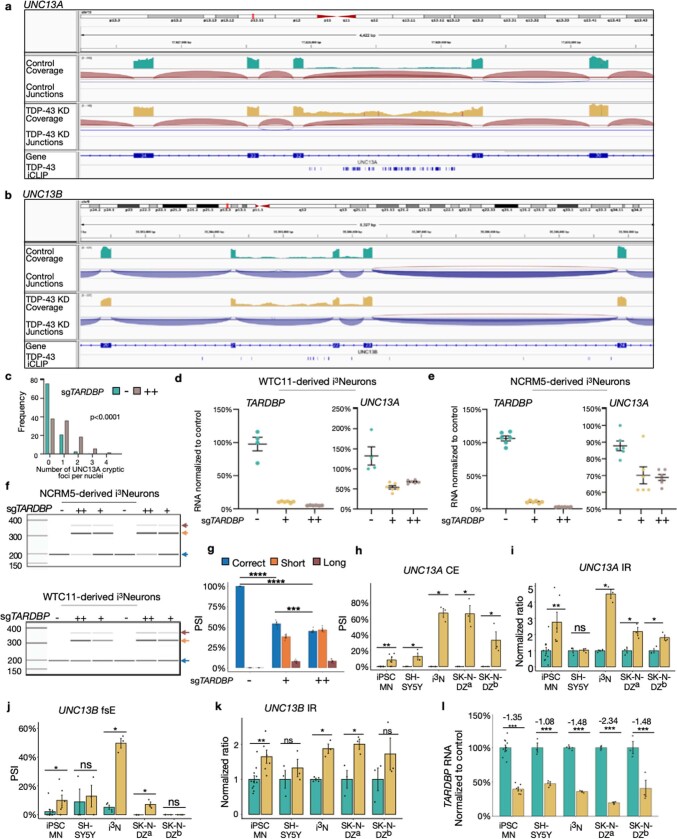
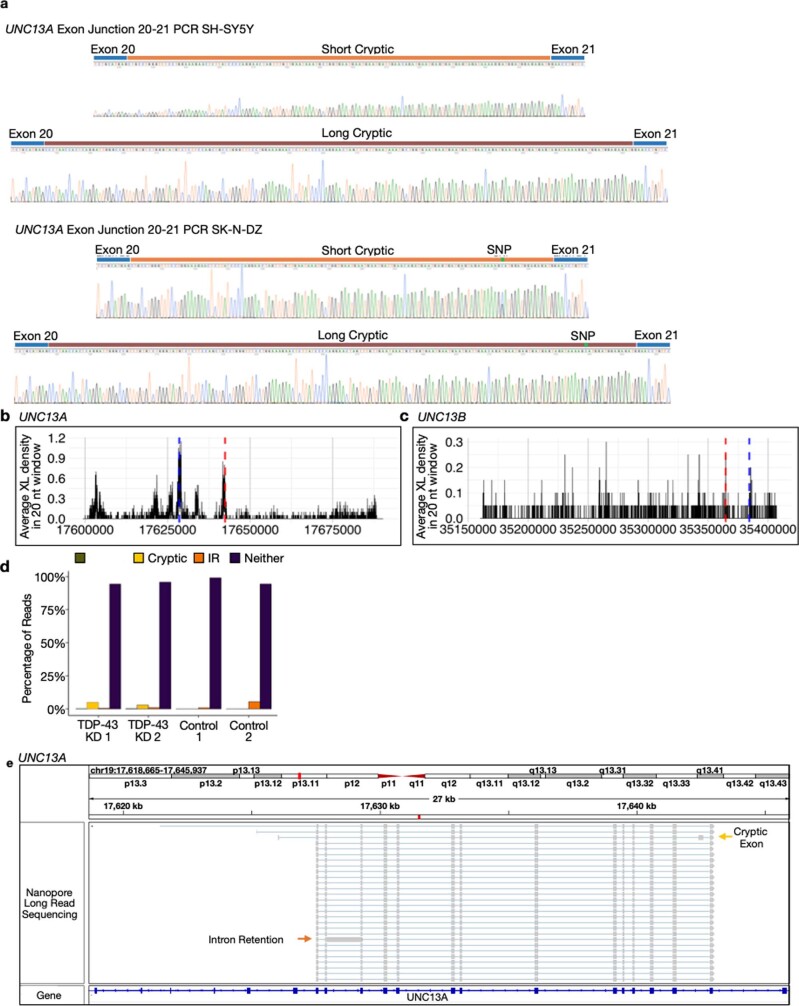
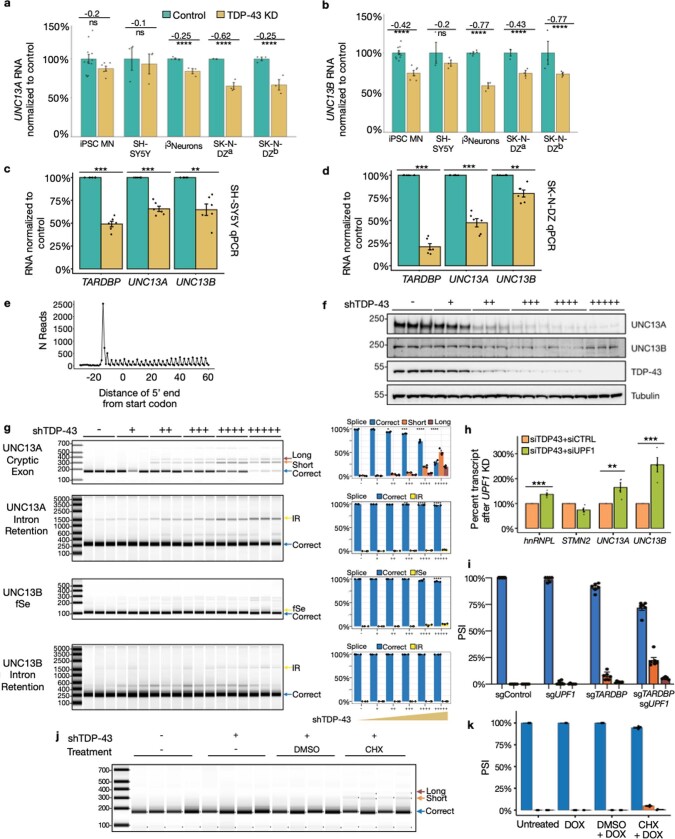
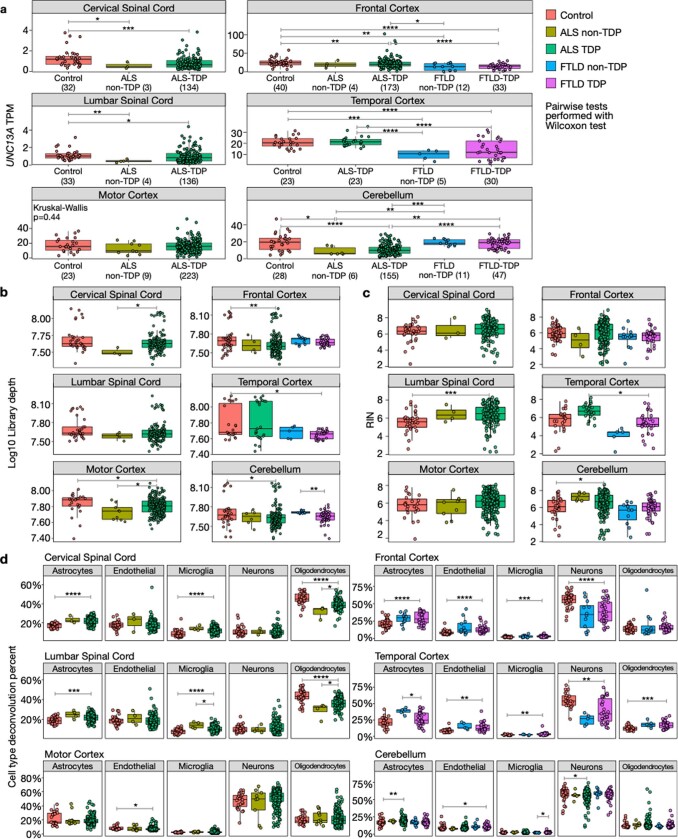
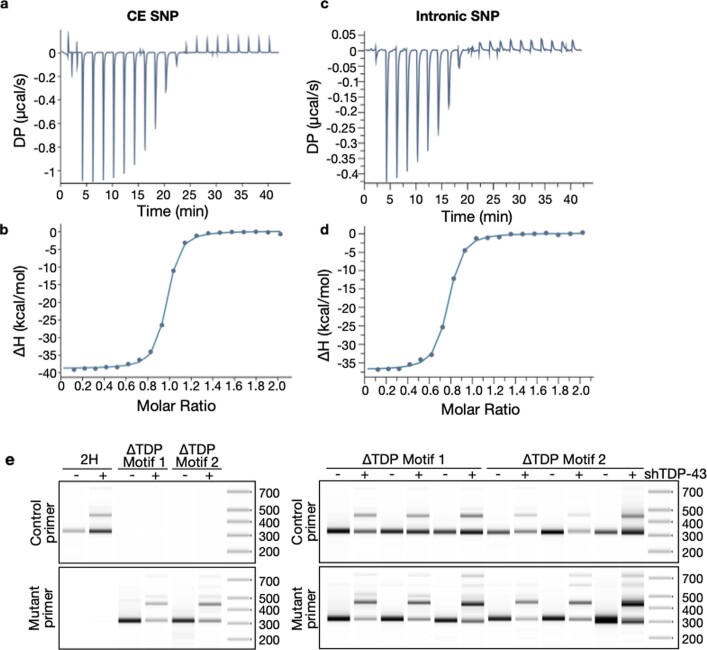
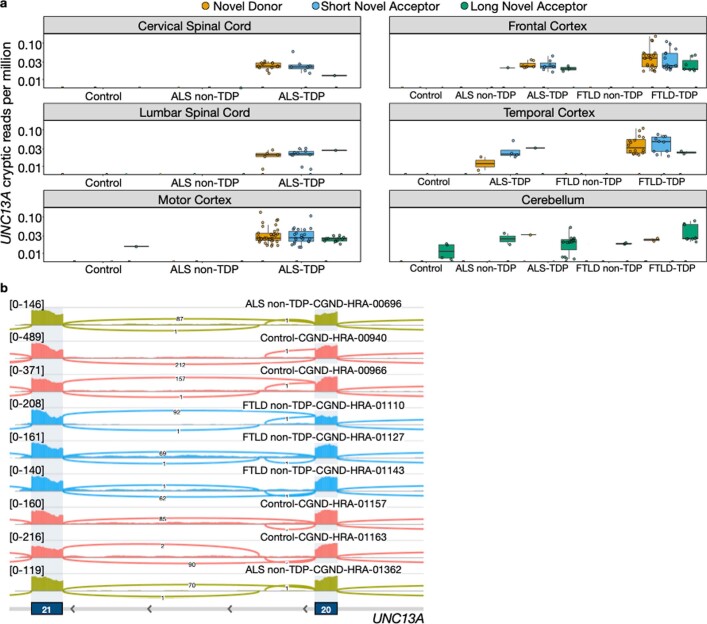
Variants of UNC13A, a critical gene for synapse function, increase the risk of amyotrophic lateral sclerosis and frontotemporal dementia1-3, two related neurodegenerative diseases defined by mislocalization of the RNA-binding protein TDP-434,5. Here we show that TDP-43 depletion induces robust inclusion of a cryptic exon in UNC13A, resulting in nonsense-mediated decay and loss of UNC13A protein. Two common intronic UNC13A polymorphisms strongly associated with amyotrophic lateral sclerosis and frontotemporal dementia risk overlap with TDP-43 binding sites. These polymorphisms potentiate cryptic exon inclusion, both in cultured cells and in brains and spinal cords from patients with these conditions. Our findings, which demonstrate a genetic link between loss of nuclear TDP-43 function and disease, reveal the mechanism by which UNC13A variants exacerbate the effects of decreased TDP-43 function. They further provide a promising therapeutic target for TDP-43 proteinopathies.


Conflict of interest statement

A patent application related to this work has been filed. The technology described in this work has been protected in the patent PCT/EP2021/084908 and UK patent 2117758.9 (patent applicant, UCL Business Ltd and NIH; status pending), in which A.-L.B., O.G.W., M.J.K., S.E.K.-H., M.E.W. and P.F. are named as inventors. The other authors declare no competing interests.

Figures

Fig. 1
Fig. 1. TDP-43 depletion in neurons leads to altered splicing in synaptic genes UNC13A and UNC13B.
a, Differential splicing analysis by MAJIQ in control (n = 4) and CRISPRi TDP-43 depleted (KD) (n = 3) iPS cell-derived cortical-like i3Neurons. Each point denotes a splice junction. b, Representative sashimi plots showing cryptic exon (CE) inclusion between exons 20 and 21 of UNC13A upon TDP-43 knockdown. c, f, Schematics showing intron retention (IR) (orange; bottom), TDP-43 binding region(green), and two ALS- and FTLD-associated SNPs (red) in UNC13A (c) and UNC13B (f). d, LocusZoom plot of the UNC13A locus in the most recent ALS GWAS; the dashed line indicates the risk threshold used in that study. Lead SNP rs12973192 is plotted as a purple diamond, other SNPs are coloured by linkage disequilibrium (LD) with rs12973192 in European individuals from 1000 Genomes. Ref. var., reference variant. e, Representative sashimi plot of UNC13B showing inclusion of the FSE upon TDP-43 knockdown. g, BaseScope detection of UNC13A CE (white puncta) in control (top) and TDP-43-knockdown (bottom) i3Neurons co-stained for TDP-43 (green), neuronal processes (stained for TUBB3, pink) and nuclei (blue). Scale bar, 5 μm. h, Quantification of RT–PCR products using iPS cell-derived neurons made from an independent iPS cell line, NCRM5, with a non-targeting control short guide RNA (sgRNA) (sgTARDBP−), an intermediate TDP-43 knockdown (sgTARDBP+) or stronger TDP-43 knockdown (sgTARDBP++). Data are mean ± s.e.m. sgControl, n = 6; sgTARDBP+, n = 5; sgTARDBP++, n = 6; one-way ANOVA with multiple comparisons. *P < 0.05, **P < 0.01, ***P < 0.001, ****P < 0.0001. i, Schematic of nanopore long reads quantified in j, Extended Data Figs. 2d, e, 5e, f. j, Percentage of targeted UNC13A long reads with TDP-43-regulated splice events that contain CE, intron retention or both in TDP-43-knockdown SH-SY5Y cells. Source data
Fig. 2
Fig. 2. UNC13A and UNC13B are downregulated after TDP-43 knockdown owing to the production of NMD-sensitive transcripts.
a, Ribosome profiling of TDP-43-knockdown i3Neurons shows a reduction in ribosome occupancy of STMN2, UNC13A and UNC13B transcripts. b, Mass spectrometry-based proteomic analysis shows dose-dependent reduction in protein abundance of UNC13A and TDP-43 upon TDP-43 knockdown in i3Neurons. n = 6 biological replicates. Two-sample t-test. c, Protein and RNA quantification of TDP-43, UNC13A and UNC13B in SH-SY5Y with varying levels of doxycycline-inducible TDP-43 knockdown. n = 3 biological replicates. d, Transcript expression upon treatment with CHX suggests that UNC13A and UNC13B, but not STMN2, are sensitive to NMD. HNRNPL is used as a positive control. n = 7 biological replicates (UNC13A, HNRNPL and STMN2) and 8 biological replicates (UNC13B). One-sample t-test. Data are mean ± s.e.m. (bd). Source data
Fig. 3
Fig. 3. UNC13A CE is highly expressed in tissues from patients with ALS or FTLD and correlates with known markers of TDP-43 loss of function.
a, UNC13A and STMN2 CE expression from a published dataset of frontal cortex neuronal nuclei from patients with ALS or FTLD sorted according to TDP-43 expression. b, UNC13A CE expression in bulk RNA-seq from the NYGC ALS Consortium data normalized by library size across disease and tissue samples. ALS cases are stratified by mutation status, FTLD cases are stratified by pathological subtype. c, CE expression throughout ALS-TDP and FTLD-TDP cases across tissue, number of tissue samples in brackets. d, BaseScope detection of UNC13A CE (red foci) in FTLD-TDP (9 individuals) but not control (5 individuals) or non-TDP FTLD (FTLD-TAU) (4 individuals) frontal cortex samples and quantification of background-corrected foci frequency between groups. Scale bar, 10 μm. Data are mean ± s.e.m. (bd); Wilcoxon test. Source data
Fig. 4
Fig. 4. UNC13A ALS and FTD risk variants enhance UNC13A CE splicing in patients and in vitro by altering TDP-43 pre-mRNA binding.
a, Ratio of UNC13A and STMN2 CE Ψ in ALS-TDP and FTLD-TDP cortex, split by genotype for UNC13A risk alleles. In box plots, the centre line shows the median, box edges delineate 25th and 75th percentiles and Tukey whiskers are plotted. b, Unique cDNAs from targeted RNA-seq in ten patients with FTLD-TDP who are heterozygous for the risk SNP within the UNC13A cryptic exon. Single-tailed binomial tests. Patients 1, 5 and 7 carry the C9orf72 hexanucleotide repeat. c, Schematic of UNC13A minigenes containing exon 20, intron 20 and exon 21 and combinations of UNC13A alleles. d, e, Representative image (d) and quantification (e) of RT–PCR products from UNC13A minigenes in SH-SY5Y cells with or without TDP-43 knockdown. Data are mean ± s.e.m. Each variant was compared with the healthy minigene with which it was co-transfected and results were compared with an unpaired t-test (n = 3 biological replicates). f, TDP-43 iCLIP of SH-SY5Y cells containing 2R and 2H minigenes. Top, average crosslink density. Middle, average density change 2R for − 2H (20-nt rolling window, units are crosslinks per 1,000). Bottom, predicted TDP-43 binding footprints (UGNNUG motif). g, Average change in E-value (measure of binding enrichment) across proteins for heptamers containing risk or healthy CE SNP alleles. TDP-43 is indicated in red. h, Binding affinities between TDP-43 and 14-nt RNA containing the CE (n = 4) or intronic (n = 3) healthy or risk sequences measured by isothermal titration calorimetry. Data are mean  ± s.d.; two-sample t-test. i, j, Representative image (i) and quantification (j) of RT–PCR products from UNC13A minigenes with mutated UGNNUG TDP-43 binding motifs as shown in f. Data are mean ± s.e.m.; n = 3 biological replicates; statistical analysis as in (d, e). Source data
Extended Data Fig. 1
Extended Data Fig. 1. UNC13A and UNC13B are misspliced after TDP-43 knockdown across neuronal lines.
(a, b) RNA-seq traces from IGV of representative samples from control (top) and TARDBP KD (bottom) in i3Neurons showing intron retention in UNC13A (A) (mean 4.50 ± 1.50 increased IR in KD) and UNC13B (mean 1.86 ± 0.63 increased IR in KD)(B), overlaid with published TDP-43 iCLIP peaks (c) Histogram showing number of basescope cryptic foci per nuclei in control (blue) and TDP-43 KD (grey) in WTC11-derived i3Neurons, p < 0.0001 unpaired t-test. (d, e) RT-qPCR levels of TARDBP and UNC13A with a non-targeting control sgRNA (sgTARDBP −), an intermediate TDP-43 KD (sgTARDBP +) or a higher TDP-43 KD (sgTARDBP ++) in WTC11-derived (d) and NCRM-5-derived i3Neurons (e). n = 4 biological replicates sgTARDBP − (d), n = 6 biological replicates sgTARDBP − (e), sgTARDBP + (d, e) and ++ (d, e). plotted as means ± SEM. (f) Representative images of UNC13A CE RT-PCR products (g) Quantification of the lower gel in (f) plotted as means ± SEM, n = 6 biological replicates non-targeting control sgRNA (sgTARDBP −), sgTARDBP +, sgTARDBP ++. Upper gel is quantified in Fig. 1h. One-way ANOVA with multiple comparisons. (h–k) Expression of TDP-43 regulated splicing in UNC13A(h, i) and UNC13B(j, k) across neuronal datasets, in control (blue) and TDP-43 KD (yellow). Intron retention (IR)(i, k) and CE and fsE PSI (h, j) significantly increase after TDP-43 depletion in most experiments, Wilcoxon test (l) Relative gene expression levels for TARDBP across neuronal datasets,. Normalized RNA counts are shown as relative to control mean. Numbers show log2 fold change calculated by DESeq2. Significance shown as adjusted p-values from DESeq2. For (h–l) biological replicates are: iPSC MN Ctrl KD n = 12, TDP-43 KD n = 6; i3N Ctrl KD n = 4, TDP-43 KD n = 3; SH-SY5Y, SK-N-BE(2)a, and SK-N-BE(2)b Ctrl KD n = 3, TDP-43 KD n = 3, Significance levels reported as * (p < 0.05) ** (p < 0.01) *** (p < 0.001) **** (p < 0.0001).
Extended Data Fig. 2
Extended Data Fig. 2. Validation of UNC13A and UNC13B misplicing after TDP-43 KD across multiple neuronal cell lines.
Targeted nanopore sequencing reveals UNC13A CE and IR events occur largely independently in-vitro. (a) Sanger sequencing of cryptic bands in both SH-SY5Y and SK-N-BE(2) cells confirm the CE splice junctions. (b, c) Crosslink density across UNC13A (chr19) (b) and UNC13B (chr9) (c) genomic loci from novel iCLIP on endogenous TDP-43 in SH-SHY5Y cells. Crosslink densities for both genes show peaks at the CE/fsE (red) and retained introns (blue). Coordinates shown in hg38. (d) Percentage of all targeted UNC13A long reads in SH-SY5Y cells containing either neither CE nor IR, both, or either CE or IR. Most reads in both control and TDP-43 KD contain neither event, and while IR event is present in controls, CE is only detected in TDP-43 KD. (e) Representative trace in TDP-43 KD of UNC13A targeted long reads showing transcript containing either the CE or IR, and transcripts with neither.
Extended Data Fig. 3
Extended Data Fig. 3. Reduction of UNC13A and UNC13B after TDP-43 knockdown correlates with TDP-43 levels and is caused by nonsense-mediated decay.
Relative gene expression levels for UNC13A (a) and UNC13B (b) after TDP-43 knockdown across neuronal cell lines,. Normalized RNA counts are shown as relative to control mean. Numbers show log fold change calculated by DESeq2. Significance shown as adjusted p-values from DESeq2. Number of replicates as in Extended data Fig. 1 H-L (c, d) RT-qPCR analysis shows TDP-43, UNC13A and UNC13B gene expression is reduced by TARDBP shRNA knockdown in both SH-SY5Y and SK-N-BE(2) human cell lines. Graphs represent the means ± SEM, n = 6 biological replicates, one sample t-test. (e) The 5’ ends of 29 nt reads relative to the annotated start codon from a representative ribosome profiling dataset (TDP-43 KD replicate B). As expected, we detected strong three-nucleotide periodicity, and a strong enrichment of reads across the annotated coding sequence relative to the upstream untranslated region. (f) UNC13A, UNC13B, and TDP-43 protein levels, measured by Western Blot, with varying levels of DOX-inducible TDP-43 knockdown in SH-SY5Y cells. Tubulin is used as endogenous control, n = 3. For gel source data, see Supplementary Figure 1. (g) Quantification of RT-PCR products from the transcripts containing UNC13A CE, UNC13A intron retention, UNC13B fsE, and UNC13B intron retention, with varying levels of DOX-inducible TDP-43 knockdown in SH-SY5Y cells. Graphs represent the means ± SEM n = 3 biological replicates. (h) UPF1 siRNA knock-down led to the rescue of hnRNPL (positive control), UNC13A, and UNC13B transcripts, but not STMN2. Graphs represent the means ± SEM, n = 4 biological replicates, one-sample t-test. (l) UNC13A CE containing-transcript PSI is increased after UPF1 knockdown in i3Neurons. Graphs represent the means ± SEM, n = 6 biological replicates. (j) RT-PCR products from UNC13A in the setting of mild TDP-43 knockdown (“+”, as for Figure 2C and S4G) with the addition of either DMSO (control) or CHX (NMD inhibition). (k) Quantification of (j) Graphs represent the means ± SEM, n = 4 biological replicates. Significance levels reported as * (p < 0.05) ** (p < 0.01) *** (p < 0.001) **** (p < 0.0001).
Extended Data Fig. 4
Extended Data Fig. 4. Sample technical factors in NYGC tissue samples do not vary in a systematic way.
(a) UNC13A expression across tissues and disease subtypes in the NYGC ALS Consortium RNA-seq dataset. Expression normalised as transcripts per million (TPM). Cortical regions have noticeably higher UNC13A expression than the spinal cord. (b) total RNA-seq library size (log10 scaled) (c) RNA integrity score (RIN) (d) Cell type decomposition across NYGC ALS Consortium RNA-seq dataset. While there are differences between tissues and disease-subtypes on these technical factors, specificity of UNC13A CE detection to tissues presumed to contain TDP-43 proteinopathy cannot be explained by these technical factors. Box plots (a–d): boundaries 25–75th percentiles; midline, median; whiskers, Tukey style. Wilcoxon test, significance levels reported as * (p < 0.05) ** (p < 0.01) *** (p < 0.001) **** (p < 0.0001).
Extended Data Fig. 5
Extended Data Fig. 5. Differences in sample technical factors where UNC13A CE was detected and undetected vary between cortical and spinal tissues.
Targeted long reads in FTLD frontal cortex show that UNC13A CE and IR occur independently in-vivo. (a) Detection rate of UNC13A CE across tissues by RNA sequencing platform and read length. UNC13A CE was more likely to be detected in cervical spinal cord and motor cortex when sequenced on machines with 125 bp compared to 100 bp. (b) No significant differences in total RNA-seq library size (log10 scaled). (c) RNA integrity score (RIN) was significantly lower in motor and temporal cortices in samples where UNC13A was detected. (d) Cell type decomposition revealed that samples with UNC13A CE detected had a higher proportion of neurons in cervical and lumbar spinal cord, whereas in frontal, temporal, and motor cortex samples with UNC13A CE detected had a lower proportion of neurons, and in motor and temporal cortex samples with UNC13A CE detected had a higher proportion of astrocytes. Astrocy. - Astrocytes, Endothi. - Endothelial, Microgl. - Microglia. Neur. - Neurons, Oligiodendr. - Oligiodendrycytes. P-values shown are from Fisher’s exact test (a) or Wilcoxon test (b–d). N tissue samples show below in brackets. Box plots (a–d): boundaries 25-75th percentiles; midline, median; whiskers, Tukey style. (e) Percentage of targeted UNC13A long reads with TDP-43 regulated splice events that contain either both, CE, or IR in four in FTLD frontal cortices. (f) Percentage of all targeted UNC13A long reads in (a) containing neither CE nor IR, both, or either CE or IR.
Extended Data Fig. 6
Extended Data Fig. 6. Expression of shorter UNC13B isoform in human neuronal tissue masks detection of UNC13B fsE across NYGC tissue samples.
(a) Expression of splice junction reads supporting the UNC13B fsE across tissues and disease subtypes. Junction counts are normalised by library size in millions (junctions per million). Expression of UNC13B fsE is present across controls and ALS/FTLD-non-TDP tissues. Wilcoxon test, significance levels reported as * (p < 0.05) ** (p < 0.01) *** (p < 0.001) **** (p < 0.0001). (b) Diagram showing three of the UNC13B transcripts, including the APPRIS principal isoform UNC13B-207 (blue), the NMD sensitive isoform UNC13B-208 (green), and the shorter isoform UNC13B-210 which shares the fsE (light green highlight) and one of the splicing junctions supporting the fsE as UNC13B-208. (c) Expression of three UNC13B isoforms across NYGC cohort and in the five in vitro TDP-43 knockdowns experiments,. UNC13B-210 is expressed across in vivo human tissues, whereas there is almost no expression of UNC13B-210 in any of the in vitro experiments. Box plots (a, c): boundaries 25–75th percentiles; midline, median; whiskers, Tukey style.
Extended Data Fig. 7
Extended Data Fig. 7. TDP-43 regulated UNC13A and UNC13B introns are expressed across human neuronal tissues in NYGC tissue samples.
STMN2 CE PSI correlates with TDP-43 regulated cryptics across NYGC RNA-seq dataset. IRratio in UNC13A exon 31−32 (a) and UNC13B exon 21−22 (b) across NYGC tissue samples. UNC13A IR was lower in ALS-TDP cases than in controls in cervical spinal, frontal and motor cortices, and higher in FTLD-TDP cases than controls in frontal and temporal cortices. Possibly this reflects differences in the effects of cell type composition in disease state. Box plots (a, b): boundaries 25–75th percentiles; midline, median; whiskers, Tukey style..Wilcoxon test, significance levels reported as * (p < 0.05) ** (p < 0.01) *** (p < 0.001) **** (p < 0.0001). (c–e) Correlation in ALS/FTLD-TDP cortex between RAP1GAP CE (c), PFKP CE (d), and UNC13A CE (e) with STMN2 CE PSI in patients with at least 30 spliced reads across the CE locus. Spearman’s correlation.
Extended Data Fig. 8
Extended Data Fig. 8. UNC13A risk alleles increase UNC13A CE expression after TDP-43 depletion by altering TDP-43 binding affinity across the UNC13A CE-containing intron.
(a) UNC13A CE PSI by genotype (Wilcoxon test) Box plots: boundaries 25-75th percentiles; midline, median; whiskers, Tukey style. (b) Effect of CE or intronic SNP on the correlation between STMN2 and UNC13A CE PSI in ALS/FTD cortex in samples with at least 30 junction reads across the CE locus. Spearman’s correlation. (c) Raw tapestation gel images of UNC13A CE products in 2H and 2R minigines and quantification of the PCR products. Graphs represent the means ± SEM(n = 3 biological replicates); Two-way ANOVA (d) Raw tapestation gel images corresponding to Fig. 4e. Two sets of primers were used to amplify either control (top row) or mutant minigene (bottom row). Left panel: single transfections were performed to ensure primer specificity. Right panel: three biological replicates of the double transfections. (e) Fractional changes at iCLIP peaks for 2R versus 2H minigene (mean and 75% confidence interval shown). Peaks that are within 50nt of each SNP are highlighted. (f) Mean crosslink density around the exonic (top) and intronic (bottom) SNPs in the 2H (red) and 2R (blue) minigenes, relative to the 5’ end of minigene (error bars = standard deviation; dashed lines show SNP positions). (g, h) Individual TDP-43 E-scores for the CE (g) and intronic (h) heptamers for which there was data (i) Average change in E-value (measure of binding enrichment) across proteins for heptamers containing risk/healthy intronic SNP allele; TDP-43 is indicated in red. Significance levels reported as * (p < 0.05) ** (p < 0.01) *** (p < 0.001) **** (p < 0.0001).
Extended Data Fig. 9
Extended Data Fig. 9. Binding of TDP-43 to SNP-containing intronic RNA.
(a–d) ITC measurement of the interaction of TDP-43 with 14-nt RNA containing the CE SNP (a, b) and intronic SNP (c, d) healthy sequence. A representative data set is reported, with raw data (a, c) and integrated heat plot (b, d). Circles indicate the integrated heat; the curve represents the best fit. (e) Raw Tapestation gel images corresponding to Fig. 4j. For each experiment, two RT-PCRs were performed with a different primer set which either amplified a control minigene (top row; minigene 2H) or a mutant minigene (bottom row). Left: single transfections to ensure specificity of primers for either the control or the mutant minigene. Right: Three replicates of double transfections with control minigene 2H and either mutant minigene.
Extended Data Fig. 10
Extended Data Fig. 10. One of the splice junctions for UNC13A CE overlaps with an unannotated exon expressed in control cerebellum.
(a) Expression of splice junction reads supporting the UNC13A CE across tissues and disease subtypes. Junction counts are normalised by library size in millions (junctions per million). The long novel acceptor junction is expressed across all disease subtypes in the cerebellum. Box plots: boundaries 25–75th percentiles; midline, median; whiskers, Tukey style. (b) Example RNA-seq traces from IGV showing UNC13A cerebellar exon which shares the long novel acceptor junction as the UNC13A CE.

Comment in

References

    1. van Es, M. A. et al. Genome-wide association study identifies 19p13.3 (UNC13A) and 9p21.2 as susceptibility loci for sporadic amyotrophic lateral sclerosis. Nat. Genet.41, 1083–1087 (2009). - PubMed
    1. Pottier, C. et al. Genome-wide analyses as part of the international FTLD-TDP whole-genome sequencing consortium reveals novel disease risk factors and increases support for immune dysfunction in FTLD. Acta Neuropathol.137, 879–899 (2019). - PMC - PubMed
    1. Diekstra, F. P. et al. C9orf72 and UNC13A are shared risk loci for ALS and FTD: a genome-wide meta-analysis. Ann. Neurol.76, 120–133 (2014). - PMC - PubMed
    1. Tan, R. H., Ke, Y. D., Ittner, L. M. & Halliday, G. M. ALS/FTLD: experimental models and reality. Acta Neuropathol.133, 177–196 (2017). - PubMed
    1. Neumann, M. et al. Ubiquitinated TDP-43 in frontotemporal lobar degeneration and amyotrophic lateral sclerosis. Science314, 130–133 (2006). - PubMed

MeSH terms