. 2022 Mar;603(7899):159-165.
doi: 10.1038/s41586-022-04431-8. Epub 2022 Feb 23.

Low-dose metformin targets the lysosomal AMPK pathway through PEN2

Affiliations

Low-dose metformin targets the lysosomal AMPK pathway through PEN2

Teng Ma et al. Nature. 2022 Mar.

Abstract

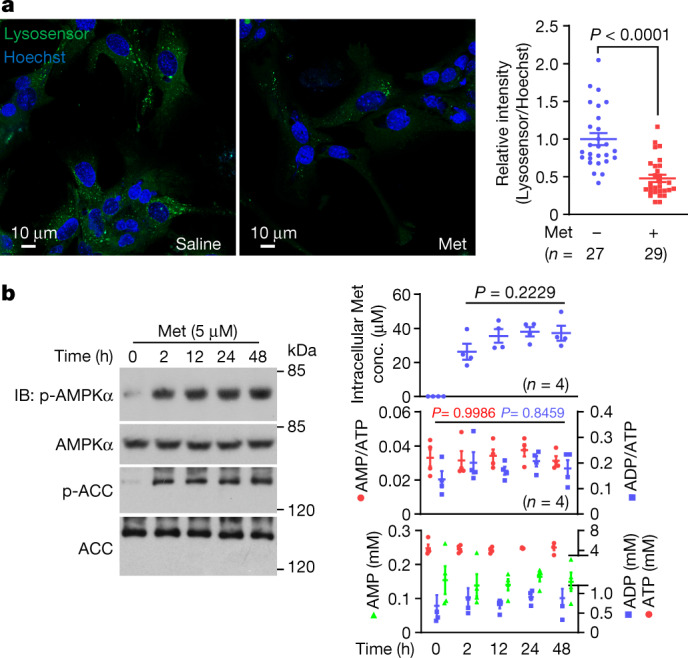
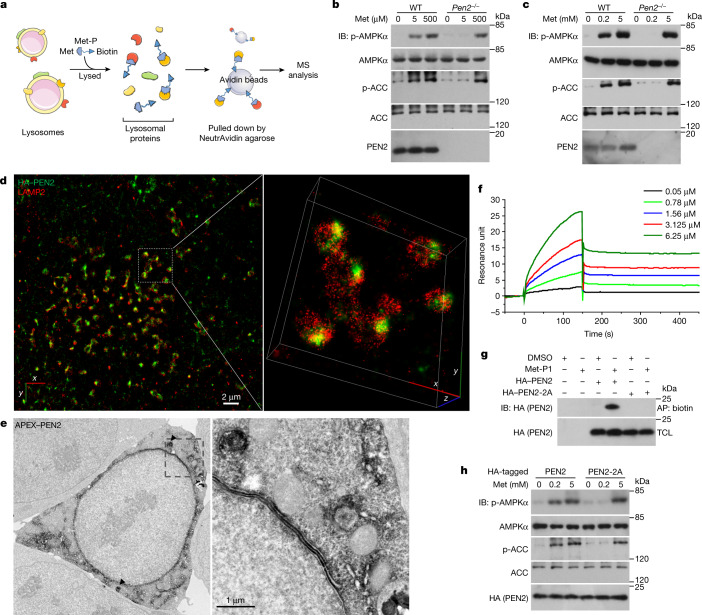
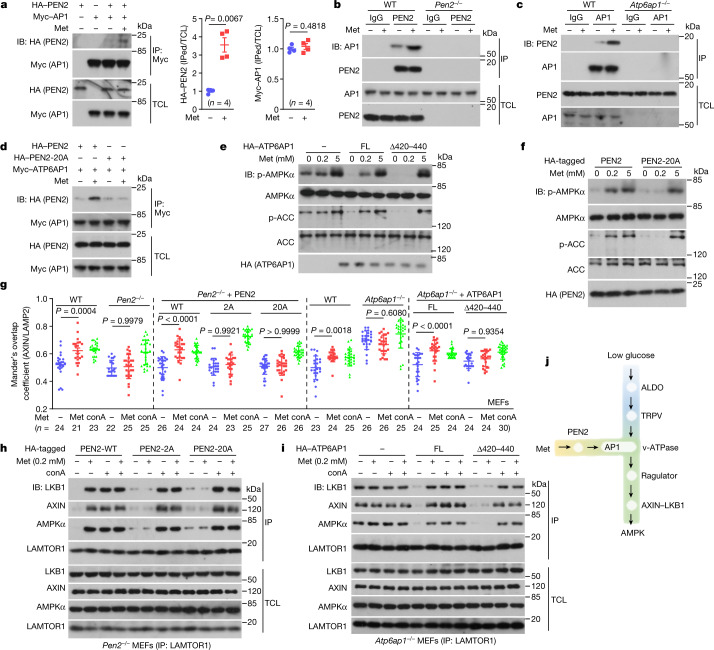
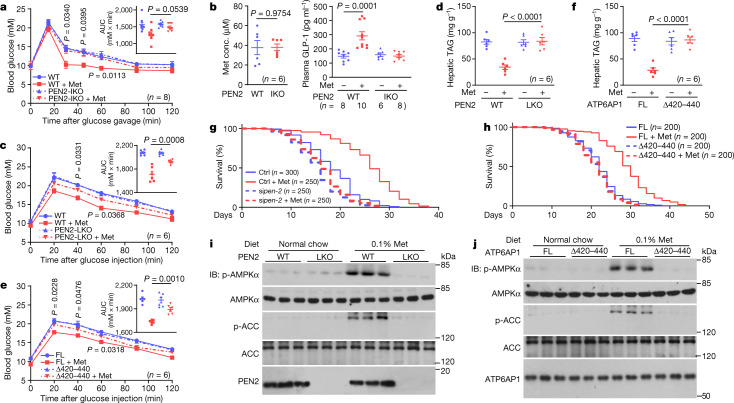
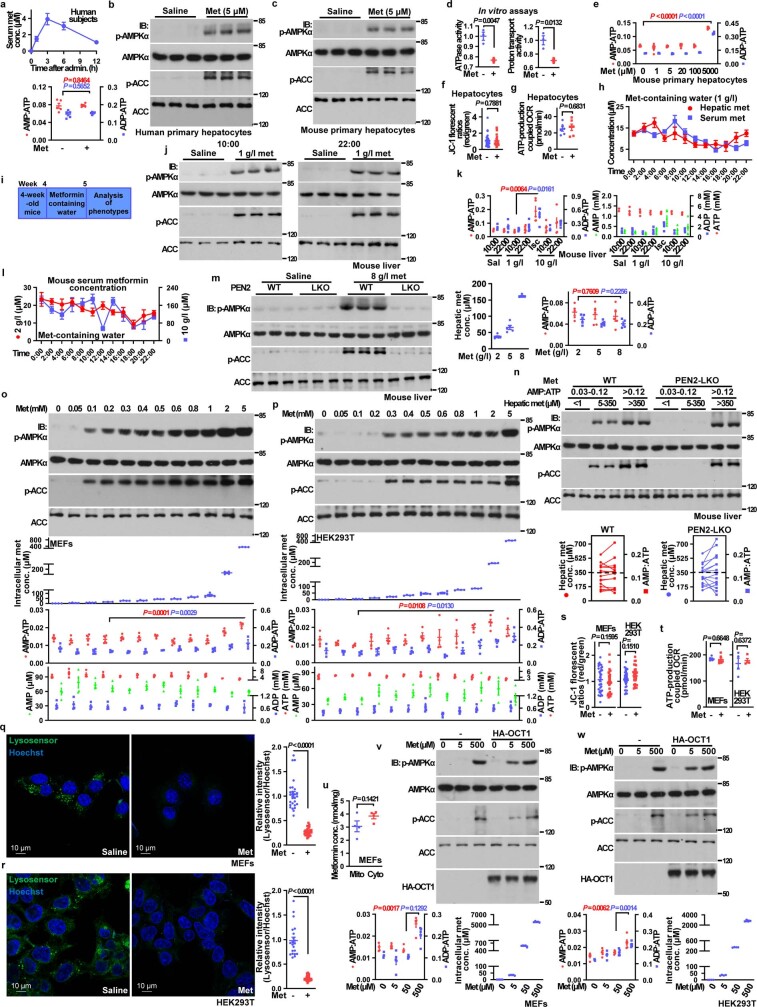
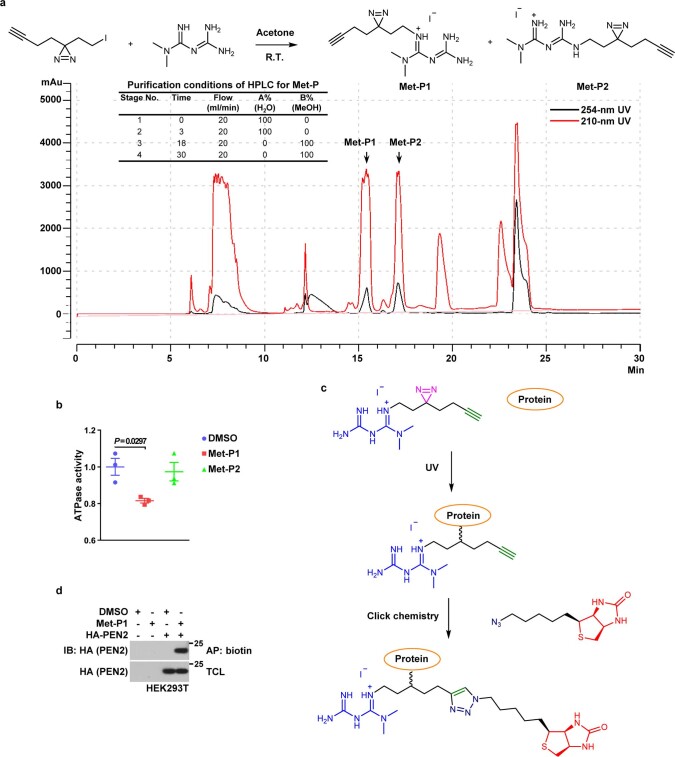
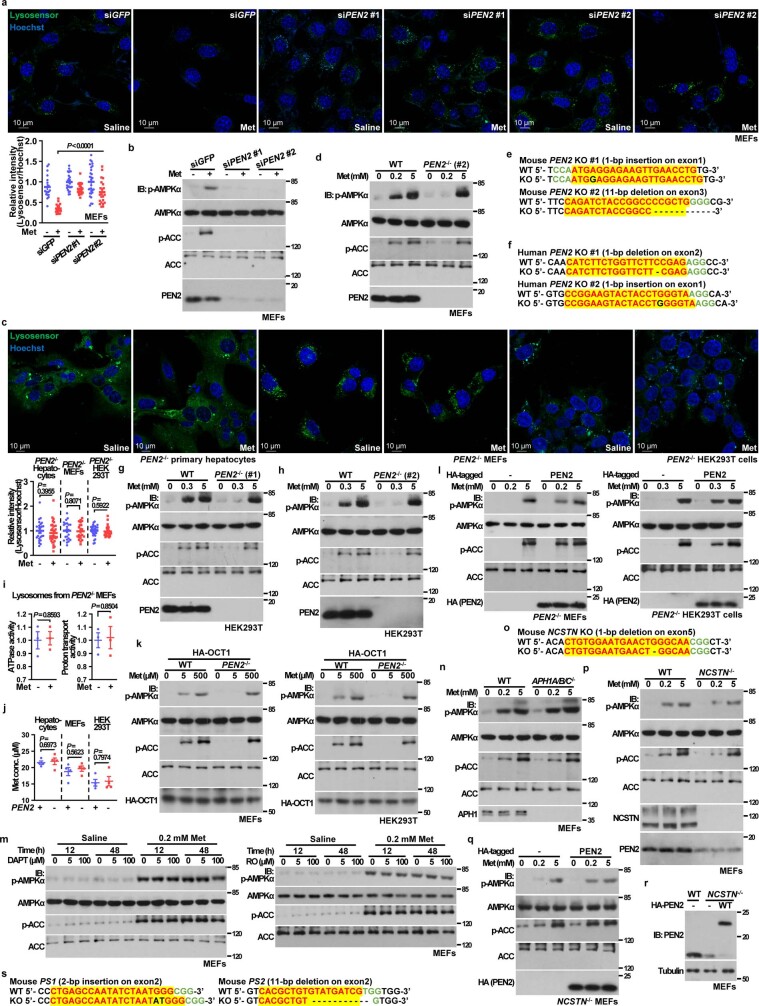
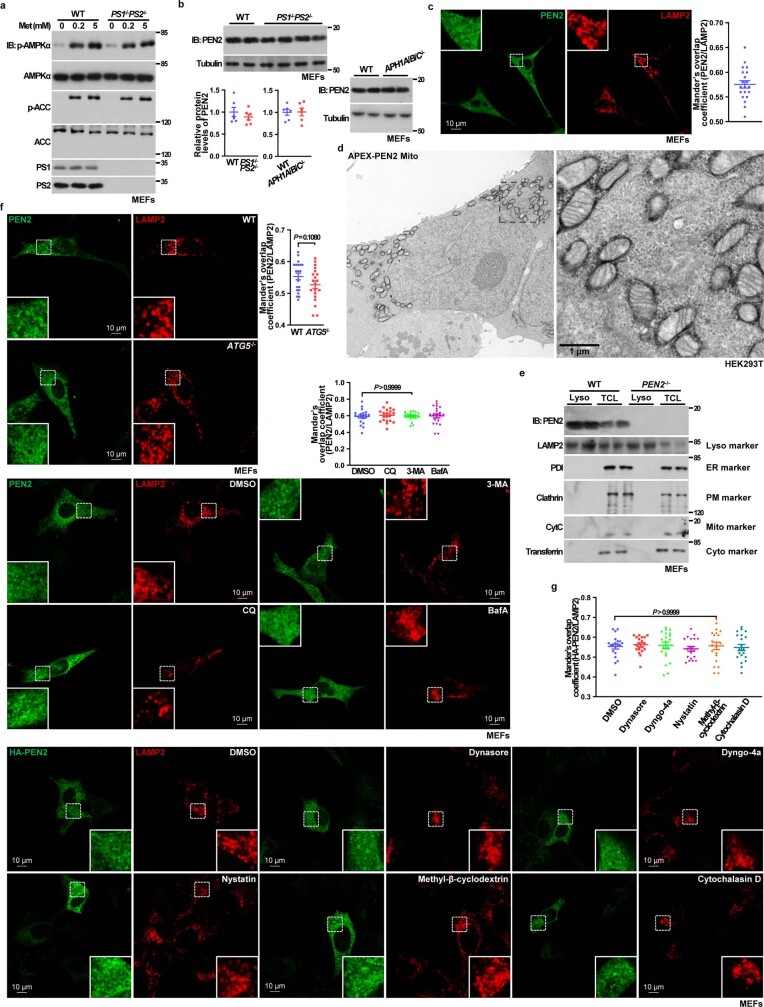
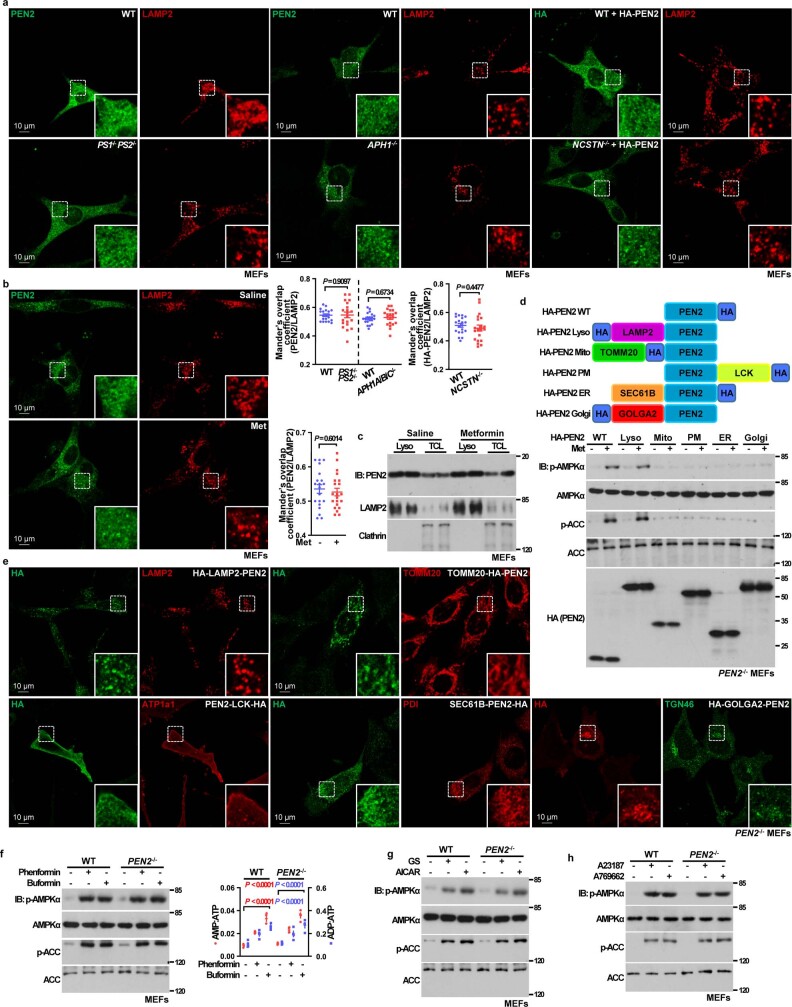
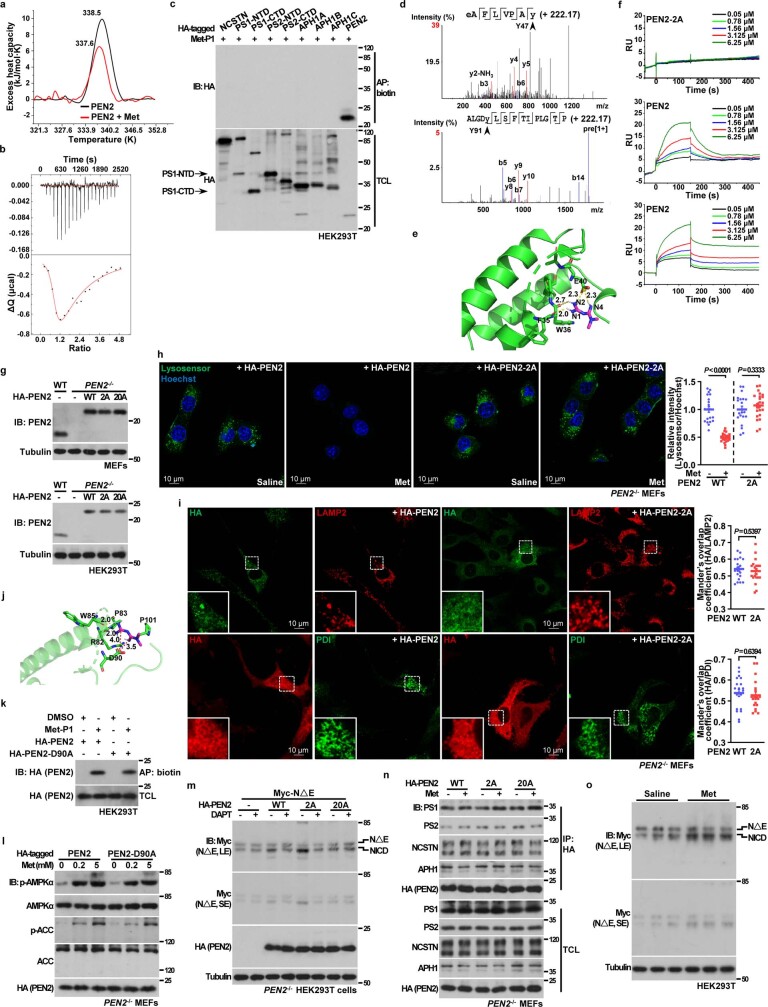
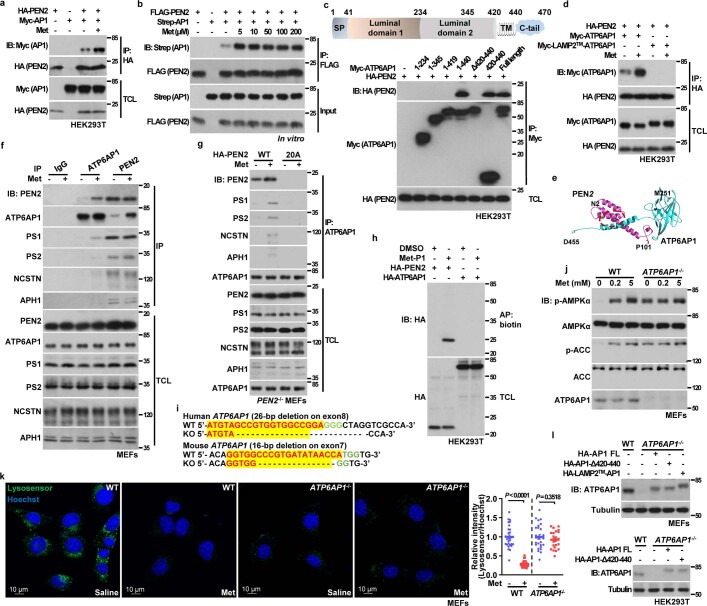
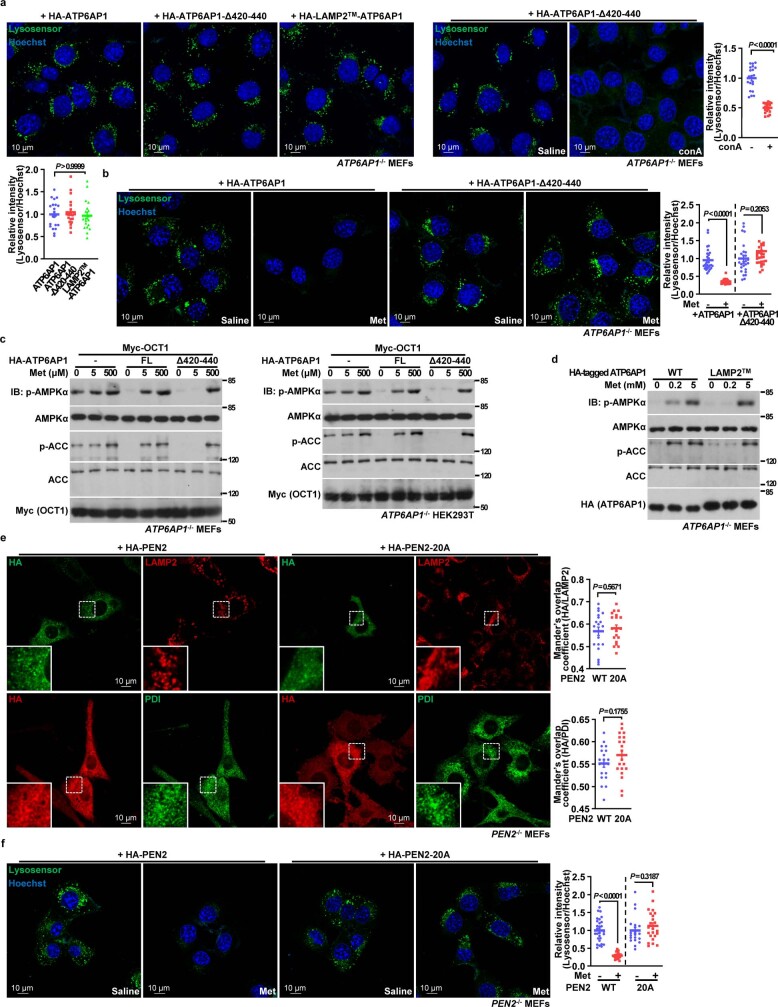
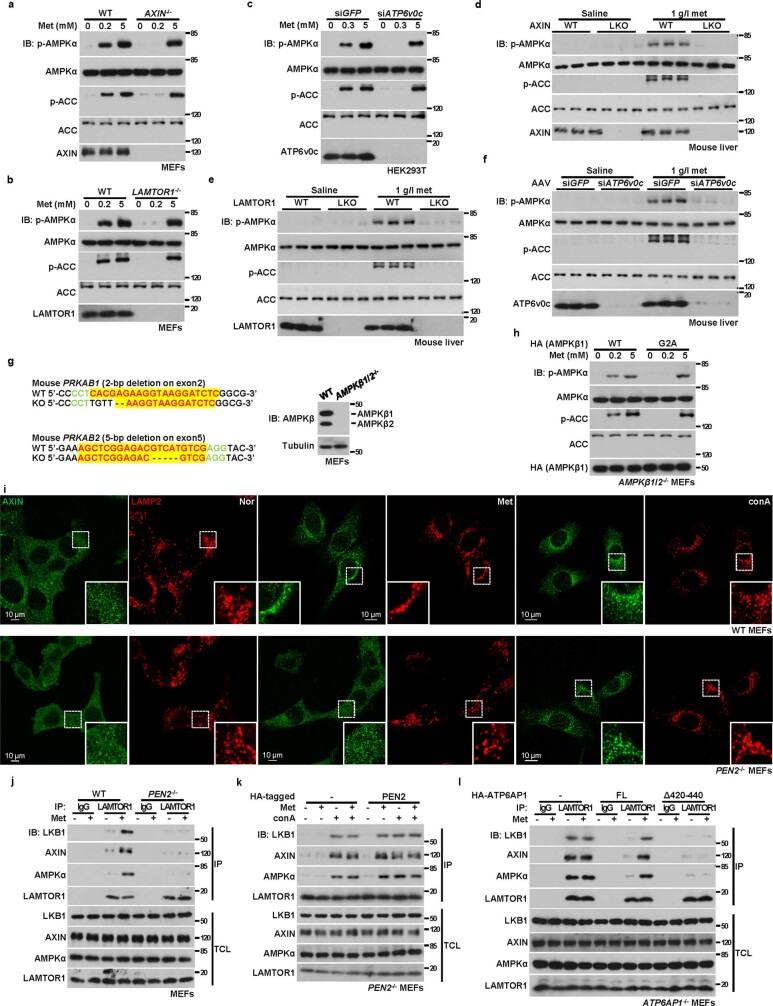
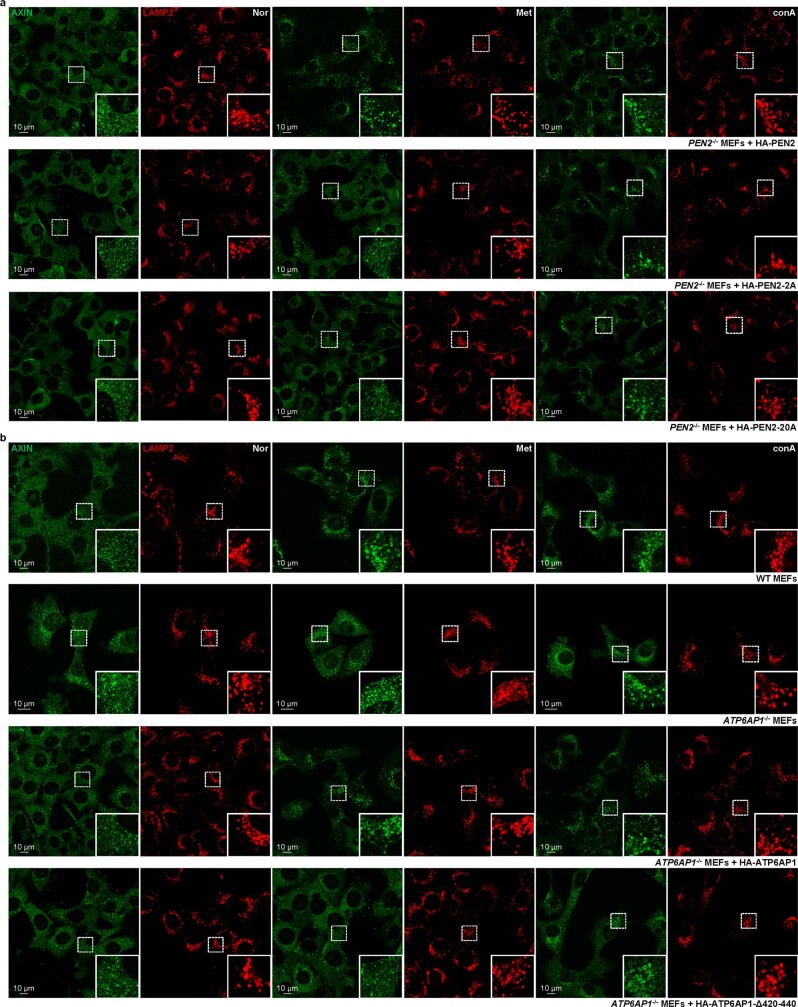
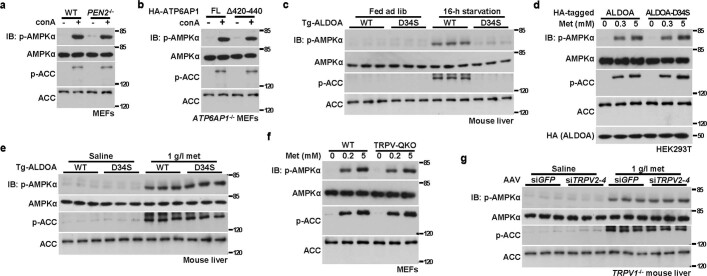
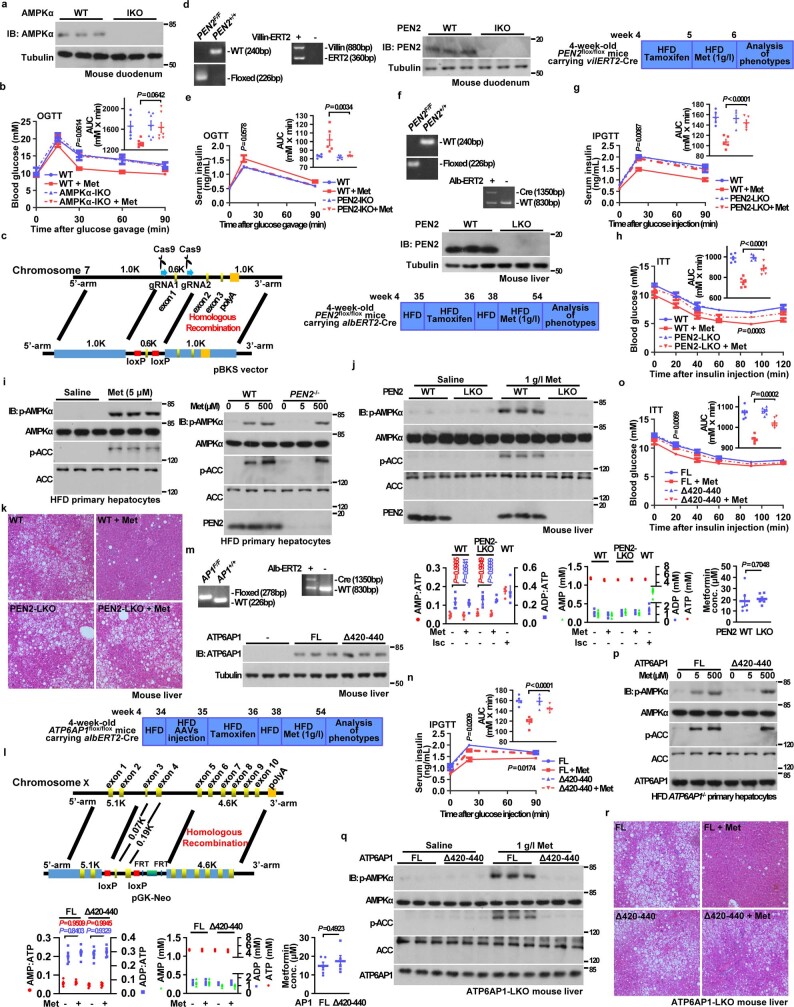
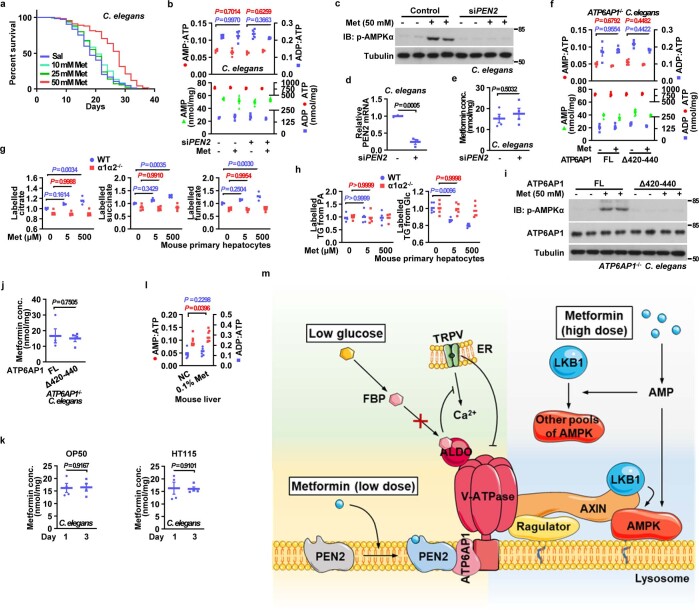
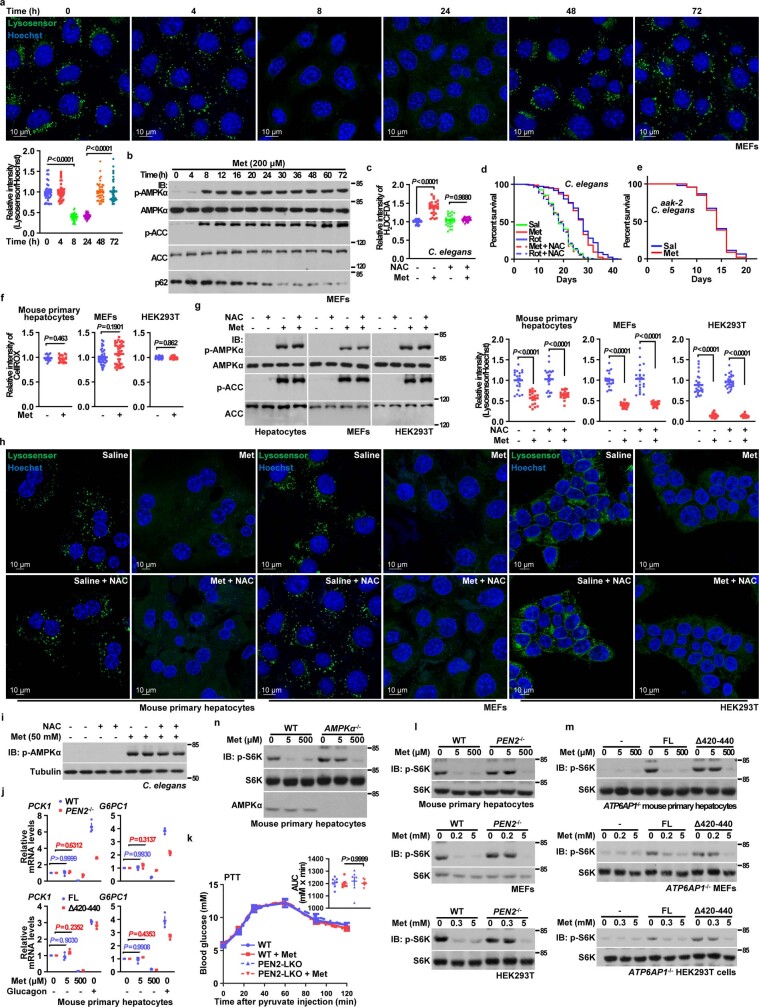
Metformin, the most prescribed antidiabetic medicine, has shown other benefits such as anti-ageing and anticancer effects1-4. For clinical doses of metformin, AMP-activated protein kinase (AMPK) has a major role in its mechanism of action4,5; however, the direct molecular target of metformin remains unknown. Here we show that clinically relevant concentrations of metformin inhibit the lysosomal proton pump v-ATPase, which is a central node for AMPK activation following glucose starvation6. We synthesize a photoactive metformin probe and identify PEN2, a subunit of γ-secretase7, as a binding partner of metformin with a dissociation constant at micromolar levels. Metformin-bound PEN2 forms a complex with ATP6AP1, a subunit of the v-ATPase8, which leads to the inhibition of v-ATPase and the activation of AMPK without effects on cellular AMP levels. Knockout of PEN2 or re-introduction of a PEN2 mutant that does not bind ATP6AP1 blunts AMPK activation. In vivo, liver-specific knockout of Pen2 abolishes metformin-mediated reduction of hepatic fat content, whereas intestine-specific knockout of Pen2 impairs its glucose-lowering effects. Furthermore, knockdown of pen-2 in Caenorhabditis elegans abrogates metformin-induced extension of lifespan. Together, these findings reveal that metformin binds PEN2 and initiates a signalling route that intersects, through ATP6AP1, the lysosomal glucose-sensing pathway for AMPK activation. This ensures that metformin exerts its therapeutic benefits in patients without substantial adverse effects.


Conflict of interest statement

The authors declare no competing interests.

Figures

Fig. 1
Fig. 1. Metformin activates AMPK without increasing AMP/ADP levels.
a, Low-dose metformin deacidifies lysosomes in mouse primary hepatocytes (left). Cells were treated with 5 μM metformin (Met) for 2 h, and the relative fluorescence intensities of Lysosensor are shown (right). b, Metformin does not increase AMP/ADP levels in mouse primary hepatocytes. Cells were treated with 5 μM metformin for the indicated time periods followed by analysis of phosophrylated (p)-AMPKα and p-ACC by immunoblotting (IB; left), AMP/ATP and ADP/ATP ratios, and the absolute concentrations of AMP, ADP and ATP by mass spectrometry (bottom right). After washing three times with PBS, the intracellular metformin concentrations (conc.) were measured by mass spectrometry (top right). For gel source data, see Supplementary Fig. 1. Data are the mean ± s.e.m., n values are labelled on each panel. P values were calculated using two-sided Mann–Whitney test (a) or one-way analysis of variance (ANOVA) followed by Tukey’s (b, bottom right) or Sidak’s test (b, top right). Experiments in a were performed three times and experiments in b were performed five times. Source data.
Fig. 2
Fig. 2. PEN2 binds to metformin and is required for low-dose metformin-induced AMPK activation.
a, A schematic depicting the procedure of the affinity-based approach that used a photoactive metformin probe (Met-P) to identify target(s) of metformin from protein extracts of lysosomes purified from MEFs. MS, mass spectrometry. b, c, Knockout of Pen2 blocks the activation of AMPK by low-dose metformin. Mouse primary hepatocytes (b) and MEFs (c; clone 1, and same hereafter, unless stated otherwise) were treated with 5 μM and 200 μM metformin for 2 h and 12 h, respectively, followed by analysis of p-AMPKα and p-ACC. WT, wild type. d, e, STORM image of MEFs (d) and TEM image of HEK293T cells (e) showing that a portion of PEN2 is localized to the lysosome (e, black arrowheads) and overlaps with the lysosome marker LAMP2 (d). f, g, PEN2 is able to bind metformin. f, In SPR assays, PEN2 was incubated with metformin at the indicated concentrations. g, In Met-P1-binding assays, HEK293T cells transfected with PEN2 or PEN2-2A were lysed, incubated with 10 μM Met-P1 and then biotinylated, and then affinity pull-down (AP) of biotinylated proteins was performed. TCL, total cell lysate. h, PEN2-2A does not mediate AMPK activation by metformin. Pen2–/– MEFs re-introduced with haemagglutinin (HA)-tagged PEN2-2A were treated with 200 μM metformin for 12 h, followed by analysis of p-AMPKα and p-ACC. For gel source data, see Supplementary Fig. 1. Experiments in this figure were performed three times, except those in b and c, which were performed four times.
Fig. 3
Fig. 3. ATP6AP1 tethers PEN2 to v-ATPase for AMPK activation.
ac, Identification of ATP6AP1 as an interacting protein of PEN2. Lysates of HEK293T cells expressing HA–PEN2 or Myc–ATP6AP1 (a), and lysates from wild-type MEFs, Pen2–/– MEFs (b) or Atp6ap1–/– MEFs (c) were incubated with 10 μM metformin and immunoprecipitated (IP) for the PEN2 and AP1 proteins. d, Metformin does not promote the interaction between ATP6AP1 and PEN2-20A. HEK293T cells transfected with HA-tagged PEN2 or PEN2-20A were lysed and treated as in a. The interaction between ATP6AP1 and PEN2 was analysed by IP followed by IB. e–i, Loss of the PEN2–ATP6AP1 interaction abolishes the effects of metformin on AMPK activation. Atp6ap1–/– MEFs re-introduced with ATP6AP1Δ420–440 (e) or Pen2–/– MEFs re-introduced with the PEN2-20A mutant (f) were treated with 200 μM metformin for 12 h followed by analysis of p-AMPK and p-ACC. gi, The effects of ATP6AP1 and PEN2 mutants on the lysosomal translocation of AXIN (g), and the formation of the AXIN-based complex (h, i) were analysed. Concanamycin A (conA; 5 μM for 2 h) was used as a control. FL, full length. j, A schematic depicting that the metformin–PEN2–ATP6AP1 and the FBP–aldolase axes constitute two incoming shunts that converge at v-ATPase to elicit AMPK activation through the lysosomal pathway. For gel source data, see Supplementary Fig. 1. Data are the mean ± s.e.m., n values are labelled on each panel, and P values were calculated using two-sided Student’s t-test (a, for Myc–ATP6AP1), two-sided Student’s t-test with Welch’s correction (a, for HA–PEN2) or two-way ANOVA, followed by Tukey’s test (g). Experiments in this figure were performed three times, except for a (four times), and h and i (five times). Source data
Fig. 4
Fig. 4. PEN2 and ATP6AP1 are required for the biological effects of metformin.
a, b, Intestinal PEN2 is required for the metformin-induced glucose-lowering effect. PEN2-IKO mice were administered with metformin as depicted in Extended Data Fig. 12d. Oral glucose tolerance test analysis (a), measurements of duodenal metformin concentrations (b, left) and measurements of plasma GLP-1 levels before and after 15 min of glucose gavaging (b, right) were then performed. c, d, PEN2 is required for metformin-induced reduction in hepatic fat. Mice in which Pen2 was specifically knocked out in the liver (LKO) were treated with metformin as depicted in Extended Data Fig. 12f. Intraperitoneal glucose tolerance test results (c) and hepatic TAG levels (d) in mice after 16 weeks of treatment of metformin are shown. e, f, ATP6AP1 is required for metformin-induced reduction in hepatic fat. Mice were treated as depicted in Extended Data Fig. 12m. Intraperitoneal glucose tolerance test results (e) and hepatic TAG levels (f) in mice after 16 weeks of treatment of metformin are shown. g, h, PEN2 and ATP6AP1 are required for metformin-induced lifespan extension in C. elegans. WT (N2) nematodes with pen-2 (T28D6.9) knocked down using siRNA (sipen-2) (g) or ATP6AP1–/– (vha-19) nematodes with full-length ATP6AP1 or ATP6AP1Δ420–440 stably expressed (h) were treated with 50 mM metformin. Lifespan data are shown as Kaplan–Meier curves (statistical analyses are provided in Supplementary Table 3). Ctrl, control. i, j, PEN2 and ATP6AP1 are required for AMPK activation induced by 0.1% metformin in the diet. The 5-week-old PEN2-LKO mice (i; tamoxifen was injected at 4 weeks old) or 8-week-old ATP6AP1-LKO mice expressing ATP6AP1Δ420–440 (j; viruses injected at 4 weeks old, and tamoxifen was injected at 5 weeks old), were fed with normal chow diet containing 0.1% metformin for 1 week, as previously described. Hepatic AMPK activation was then analysed by IB. For gel source data, see Supplementary Fig. 1. Data are shown as the mean ± s.e.m., n values are labelled on each panel, and P values were calculated using two-way repeated-measures ANOVA followed by Tukey’s test (a, c and e compared blood glucose between the WT/ATP6AP1-FL + Met group and the PEN2-IKO/LKO/ATP6AP1Δ420–440 + Met group at each time point; see also insets of a, c and e for area under the receiver operator characteristic curve (AUC) values, and P values by two-way ANOVA, followed by Tukey’s test), two-sided Student’s t-test (b, left), and two-way ANOVA, followed by Tukey’s test (right panel of b, and d, f). Experiments in this figure were performed three times. Source data
Extended Data Fig. 1
Extended Data Fig. 1. Low metformin can activate AMPK without altering energy levels.
a, Serum metformin concentrations in human subjects. Serum samples were collected at indicated time points from subjects after taking 0.5 g of Metformin Hydrochloride Extended-release Tablets. Data are shown as mean ± s.e.m.; n = 6. b, c, e, Low metformin activates AMPK in primary hepatocytes without elevating AMP. Human (b) or mouse (c, e) primary hepatocytes were treated with metformin (Met), or PBS (Saline) for 2 h, and the levels of p-AMPKα and p-ACC (b, c), as well as the AMP:ATP and ADP:ATP ratios (b, e) were determined [shown as mean ± s.e.m.; n = 5 (b) or 4 (e) cells for each condition, and P value by two-sided Student’s t-test (b), or one-way ANOVA followed by Sidak (e)]. d, Metformin inhibits v-ATPase in purified lysosomes. Lysosomes purified from mouse livers were incubated with 5 μM metformin for 1 h. The activity of v-ATPase was determined by the rates to hydrolyse ATP (left panel) and to transport protons (right panel). Data are shown as mean ± s.e.m.; n = 3; P value by two-sided Student’s t-test. f, s, Low metformin does not affect mitochondrial membrane potential. Mouse primary hepatocytes (f), MEFs (s, left panel), or HEK293T cells (s, right panel) were treated with 5 μM metformin for 2 h (f), 200 μM metformin for 12 h (s, left panel) or 300 μM metformin for 12 h (s, right panel) (higher concentrations and longer treatment times were used in MEFs and HEK293T cells because of lack of OCTs), and were loaded with JC-1 dye for another 30 min. After normalisation to the group without metformin treatment, the data are shown as mean ± s.e.m.; n = 37 (control) and 34 (metformin-treated) with mouse primary hepatocytes, n = 36 (control) and 40 (metformin-treated) for MEFs, and n = 35 (control) and 36 (metformin-treated) with HEK293T cells; and P value by two-sided Mann-Whitney (f and s, left panel) or two-sided Student’s t-test (s, right panel). g, t, Low metformin does not affect mitochondrial respiration. Mouse primary hepatocytes (g, approximately 3,000 cells in total), MEFs (t, left panel, approximately 10,000 cells in total), or HEK293T cells (t, right panel, approximately 10,000 cells in total) were treated as in f, left panel of s, and right panel of s. ATP production-coupled OCR was determined by subtracting basal OCR from that treated with 10 μM oligomycin. Data are mean ± s.e.m.; n = 6 with hepatocytes and MEFs, and n = 4 with HEK293T cells; and P value by two-sided Student’s t-test. h, i, l, Mice taking 1 g/l metformin from drinking water resembles the situation of human patients taking standard clinical doses of metformin. As depicted in i, mice at 4-week old were treated with metformin in drinking water for 7 days. At day 8, mice were sacrificed at indicated times of the day. The mice were then divided into two groups, one for sacrifice to collect serum, and the others for the liver tissue. Results are mean ± s.e.m.; n = 5 for each time point, except n = 4 for the 2 g/l group at 0:00, 4:00 and 18:00. Note that perhaps owing to the bitterness of metformin at higher doses (10 g/l), some of the mice showed a decreased water intake (hence metformin), and larger variations of the serum metformin concentrations than those of 1 g/l and 2 g/l were observed. j, k, m, n, High doses of metformin leads to increased AMP/ADP levels, and bypasses the requirement of PEN2 for AMPK activation. Mice were treated as in i, followed by analysis of p-AMPKα and p-ACC (j, m, n) and hepatic AMP:ATP and ADP:ATP ratios, the absolute concentrations of AMP, ADP and ATP, and the hepatic metformin concentrations. Results are mean ± s.e.m.; n = 5 (k, m) and n = 16 (n) for each treatment, and P value by one-way ANOVA followed by Dunn (k) or Tukey (m). Isc; hepatic ischemia (for 5 sec). Note that in m, n, readouts were determined in the liver from the mice that did not undergo the step of blood draining (different from h), because ischemia will increase AMP and ADP, and will cause AMPK activation unrelated to the lysosomal pathway. The legitimacy for skipping the step of blood draining was based on the observation that hepatic metformin concentration is similar to that in the serum in our animal setting, as shown in h - the residual blood would not significantly interfere with the readout of the hepatic metformin concentration. o, p, v, w, AMPK can be activated in MEFs and HEK293T cells in AMP/ADP-independent manner in low metformin. MEFs (o), HEK293T cells (p), and the OCT1-expressing MEFs (v) and HEK293T cells (w) were treated with metformin at indicated concentrations for 12 h (o, p) or 2 h (v, w), followed by analysis of intracellular metformin concentrations [shown as mean ± s.e.m.; n = 4 (for each metformin concentration in o, p and w, except n = 3 for the 0.2 mM metformin in o and p) or 5 (v)], p-AMPKα and p-ACC, and AMP:ATP, and ADP:ATP ratios [shown as mean ± s.e.m.; n = 4 (for each metformin concentration in o and p, except n = 3 for the ratios at 5 mM metformin in o) or 5 (v, w); and P values by one-way ANOVA, followed by Sidak (o, and AMP:ATP of p), Tukey (ADP:ATP of p, and w), or Dunn (v)], as well as the absolute concentrations of AMP, ADP and ATP. q, r, Low metformin deacidifies lysosomes. MEFs (q) and HEK293T cells (r) pre-labelled with LysoSensor Green DND-189 and Hoechst were treated as in s. Representative images are shown (left panel); the relative fluorescent intensities of Lysosensor (normalised to the intensity of Hoechst) are shown on the right. Results are mean ± s.e.m.; n = 28 (control) and 27 (metformin-treated) from 3 dishes/experiments for MEFs, and n = 21 (control) and 20 (metformin-treated) from 3 dishes/experiments for HEK293T cells; and P value by two-sided Mann-Whitney test. u, Metformin is not accumulated in mitochondria. MEFs were treated as in s, and metformin concentrations in mitochondria and cytosol fractions (normalised to protein concentration) are shown as mean ± s.e.m.; n = 4, and P value by two-sided Student’s t-test. Experiments in this figure were performed three times, except c, h, j, k and o four times. Source data
Extended Data Fig. 2
Extended Data Fig. 2. Identification of metformin-interacting proteins by the metformin probe.
a, Synthesis and purification of photoactive metformin probes (Met-Ps). Reactions for conjugating 3-(but-3-yn-1-yl)-3-(2-iodoethyl)-3H-diazirine to metformin that introduced a diazirine with a terminal alkyne moiety at either the N4 or N1/N2 position of metformin yields two types of Met-P (Met-P1 and Met-P2) products (upper panel). The two products were further separated on a preparative HPLC (lower panel). See detailed procedures, HSMS data, and NMR data in Methods section and Supplementary Fig. 2. b, Met-P1 is able to inhibit v-ATPase. Lysosomes purified from MEFs were incubated with the two Met-Ps at 10 μM for 1 h. The activity of v-ATPase was determined by its rate to hydrolyse ATP as in Extended Data Fig. 1d. After normalisation to the group without Met-P added, the data are shown as mean ± s.e.m.; n = 3 for each condition, and P value by one-way ANOVA, followed by Dunnett. c, Reactions taking place to form the Met-P1 and proteins conjugates. First, proteins were incubated with Met-P1. The metformin probe-protein mixture was exposed to UV light, followed by addition of Cu(II) salt, which catalyses a [3 + 2] azide-alkyne cycloaddition with biotin-azide, thus biotinylating probe-target complexes, allowing for the pull down of such complexes with NeutrAvidin beads. d, Interaction between PEN2 and metformin probe. HEK293T cells transfected with HA-tagged PEN2 were lysed. Total cell lysates (TCL) were incubated with 10 μM Met-P1, and subsequent exposure to UV, and were then mixed with 1 mM biotin-N3 linker. The biotinylated proteins were then affinity-pulldown (AP) by NeutrAvidin beads, followed by immunoblotting with antibody against HA tag. Experiments in this figure were performed three times, except a seven times. Source data
Extended Data Fig. 3
Extended Data Fig. 3. PEN2 is required for AMPK activation by low metformin.
a, b, Knockdown of PEN2 impairs the activation of AMPK, and inhibition of v-ATPase by metformin. MEFs infected with lentivirus carrying two distinct siRNAs (#1 or 2#) against PEN2, or GFP as a control, were treated with 200 μM metformin for 12 h, representative images of the experiments shown in a upper, followed by analysis of the lysosomal pH [a lower, shown as mean ± s.e.m., n = 20 (control) and 21 (metformin-treated) cells for siGFP, n = 25 cells for siPEN2#1, and n = 29 (control) and 22 (metformin-treated) cells for siPEN2#2, all from 2 dishes/experiments; and P value by two-way ANOVA, followed by Tukey] and the determination of p-AMPKα and p-ACC (b). c, Knockout of PEN2 abrogates the inhibition of v-ATPase by metformin in mouse primary hepatocytes (left panel), MEFs (middle panel), and HEK293T cells (right panel). MEFs, HEK293T cells were treated with 200, 300 μM metformin for 12 h, mouse primary hepatocytes were treated with 5 μM metformin for 2 h, and then labelled with Lysosensor, along with Hoechst. The lysosomal pH was determined as in Fig. 1a. Data are shown as mean ± s.e.m., n = 26 (control) and 31 (metformin-treated) from 6 dishes/experiments for primary hepatocytes, n = 25 (control) and 22 (metformin-treated) from 4 dishes/experiments for MEFs, and n = 30 (control) and 29 (metformin-treated) from 6 dishes/experiments for HEK293T cells; P value within each cell type was determined by two-sided Student’s t-test. d, g, h, k, Knockout of PEN2 blocks AMPK activation by low metformin. Clone #2 of PEN2-/- MEFs (d) treated with 200 μM (low concentration) metformin, or clone #1 and clone #2 of PEN2-/- HEK293T cells (g and h), treated with 300 μM (low concentration for the cell line) metformin, or OCT1-expressing PEN2-/- MEFs and HEK293T cells treated with 5 μM (low concentration) metformin (k) or 5 mM (high concentration, as a control for d, g and h), 500 μM metformin (high concentration, for k), for 12 h (d, g and h) or 2 h (k), were subjected to immunoblotting for the analysis of p-AMPKα and p-ACC. See also results with clone #1 of PEN2-/- MEFs in Fig. 2c. e, f, Strategies to generate MEFs (e) and HEK293T cells (f) with knockout of PEN2. Two distinct sets of sgRNAs for each cell line, whose sequences are listed in Methods section, were applied to generate PEN2-/- cells. Two clones (#1 and #2) for each cell line type were established. i, Knockout of PEN2 blocks the inhibition of v-ATPase by metformin in purified lysosomes. Lysosomes purified from PEN2-/- MEFs were incubated with 5 μM metformin for 1 h. The activity of v-ATPase was determined as in Extended Data Fig. 1d. Data are shown as mean ± s.e.m.; n = 3 for each condition, and P value by two-sided Student’s t-test. j, Knockout of PEN2 does not affect metformin uptake. Mouse primary hepatocytes, MEFs and HEK293T cells were treated as in c, followed by determining intracellular metformin concentrations. Data are shown as mean ± s.e.m., n = 4 for each genotype, and P value within each cell type by two-sided Student’s t-test. l, Re-introduction of PEN2 into PEN2-/- MEFs or HEK293T cells restores AMPK activation. PEN2-/- MEFs (left panel) or HEK293T cells (right panel) were infected with lentiviruses expressing HA-tagged PEN2 (all expressed at close-to-endogenous levels driven by pBOBI vector). Cells were treated with 200 or 300 μM (low concentration), or 5 mM (high concentration, as a control) metformin for 12 h, followed by analysis of p-AMPKα and p-ACC. m, Activity of the γ-secretase holoenzyme is dispensable for metformin-induced AMPK activation. MEFs were treated with DAPT (left panel) or RO4929097 (RO, right panel) at indicated concentrations for 12 h or 48 h. Twelve hours before lysis, cells were treated with 200 μM metformin, then lysed for analysis of p-AMPKα and p-ACC. n, Loss of APH1 does not affect metformin-induced activation of AMPK. MEFs with APH1A, APH1B and APH1C triple knockout were treated with 200 μM or 5 mM metformin for 12 h, followed by analysis of p-AMPKα and p-ACC. o, Strategies to generate MEFs with knockout of nicastrin. sgRNAs against NCSTN, whose sequences are listed in Methods section, were applied to generate NCSTN-/- MEFs. p, q, Knockout of NCSTN, through decreasing the protein levels of PEN2, impairs metformin-induced activation of AMPK. NCSTN-/- MEFs (p) or NCSTN-/- MEFs with HA-tagged PEN2 expressed (q, expressed at close-to-endogenous levels driven by the lentiviral system using pBOBI vector, as validated in r) were treated with 200 μM (low concentration) or 5 mM (high concentration, as a control) metformin for 12 h, followed by analysis of p-AMPKα and p-ACC. r, Protein levels of PEN2 in MEFs with knockout of NCSTN. Cells were lysed for analysis of PEN2 protein levels by immunoblotting, followed by densitometry analysis. s, Strategies to generate MEFs with knockout of presenilins. sgRNAs against PS1 (left panel) and PS2 (right panel), whose sequences are listed in Methods section, were applied to generate PS1- or PS2-KO MEFs. Experiments in this figure were performed three times, except b, h, l, four times. Source data
Extended Data Fig. 4
Extended Data Fig. 4. Other subunits of γ-secretase are not required for AMPK activation by low metformin.
a, Loss of presenilins does not affect metformin-induced activation of AMPK. MEFs with PS1 and PS2 double knocked out were treated with 200 μM or 5 mM metformin for 12 h, followed by analysis of p-AMPKα and p-ACC. b, Protein levels of PEN2 in MEFs with knockout of presenilins (left panel) or APH1 (right panel). Cells were lysed for analysis of PEN2 protein levels by immunoblotting, followed by densitometry analysis. Statistical analysis results were shown as mean ± s.e.m.; n = 6. c, A portion of PEN2 is localised on the surface of lysosome. MEFs were stained with rabbit anti-PEN2 antibody and rat anti-LAMP2 antibody, followed by staining with Alexa Fluor 488 goat anti-rabbit IgG and Alexa Fluor 594 donkey anti-rat IgG secondary antibodies. The areas defined by dashed boxes on each representative image are enlarged as insets. Mander’s overlap coefficients are plotted as mean ± s.e.m., n = 20. d, As a control for Fig. 2e, APEX-tagged TOMM20-PEN2 chimeric construct shows mitochondrial localisation. HEK293T cells stably expressing APEX-tagged TOMM20-PEN2 fused protein (APEX-PEN2 Mito, expressed at close-to-endogenous levels) were imaged under a transmission electron microscope. e, Subcellular fractionation assays show that the lysosomal fraction contains PEN2. The lysosome fractions (purified as described in Methods section), along with total cell lysates of MEFs, or PEN2-/- MEFs as a control, were subjected to immunoblotting using the indicated antibodies (Lyso, lysosome; ER, endoplasmic reticulum; PM, plasma membrane; Mito, mitochondrion; Cyto, cytosol). f, The PEN2 lysosomal localisation is not altered when autophagy is blocked. The lysosomal localisation of PEN2 was determined by staining PEN2 and LAMP2 in WT MEFs and ATG5-/- MEFs, or WT MEFs treated with 20 μM chloroquine (CQ), 4 mM 3-MA, or 0.5 μΜ bafilomycin A (bafA) for 12 h. Mander’s overlap coefficients are plotted as mean ± s.e.m., n = 20 for each genotype/treatment, with P values calculated by one-way ANOVA, followed by Dunn (for autophagy inhibitors) or by two-sided Student’s t-test (for ATG5-/- MEFs). g, Inhibition of endocytosis does not alter the lysosomal PEN2 localisation. MEFs were treated with 60 μM Dynasore for 0.5 h, 10 μM Dyngo-4a for 30 h, 20 μM Nystatin for 1 h, 2 mM methyl-β-cyclodextrin for 6 h, or 1 μM cytochalasin D for 0.5 h. Co-localisation of HA-tagged PEN2 and LAMP2 was then determined by immunofluorescent staining, and the Mander’s overlap coefficients are plotted as mean ± s.e.m., n = 20 for each genotype/treatment, with P values calculated by one-way ANOVA, followed by Dunnett. Experiments in this figure were performed three times. Source data
Extended Data Fig. 5
Extended Data Fig. 5. Lysosomal localisation of PEN2 is required for AMPK activation by low metformin.
a, Other γ-secretase subunits play no role in regulating lysosomal PEN2 localisation. MEFs with PS1 and PS2 double knockout or APH1A/B/C triple knockout were stained with antibodies against PEN2 and LAMP2. MEFs with NCSTN knockout were infected with lentivirus expressing HA-tagged PEN2 (at a close-to-endogenous level), and were stained with HA-tag and LAMP2 antibodies. Mander’s overlap coefficients are plotted as mean ± s.e.m., n = 20 for each genotype/treatment, with P values calculated by two-sided Student’s t-test (for APH1A/B/C triple knockout MEFs) or by two-sided Student’s t-test with Welch’s correction (PS1 and PS2 double knockout MEFs and NCSTN knockout MEFs). b, c, Metformin does not alter the PEN2 lysosomal localisation. MEFs were treated with 200 μM metformin for 12 h, followed by determination of PEN2 and LAMP2 co-localisation (b) or PEN2 protein levels on the lysosomal fractions (c). In b, Mander’s overlap coefficients are plotted as mean ± s.e.m., n = 20 for control and 21 for metformin treatment, with P values calculated by two-sided Student’s t-test. d, e, Disruption of lysosomal localisation of PEN2 impairs AMPK activation by metformin. PEN2-/- MEFs were infected with lentiviruses carrying PEN2 constructs fused to N-terminus to TOMM20 (for tethering to the mitochondrial outer membrane), SEC61B (for tethering to the endoplasmic reticulum), LAMP2 (for tethering to the cytoplasmic face of lysosome) or GOLGA2 (for tethering to the cytoplasmic face of cis-Golgi complex), or at their C-terminus to LCK (for tethering to the cytoplasmic face of plasma membrane) (diagrammed on upper panel of d, and validated in e). Cells were treated with 200 μM metformin for 12 h, followed by analysis of p-AMPKα and p-ACC (lower panel of d). f, Phenformin and buformin, two biguanides that increase AMP levels, activate AMPK independently of PEN2. PEN2-/- MEFs were treated with 1 mM of phenformin or buformin for 2 h, followed by analysis of p-AMPKα and p-ACC (left panel), as well as the AMP:ATP and ADP:ATP ratios (right panel, results are shown as mean ± s.e.m.; n = 4 for each genotype/treatment, and P value by two-way ANOVA followed by Tukey). g, h, PEN2 plays a specific role in the metformin-induced AMPK activation. PEN2-/- MEFs were treated with glucose-free DMEM (GS, shown in g), 1 mM AICAR (as an AMP mimetic, g), 5 μM A23187 (to release calcium for AMPK activation via CaMKK2, h), or 200 μM A769662 (acting downstream by directly binding to AMPK, h) for 2 h, followed by analysis of p-AMPKα and p-ACC. Experiments in this figure were performed three times, except f, g and h four times. Source data
Extended Data Fig. 6
Extended Data Fig. 6. PEN2 binds to metformin.
a, Incubation with metformin decreases the thermal transition midpoint (Tm) of PEN2. FLAG-tagged PEN2 was ectopically expressed in HEK293T cells and purified. Some 10 μM of the purified PEN2 was then incubated with 10 μM metformin in PBS buffer, followed by determining the Tm on a differential scanning calorimetre. Enthalpy changes of PEN2, and PEN2 incubated with metformin at indicated temperatures are shown. b, ITC assay showing that PEN2 is able to bind metformin. Metformin (2 mM stock concentration) was loaded stepwise to 60 μM PEN2 (purified as in a) in PBS buffer. Integrated data (lower panel) were obtained by fitting raw data (upper panel) with the two sets of sites model. c, Unlike PEN2, other γ-secretase subunits do not bind metformin. HEK293T cells transfected with HA-tagged PS1 (either its NTD or CTD), PS2 (either its NTD or CTD), NCSTN, APH1A, APH1B, APH1C, or PEN2 as a control, were lysed, followed by incubation with 10 μM Met-P1, exposure to UV, and were then mixed with 1 mM biotin-N3 linker. The biotinylated proteins were then pulled down by NeutrAvidin beads, followed by immunoblotting with antibody against HA tag. d, Determination of the binding sites of PEN2 for metformin by mass spectrometry. HEK-293T cells expressing HA-tagged PEN2 were lysed, followed by incubation with 10 μM Met-P1, exposure to UV, and the potential modified residues (conjugated with biotinylated Met-P1, with an increase of m/z by 222.17) were determined by mass spectrometry, revealing two Met-P1-conjugated residues, Y47 and Y91, as shown by the typical spectrograms, with Y91 conjugated at a much lower efficiency. e, In silico modelling of metformin bound to the N-terminal, cytosolic face of PEN2. Modelling was performed according to the reported cryo-electron microscopy structure (PDB ID: 6IYC). As shown in this figure, metformin could be protonated by carboxyl groups from residue E40 of PEN2, and then be docked onto PEN2 via salt bridges formed between N2-E40 (position of metformin to the residue of PEN2, and the same below) (2.3 Å) and N4-E40 (2.3 Å). Furthermore, two potential hydrogen bonds formed between N1-F35 (2.0 Å), N2-W36 (2.7 Å) may further strengthen the interaction between metformin and PEN2. f, PEN2-2A fails to bind metformin. PEN2-2A (F35A and E40A, purified as in a) was immobilised on a BIAcore CM5 sensor chip, followed by analysing its interaction with metformin by an SPR assay as in Fig. 2f. Sensorgrams of each measurement are shown. See also sensorgrams from another two repeats of Fig. 2f below. g, Validation data showing that re-introduced PEN2 and its mutants are expressed at a close-to-endogenous level in PEN2-/- MEFs and HEK293T cells. h, PEN2-2A fails to mediate the effect of metformin on v-ATPase inhibition. MEFs were treated as in Extended Data Fig. 1q, followed by analysis of lysosomal pH as in Fig. 1a. After normalisation to the group without metformin treatment within each genotype (same hereafter), results are shown as mean ± s.e.m.; n = 20 (control) and 23 (metformin-treated) from 4 dishes/experiments for PEN2-WT, and n = 20 (normal) and 23 (metformin-treated) from 6 dishes/experiments for PEN2-2A; and P value within each genotype was determined by two-sided Student’s t test with Welch’s correction (for re-introduction of wild type PEN2) or by two-sided Student’s t test (for re-introduction of PEN2-2A). i, PEN2-2A mutant retains proper subcellular localisation as wildtype PEN2. PEN2-/- MEFs were infected with lentivirus expressing HA-tagged PEN2-2A or wildtype PEN2. Cells were then stained with mouse anti-HA antibody and rat anti-LAMP2 antibody, followed by incubation with Alexa Fluor 488 goat anti-mouse IgG and Alexa Fluor 594 donkey anti-rat IgG secondary antibodies (upper panel), or mouse anti-HA antibody and Alexa Fluor 594 goat anti-mouse IgG secondary antibody, followed with Alexa Fluor 488-conjugated rabbit anti-PDI antibody (lower panel). Mander’s overlap coefficients are plotted as mean ± s.e.m., n = 20 for each genotype, with P values calculated by two-sided Student’s t-test. The areas defined by dashed boxes on each representative image are enlarged as insets. j, In silico modelling of metformin bound to the C-terminal of PEN2. Residues D90 with the top-ranked score, as well as salt bridges and hydrogen bonds formed, are shown. k, PEN2-D90A displays full affinity for metformin. HEK293T cells transfected with HA-tagged PEN2-D90A or wild type PEN2 were lysed, followed by incubation with 10 μM Met-P1, exposure to UV, and were then mixed with 1 mM biotin-N3 linker. The biotinylated proteins were then pulled down by NeutrAvidin beads, followed by immunoblotting with antibody against HA tag. l, Residue D90 in PEN2 is not involved in metformin-induced AMPK activation. PEN2-/- MEFs re-introduced with HA-tagged PEN2-D90A or wild type PEN2 (both were expressed at close-to-endogenous levels) were treated with 200 μM (low concentration) or 5 mM (high concentration, as a control) metformin for 12 h, followed by analysis of p-AMPKα and p-ACC. m, o, Effects of PEN2 mutant and metformin on the activity of γ-secretase. HEK293T cells (o) or PEN2-/- HEK293T cells (m) were infected with lentivirus expressing Myc-tagged NotchΔE (NΔE). In m, cells were also infected with lentivirus expressing HA-tagged PEN2-2A, PEN2-20A or wildtype PEN2, in addition to the Myc-tagged NotchΔE (NΔE). Cells were then treated with 300 μM metformin for 12 h (o), or 100 μM DAPT for 12 h, the inhibitor to γ-secretase as a control (m). The cleavage of NotchΔE was determined by the protein levels of its NICD domain by immunoblotting. LE, long exposure; SE, short exposure. n, The PEN2 mutations or metformin do not affect the complex formation of γ-secretase. PEN2-/- MEFs infected with lentivirus expressing HA-tagged PEN2-2A, PEN2-20A (residues 27, 28, 30, 31, 34, 38, 42, 43, 57, 58, 60, 63 to 65, 67, 68, 71, 72, 74 and 75 of PEN2 mutated to alanine, see Extended Data Fig. 7e) or wildtype PEN2, were treated with 200 μM metformin for 12 h and lysed, followed by immunoprecipitation (IP) with antibodies against HA. Immunoprecipitants were than subjected to immunoblotting with antibodies against PS1, PS2, NCSTN, APH1A/B/C, as well as HA (PEN2). Experiments in this figure were performed three times, except g, k and l four times. Source data
Extended Data Fig. 7
Extended Data Fig. 7. ATP6AP1 tethers PEN2 to v-ATPase.
a, PEN2 interacts with ATP6AP1. HEK293T cells were transfected with HA-tagged PEN2 and Myc-tagged ATP6AP1 (AP1). Cells were lysed, and 10 μM metformin (final concentration) or PBS was added to the lysates. Immunoprecipitation (IP) was performed using antibodies against HA, followed by immunoblotting with antibodies indicated. b, PEN2 interacts with ATP6AP1 in vitro. Some 1 μg of FLAG-tagged PEN2 (expressed in HEK293T cells, and purified through eluting with FLAG® peptide) were incubated with 1 μg of Strep-tagged ATP6AP1 (expressed in HEK293T cells, and purified through eluting with desthiobiotin) (input) in lysis buffer, then with metformin at indicated concentrations for 2 h. Immunoprecipitation was performed using ANTI-FLAG® M2 Affinity Gel, followed by immunoblotting with antibodies indicated. c, Domain mapping for the region on ATP6AP1 responsible for PEN2-binding. HA-tagged PEN2 was co-transfected with Myc-tagged ATP6AP1, or its deletion mutants into HEK293T cells. Immunoprecipitation was performed using antibody against Myc-tag, followed by immunoblotting with antibodies indicated. d, Replacement of ATP6AP1 transmembrane domain with that of LAMP2, blocks its interaction with PEN2. HEK293T cells transfected with HA-tagged PEN2-D90A, along with Myc-tagged LAMP2TM-ATP6AP1 or wildtype ATP6AP1, were lysed, and 10 μM metformin was added to the lysates, followed by immunoprecipitation with antibody against HA, and immunoblotting with antibodies indicated. e, In silico modelling of ATP6AP1 (cyan) bound to PEN2 (magenta). Circled area indicates the predicted interface, in which residues 27, 28, 30, 31, 34, 38, 42, 43, 57, 58, 60, 63 to 65, 67, 68, 71, 72, 74 and 75, within the transmembrane domain of PEN2, are involved. f, ATP6AP1 shows much weaker interaction with other γ-secretase subunits than PEN2. MEFs were lysed and incubated with metformin as in a, followed by immunoprecipitation with antibodies against ATP6AP1, or PEN2 as a control. Immunoprecipitants were than subjected to immunoblotting with antibodies against PS1, PS2, NCSTN, APH1A/B/C, as well as PEN2 and ATP6AP1. g, Metformin, through promoting the association between PEN2 and ATP6AP1, enhances association of ATP6AP1 and γ-secretase. PEN2-/- MEFs infected with lentivirus expressing HA-tagged PEN2 or its 20A mutant (lacking the interface for ATP6AP1) were lysed and incubated with metformin as in a, followed by immunoprecipitation with antibodies against ATP6AP1. Immunoprecipitants were than subjected to immunoblotting with antibodies against PS1, PS2, NCSTN, APH1A/B/C, as well as PEN2 and ATP6AP1. h, ATP6AP1 does not interact with metformin. HEK293T cells transfected with HA-tagged ATP6AP1, or HA-tagged PEN2 as a control, were lysed, followed by analysing the interaction between ATP6AP1 or PEN2 with Met-P1 as in Extended Data Fig. 2d. i, Strategies to generate MEFs (lower panel) or HEK293T cells (upper panel) with knockout of ATP6AP1. sgRNAs against ATP6AP1, whose sequences are listed in Methods section, were applied to generate ATP6AP1-/- MEFs and HEK293T cells. j, Knockout of ATP6AP1 leads to constitutive activation of AMPK. MEFs with ATP6AP1 knocked out, along with its wildtype control, were incubated with metformin at indicated concentrations for 12 h, followed by analysing p-AMPK and p-ACC. k, Knockout of ATP6AP1 renders v-ATPase inactive. ATP6AP1-/- MEFs were treated with 200 μM metformin for 12 h, followed by analysis of lysosomal pH with the Lysosensor dye. Data (relative intensity of Lysosensor, processed as in Fig. 1a) were graphed as mean ± s.e.m., n = 29 (control) and 26 (metformin-treated) cells from 6 dishes/experiment for WT MEFs, and 28 (control) and 23 (metformin-treated) cells from 4 dishes/experiments for ATP6AP1-/- MEFs, P value within each genotype was determined by two-sided Mann-Whitney test (for WT MEFs), or by two-sided Student’s t-test (for ATP6AP1-/- MEFs). l, Validation data showing that the re-introduced ATP6AP1 and its mutants are expressed at a close-to-endogenous level in ATP6AP1-/- MEFs (upper panel) and HEK293T cells (lower panel). Experiments in this figure were performed three times, except b, f, h, four times and l five times. Source data
Extended Data Fig. 8
Extended Data Fig. 8. The interaction between PEN2 and ATP6AP1 is required for metformin-induced AMPK activation.
a, b, The truncated ATP6AP1 mutant (ATP6AP1Δ420-440) or the chimeric construct LAMP2TM-ATP6AP1, which are able to maintain the basal activity of v-ATPase, fails to mediate metformin to inhibit v-ATPase. ATP6AP1-/- MEFs re-introduced with full length (FL) ATP6AP1, ATP6AP1Δ420-440 or LAMP2TM-ATP6AP1 (all expressed at close-to-endogenous levels) were treated with 200 μM metformin for 12 h (or 5 μM conA for 2 h as a control, right panel of a), followed by analysis of lysosomal pH by labelling cells with Lysosensor, along with Hoechst. Data (relative intensity of Lysosensor, processed as in Fig. 1a) were graphed as mean ± s.e.m., n = 20 cells from 3 dishes/experiment (a) and n = 28 (control) and 23 (metformin-treated) for ATP6AP1-/- MEFs re-introduced with full length ATP6AP1, and n = 26 (control) and n = 25 (metformin-treated) for ATP6AP1-/- MEFs re-introduced with ATP6AP1Δ420-440, from 4 dishes/experiment (b) for each genotype/treatment. Results are mean ± s.e.m.; P value was determined by one-way ANOVA followed by Dunn (a, left panel) or by two-sided Student’s t test with Welch’s correction (a, right panel) or by two-sided Mann-Whitney test (b). c, ATP6AP1Δ420-440 mutant fails to mediate the effects of metformin on AMPK activation. ATP6AP1-/- MEFs (left panel) or HEK293T cells (right panel) stably expressing Myc-tagged OCT1 were re-introduced with full length (FL) ATP6AP1 or its Δ420-440 mutant (expressed at close-to-endogenous levels). Cells were treated with 5 μM metformin or 500 μM metformin (high concentration, as a control) for 2 h, followed by analysis of p-AMPK and p-ACC. d, ATP6AP1 mutant that cannot interact with PEN2 fails to mediate AMPK activation by metformin. ATP6AP1-/- MEFs re-introduced with full length ATP6AP1 or LAMP2TM-ATP6AP1 (expressed at close-to-endogenous levels) were treated with 200 μM metformin for 12 h, followed by analysis of p-AMPKα and p-ACC by immunoblotting. e, PEN2-20A mutant retains proper subcellular localisation. PEN2-/- MEFs were infected with lentivirus expressing HA-tagged PEN2-20A or wildtype PEN2. Cells were then stained with mouse anti-HA antibody and rat anti-LAMP2 antibody, followed by incubation with Alexa Fluor 488 goat anti-mouse IgG and Alexa Fluor 594 donkey anti-rat IgG secondary antibodies (upper panel), or mouse anti-HA antibody and Alexa Fluor 594 goat anti-mouse IgG secondary antibody, and subsequently with Alexa Fluor 488-conjugated rabbit anti-PDI antibody (lower panel). Mander’s overlap coefficients are plotted as mean ± s.e.m., n = 20 for each genotype, with P values calculated by two-sided Student’s t-test. The areas defined by dashed boxes on each representative image are enlarged as insets. f, PEN2-/- MEFs re-introduced with wildtype PEN2 or PEN2-20A mutant were treated like Extended Data Fig. 6h, followed by analysis of the lysosomal pH [shown as mean ± s.e.m., n = 29 (control) and 27 (metformin-treated) from 6 dishes/experiments for PEN2-/- MEFs re-introduced with wildtype PEN2, n = 20 (control) and 23 (metformin-treated) from 4 dishes/experiments for PEN2-/- MEFs re-introduced with PEN2-20A; and P value within each genotype by two-sided Student’s t test with Welch’s correction (wildtype PEN2) or two-sided Student’s t test (PEN2-20A)]. Experiments in this figure were performed three times, except d four times. Source data
Extended Data Fig. 9
Extended Data Fig. 9. PEN2 and ATP6AP1 act as upstream factors of v-ATPase.
a-c, v-ATPase and its downstream factors AXIN and Ragulator, are required for AMPK activation by low metformin in cells. MEFs with AXIN (a) or LAMTOR1 (b) knocked out, or HEK293T cells with ATP6v0c knocked down (c), were treated with metformin at indicated concentrations for 12 h, followed by analysis of p-AMPKα and p-ACC by immunoblotting. df, v-ATPase, AXIN and Ragulator are required for AMPK activation by low metformin in mouse liver. Mice at 6 weeks old with hepatic AXIN knocked out (d, AXIN-LKO, by crossing AXIN-floxed mice with mice carrying albumin-Cre, and those not carrying Cre as controls), hepatic LAMTOR1 knocked out (e, LAMTOR1-LKO, generated same as in d, except that LAMTOR1-floxed mice were used), or hepatic ATP6v0c knocked down (f, siATP6v0c, by intravenously injected with AAVs carrying siRNA against ATP6v0c, or GFP as a control, two weeks before experiments), were treated with metformin in drinking water (1 g/l) for 7 days. At the day 8, mice livers were quickly dissected from euthanised mice, and p-AMPKα and p-ACC levels in livers were determined by immunoblotting. g, Strategies to generate MEFs with knockout of PRKAB1 and PRKAB2 (AMPKβ1 and AMPKβ2). sgRNAs against these two genes, whose sequences are listed in Methods section, were applied to generate AMPKβ1/2-/- MEFs. See also knockout efficiency of AMPKβ1 and AMPKβ2, as determined by immunoblotting using antibodies against pan-AMPKβ. h, Membrane localisation of AMPK is required for AMPK activation by low metformin. AMPKβ1/2-/- MEFs were infected with lentivirus carrying AMPKβ1 or its G2A mutant (defective in N-myristoylation and hence preventing membrane/lysosomal localization of AMPK). Cells were treated with 200 μM metformin or 5 mM for 12 h, followed by determining p-AMPKα and p-ACC levels by immunoblotting. i, Representative images of the experiments shown in Fig. 3g, indicate that PEN2 is required for the lysosomal translocation of AXIN. PEN2-/- MEFs and its wildtype control were treated with 200 μM metformin for 12 h, or with the v-ATPase inhibitor concanamycin A (conA, 5 μM) for 2 h as a control. AXIN and the lysosomal marker LAMP2 were stained with goat anti-AXIN antibody (green) and rat anti-LAMP2 antibody (red), respectively. Images were taken by confocal microscopy after incubating cells with Alexa Fluor 488 donkey anti-goat IgG and Alexa Fluor 594 donkey anti-rat IgG. The areas defined by dashed boxes on each representative image are enlarged as insets. j, k, l, Loss of PEN2, hence PEN2-ATP6AP1 interaction, abolishes the formation of the AXIN-based lysosomal complex by metformin. PEN2-/- MEFs (j), or PEN2-/- MEFs re-introduced with PEN2 (k), or ATP6AP1-/- MEFs re-introduced with full length (FL) ATP6AP1 or its Δ420-440 mutant (l, all expressed at close-to-endogenous levels) were treated with 200 μM metformin for 12 h, or treated with 5 μM concanamycin A (k, conA) for 2 h as a control. Endogenous LAMTOR1 was immunoprecipitated with rabbit anti-LAMTOR1 antibody, and IgG as control, followed by immunoblotting using the indicated antibodies. Experiments in this figure were performed three times, except a-c four times.
Extended Data Fig. 10
Extended Data Fig. 10. PEN2 and ATP6AP1 control the lysosomal translocation of AXIN.
a, b, Representative images of the experiments shown in Fig. 3g, indicate that PEN2, along with its interaction with ATP6AP1, is required for the lysosomal translocation of AXIN. PEN2-/- MEFs, along with PEN2-/- MEFs re-introduced with wildtype PEN2, its mutant 2A or mutant 20A (a), and ATP6AP1-/- MEFs, along with its wildtype control, or those re-introduced with full length (FL) ATP6AP1, or ATP6AP1Δ420-440 (b, Re-introduced proteins were all expressed at close-to-endogenous levels), were treated with 200 μM metformin for 12 h, or with the v-ATPase inhibitor concanamycin A (conA, 5 μM) for 2 h as a control. AXIN and the lysosomal marker LAMP2 were stained with goat anti-AXIN antibody (green) and rat anti-LAMP2 antibody (red), respectively. Images were taken by confocal microscopy after incubating cells with Alexa Fluor 488 donkey anti-goat IgG and Alexa Fluor 594 donkey anti-rat IgG. The areas defined by dashed boxes on each representative image are enlarged as insets. Experiments in this figure were performed three times.
Extended Data Fig. 11
Extended Data Fig. 11. Aldolase-TRPV act as a separate route from PEN2-ATP6AP1.
a, b, Inhibition of v-ATPase by conA activates AMPK in cells lacking the PEN2 and ATP6AP1 axis. PEN2-/- MEFs (a) or ATP6AP1-/- MEFs re-introduced with full length (FL) ATP6AP1 or its Δ420-440 mutant (b; expressed at close-to-endogenous levels) were treated with 5 μM conA for 2 h, followed by determining p-AMPKα and p-ACC levels by immunoblotting. c, Liver-specific ALDOA-D34S transgenic (Tg) mice renders hepatic AMPK inactive under starvation. Tg mice (6-week-old) expressing ALDOA-D34S (expressed under an ApoE promoter and its hepatic control region included in the pLiv-Le6 vector), which can still bind FBP in low glucose, and therefore mimics a high glucose state in which AMPK is inactivated (see cell-based data in ref. ), were starved for 16 h. P-AMPKα and p-ACC levels in livers were then determined by immunoblotting. d, Aldolase is dispensable for low metformin-induced AMPK activation in HEK293T cells. Cells stably expressing HA-tagged ALDOA-D34S mutant, or wildtype ALDOA were treated with 300 μM metformin (low concentration) or 5 mM (high concentration, as a control) for 12 h, followed by analysis of p-AMPKα and p-ACC levels by immunoblotting. e, Aldolase is dispensable for low metformin-induced AMPK activation in mouse liver. Mice with Tg-ALDOA-D34S at 6 weeks old were treated with metformin in drinking water (1 g/l) for another 7 days. At the day 8, mice were sacrificed, and hepatic p-AMPKα and p-ACC levels were determined by immunoblotting. f, g, TRPV is dispensable for low metformin-induced AMPK activation. Experiments pertaining to TRPV dependency were performed in MEFs (f) as well as in mouse livers (g) as described in d (except 200 μM metformin was used) and e, respectively, except that MEFs with quadruple knockout of TRPV1-4 (f, TRPV-QKO), or the TRPV1-/- mice injected with a combination of AAV-carried siRNAs against TRPV2, TRPV3 and TRPV4 (g, siTRPV2-4, at 8 weeks old, which had been validated to show little expression of TRPVs, see ref. ), were used (viruses were injected at 4 weeks old, and metformin was supplied at 8 weeks old). Experiments in this figure were performed three times, except d five times.
Extended Data Fig. 12
Extended Data Fig. 12. PEN2-ATP6AP1 axis is required for metformin-mediated glucose absorption and hepatic fat reduction.
a, Verification of AMPKα knockout efficiency in the duodenum of AMPKα intestine-specific knockout (IKO) mice. Mouse offsprings carrying floxed AMPKα1 and AMPKα2, as well as vilERT2-Cre (tamoxifen-sensitive, ERT2-fused Cre recombinase expressed under the control of the villin promoter, for deletion of AMPKα in intestine), along with their wildtype littermates (carrying floxed AMPKα1 and AMPKα2, but not vilERT2-Cre) were injected with tamoxifen (as described in Method section) for knockout of AMPKα. Protein levels of AMPKα in duodenum were then analysed by immunoblotting. b, Intestinal AMPK is required for metformin to induce glucose lowering. Mice at 5 weeks old with intestinal AMPKα1/2 double knockout (AMPKα1/2-IKO), along with its wildtype littermates, were treated with metformin in drinking water (+ Met, 1 g/l) for 7 days (tamoxifen was injected at 4 weeks old). At day 8, mice were starved for 6 h, followed by oral glucose tolerance test (OGTT, results are shown as mean ± s.e.m., n = 7 for each genotype/treatment, except for WT mice treated with drinking water without metformin, n = 6; and P value by two-way RM ANOVA, followed by Tukey, compared blood glucose levels between WT + Met group and AMPKα1/2-IKO + Met group at the same time point; see also inset for AUC values, P value by two-way ANOVA, followed by Tukey). c, l, Strategies to generate PEN2-floxed (c) or ATP6AP1-floxed (l) allele. d, f, Depletion of PEN2 in the intestine or liver in PEN2-floxed mice. PCR analysis results of mouse offsprings carrying floxed PEN2, as well as vilERT2-Cre (d) or albERT2-Cre (f, same as in d, except Cre under albumin promoter, for deletion of PEN2 in liver) allele are shown on the upper panels. Protein levels of PEN2 in duodenal (d), or hepatic (f) tissues in PEN2 intestine- or liver-specific knockout (IKO or LKO) mice are also shown. See also panels of d and f for the experimental timeline of the analysis of phenotypes of PEN2-IKO (d) and PEN2-LKO (f) mice. e, Intestinal PEN2 is required for metformin-induced glucose-lowering effect. Mice were fed with HFD as in Fig. 4a. Serum insulin levels are shown as mean ± s.e.m., n = 5 for each genotype/treatment, and P value by two-way RM ANOVA, followed by Tukey, compared insulin levels between WT + Met group and PEN2-IKO + Met group at the same time point; see also inset for AUC values, P value by two-way ANOVA, followed by Tukey. g, h, PEN2 is required for metformin-induced reduction of hepatic fat. As depicted in f, mice at 38 weeks old with hepatic PEN2 knockout (PEN2-LKO), along with its wildtype littermates, were treated with metformin in drinking water (+ Met, 1 g/l) for 16 weeks. At week 54, mice were starved for 6 h, followed by intraperitoneal glucose tolerance test (g, IPGTT; serum insulin levels are shown as mean ± s.e.m., n = 5 for each genotype/treatment, and P values by two-way RM ANOVA, followed by Tukey, compared blood glucose or insulin levels between WT + Met group and PEN2-LKO + Met group at the same time point; see also inset for AUC values, P values by two-way ANOVA, followed by Tukey), insulin tolerance test (h, ITT, results are shown as mean ± s.e.m., n = 6 for each genotype/treatment, and P value by two-way RM ANOVA, followed by Tukey, compared as in c; see also inset for AUC values, P value by two-way ANOVA, followed by Tukey). i, p, The PEN2-ATP6AP1 axis is required for AMPK activation by metformin in primary hepatocytes from HFD-fed mice. PEN2-LKO mice were generated as in Fig. 4c (i), and ATP6AP1 or ATP6AP1Δ420-440 mutant was reintroduced to in the liver of mice lacking hepatic ATP6AP1 as in Fig. 4e (p), and the resultant mice were fed with HFD for 35 weeks. Primary hepatocytes were then isolated, and treated with 5 μM metformin or 500 μM metformin for 2 h, and then subjected to analysis p-AMPKα and p-ACC levels by immunoblotting. j, q, The PEN2-ATP6AP1 axis is required for AMPK activation in the liver of HFD-fed mice. Mice were treated as in Fig. 4c (j) or 4e (q). Hepatic AMPK activation (immunoblots), AMP:ATP and ADP:ATP ratios (scatter plots, left panel), as well as the absolute concentrations of AMP, ADP and ATP [scatter plots, middle panel, shown as mean ± s.e.m., n = 5 (j) and n = 5 (q) for each genotype/treatment, except for ischemic treatment, n = 4; P value by one-way ANOVA, followed by Tukey], and metformin concentrations [scatter plots, right panel, shown as mean ± s.e.m. on right panel, n = 6 (j) and n = 5 (q) for each genotype, and P value by two-sided Student’s t-test] in mice after 1-week treatment of metformin (1 g/l in drinking water) are shown. k, r, The PEN2-ATP6AP1 axis is required for the reduction of hepatic fat by metformin. Mice were fed with HFD as in Fig. 4c (k) or 4e (r), and images from H&E staining of the liver in mice after 16-week treatment of metformin are shown. m, Depletion of ATP6AP1, and re-introduction of ATP6AP1 or ATP6AP1Δ420-440 in liver in ATP6AP1-LKO mice. PCR analysis results of mouse offsprings carrying floxed ATP6AP1, as well as albERT2-Cre are shown on the upper panel. Protein levels of endogenous ATP6AP1, as well as full length (FL) ATP6AP1, or ATP6AP1Δ420-440 mutant expressed via AAVs, are shown on the middle panel. Experimental timeline of the analysis of the phenotypes of liver-specific ATP6AP1 (FL) and ATP6AP1Δ420-440-expressing mice were shown on the lower panel. n, o, ATP6AP1 is required for metformin-induced reduction of hepatic fat. As depicted in m, mice at 38 weeks old with hepatic depletion of ATP6AP1, and re-introduction of ATP6AP1 or ATP6AP1Δ420-440 (FL or Δ420-440) were treated with metformin in drinking water (+ Met, 1 g/l) for 16 weeks. At week 54, mice were starved for 6 h, followed by intraperitoneal glucose tolerance test (n, serum insulin levels are shown as mean ± s.e.m., n = 5 for each genotype/treatment, and P value by two-way RM ANOVA, followed by Tukey, compared insulin levels between ATP6AP1 (FL) + Met group and ATP6AP1Δ420-440 + Met group at the same time point; see also inset for AUC values, P value by two-way ANOVA, followed by Tukey), insulin tolerance test (o, shown as mean ± s.e.m., n = 6 for each genotype/treatment, and P value by two-way RM ANOVA, followed by Tukey, compared as in n; see also inset for AUC values, and P value by two-way ANOVA, followed by Tukey). Experiments in this figure were performed three times, except i four times. Source data
Extended Data Fig. 13
Extended Data Fig. 13. PEN2-ATP6AP1 axis is required for metformin-mediated lifespan extension in nematodes.
a, Metformin extends lifespan of C. elegans. Wildtype nematodes (N2) were cultured on NGM plates containing metformin at different concentrations. Lifespans were determined, and results are shown as Kaplan-Meier curves, see also statistical analysis data on Supplementary Table 3. b, d, Metformin at 50 mM does not elevate AMP/ADP levels in C. elegans with knockdown of PEN2. Nematodes were knocked down of PEN2 (b, generated as in Fig. 4g by culturing on RNAi plates containing E. coli expressing siRNA against PEN2; the knockdown efficiency was assessed by determining mRNA levels of PEN2 as shown in d; results are mean ± s.e.m., n = 3 for each genotype; and P value by two-sided Student’s t-test), and were maintained on RNAi plates containing 50 mM metformin for 2 more days. Worms were then subjected to the analysis of AMP:ATP and ADP:ATP ratios. Data are shown as mean ± s.e.m., n = 4 for each genotype/treatment, and P value by two-way ANOVA, followed by Tukey. c, PEN2 is required for metformin-induced lifespan extension in C. elegans. Nematodes were generated as in Fig. 4g and AMPK activation after 2-day treatment of metformin, were determined. e, j, Metformin uptake is not altered in nematodes lacking PEN2 or ATP6AP1. L4 larvae of nematodes with PEN2 knockdown (e, generated as in Fig. 4g), or of nematodes with knockout of ATP6AP1 and stable expression of full length ATP6AP1 or ATP6AP1Δ420-440 mutant (j, generated as in Fig. 4h), were cultured on RNAi plates (e) or NGM plates (j) containing 50 mM metformin, for 2 days. Metformin concentrations were determined by HPLC-MS, and normalised to protein concentrations. Data are shown as mean ± s.e.m., n = 4 for each genotype; and P value by two-sided Student’s t-test. f, Metformin at 50 mM does not elevate AMP/ADP levels in ATP6AP1-/- C. elegans re-introduced with ATP6AP1Δ420-440. Nematodes were knocked out of ATP6AP1 (vha-19), then re-introduced with ATP6AP1Δ420-440 or ATP6AP1 as a control, as shown in Fig. 4h, and then cultured on NGM plates containing 50 mM metformin for 2 more days before subjecting to analysis of AMP:ATP and ADP:ATP ratios. Data are shown as mean ± s.e.m., n = 4 for each genotype/treatment; and P value by two-way ANOVA, followed by Tukey. g, Low metformin fails to promote fatty acid β-oxidation. AMPKα1/2-/- mouse primary hepatocytes were treated with 100 μM BSA-conjugated [U-13C]-palmitic acid and 5 μM or 500 μM metformin for 4 h. Relative contents of labelled citrate, succinate and fumarate were determined by GC-MS. Data are shown as mean ± s.e.m., n = 4 for each genotype/treatment; and P value by two-way ANOVA, followed by Tukey. h, Low metformin inhibits de novo lipogenesis, but does not affect TAG synthesis from fatty acids. Mouse primary hepatocytes were isolated as in g, and were treated with 100 μM BSA-conjugated [U-13C]-palmitic acid (left panel) and 25 mM [U-13C]-glucose (right panel) for 12 h for determining the TAG synthesis from fatty acids and de novo lipogenesis, respectively. Metformin at 5 μM or 500 μM was added to the culture medium along with labelled palmitic acid or glucose. Relative contents of labelled TAG were determined by LC-MS. Data are shown as mean ± s.e.m., n = 4 for the determination of TAG synthesis and n = 5 for the determination of de novo lipogenesis; and P value by two-way ANOVA, followed by Tukey. i, ATP6AP1 is required for metformin-induced lifespan extension in C. elegans. Nematodes were treated as in Fig. 4h, AMPK activation after 2-day treatment of metformin, were determined. k, The presence of living bacteria on the culture plates does not affect metformin uptake by nematodes. The L4 larvae of N2 were cultured on NGM plates (left panel) or RNAi plates (right panel) containing 50 mM metformin. Metformin concentrations of nematodes at day 1 and day 3 (before culture plate refreshing) were measured by HPLC-MS. Data are shown as mean ± s.e.m., n = 4 for each treatment, and P value by two-sided Student’s t-test. l, No changes in AMP:ATP and ADP:ATP ratios in the liver from mice fed with 0.1% metformin in diet. Mice at 4 weeks old were fed with normal chow (NC) diet, or normal chow diet containing 0.1% metformin (This way of giving metformin has been shown to be effective in extending the lifespan of mice) for a week. Hepatic AMP:ATP and ADP:ATP ratios were then determined. Results are shown as mean ± s.e.m., n = 9 for normal chow or n = 7 for 0.1% metformin; and P value by two-sided Student’s t-test. m, Schematic diagramme showing that the FBP-unoccupied aldolase-triggered glucose sensing and the PEN2-mediated metformin signalling axes converge at the v-ATPase complex to trigger AMPK activation. In response to lowering glucose levels, aldolase inhibits the cation channel TRPV, the latter of which then disrupts the association of the former with, and inhibits, v-ATPase. Metformin at low concentrations binds to PEN2, and metformin-bound PEN2 is recruited to v-ATPase via interacting with ATP6AP1, thereby inhibiting the activity of v-ATPase. Also shown is that high concentrations of metformin activates AMPK via elevating cellular AMP levels. Experiments in this figure were performed three times, except l five times. Source data
Extended Data Fig. 14
Extended Data Fig. 14. Autophagy and ROS elevation are downstream events of AMPK, and are not involved in metformin-induced AMPK activation.
a, b, Autophagy occurs in MEFs treated with metformin. MEFs were treated with 200 μM metformin for indicated durations. Protein levels of the autophagy reporter p62 and the phosphorylation levels of AMPK and ACC (b), as well as the lysosomal pH (a), were determined by immunoblotting using the indicated antibodies (b) or by visualisation with Lysosensor dye (a). Results of a (relative intensities of Lysosensor, processed as in Fig. 1a) are shown as mean ± s.e.m., n = 40 cells from 4 dishes/experiment for 0 h, and n = 40 cells for 4 h, 24 h and 48 h, n = 41 cells for 8 h, and n = 42 cells for 72 h, all from 6 dishes/experiments; and P value by one-way ANOVA, followed by Dunn. c, f, Metformin elevates ROS levels in C. elegans, but not in MEFs, HEK293T cells and mouse primary hepatocytes. In c, L4 larvae of N2 were cultured on NGM plates containing 50 mM metformin, 5 mM NAC for one day, and were then stained with 10 μM CM-H2DCFDA followed by determination of ROS by imaging. Data are shown as mean ± s.e.m., n = 30 worms for control (untreated) condition or n = 25 worms for other conditions; and P value by two-way ANOVA, followed by Tukey (c). In f, MEFs and HEK293T cells were treated with 200 or 300 μM metformin for 12 h, and mouse primary hepatocytes were treated with 5 μM metformin for 2 h. Cells were stained with 5 μM CellROX Deep Red, followed by determination of ROS by imaging. Data are shown as mean ± s.e.m., n = 20 (for hepatocytes and HEK293T cells) or 40 (for MEFs) cells from 4 dishes/experiment; and P value by two-sided Student’s t-test (hepatocytes) or two-sided Mann-Whitney test (MEFs and HEK293T cells). d, e, ROS and AMPK are both required for the metformin-mediated lifespan extension of C. elegans. L4 larvae of N2 or AMPK-deficient (aak-2) strain were cultured on NGM plates containing 50 mM metformin, 5 mM NAC (in d, for inhibiting ROS), or 0.1 μM rotenone (in d, as a positive control for ROS induction). Lifespans were determined, and results are shown as Kaplan-Meier curves, see also statistical analysis data on Supplementary Table 3. g, i, NAC does not affect metformin-induced AMPK activation. Mouse primary hepatocytes, MEFs, HEK293T cells (g), or nematodes (i) were pre-treated with 5 mM NAC for 24 h, followed by treating with 5 μM metformin for 2 h, 200 μM metformin for 12 h, 300 μM metformin for 12 h, or 50 mM metformin for 2 days. Levels of p-AMPKα and p-ACC were then determined by immunoblotting. h, NAC does not affect metformin-induced v-ATPase inhibition. Primary hepatocytes, MEFs, or HEK293T cells were treated as in g, followed by analysis of lysosomal pH with the Lysosensor dye. Data (relative intensity of Lysosensor, processed as in Fig. 1a) were graphed as mean ± s.e.m., n = 20 cells from 3 dishes/experiment (for hepatocytes), n = 20 cells from 3 dishes/experiment (for MEFs), or n = 24 cells for normal condition and normal condition with NAC, and n = 25 for metformin treatment and metformin plus NAC treatment, all from 4 dishes/experiment (for HEK293T cells). P value within each treatment was determined by two-way ANOVA, followed by Tukey. j, Low metformin does not alter the expression of gluconeogenic genes. Mouse primary hepatocytes isolated from PEN2-LKO mice or its wildtype littermates, or ATP6AP1-LKO mice re-introduced full length ATP6AP1 or ATP6AP1Δ420-440 mutant were treated with 5 μM metformin, 500 μM metformin (high dose, as a control), or 100 nM of glucagon (as a positive control for elevation of the expression of gluconeogenic genes) for 2 h, followed by analysis of mRNA levels of PCK1 and G6PC1 by real-time PCR. Data are shown as mean ± s.e.m.; n = 3 for each genotype/treatment, and P value by two-way ANOVA, followed by Tukey. k, Hepatic PEN2 is not required for the inhibition of gluconeogenesis by metformin. Mice at 5 weeks old with hepatic PEN2 knocked out, along with its wildtype littermates, were treated with metformin in drinking water (1 g/l) for another 7 days (tamoxifen was injected at 4 weeks old). At the day 8, mice were starved for 16 h, followed by pyruvate tolerance test. Results are shown as mean ± s.e.m., n = 7 for each genotype/treatment, and P value by two-way RM ANOVA followed by Tukey; see also inset for AUC values, P value by two-way ANOVA followed by Tukey. l, m, The PEN2-ATP6AP1 axis is required for the inhibition of mTORC1 by low metformin. MEFs, HEK293T cells and mouse primary hepatocytes with PEN2 knockout (l), ATP6AP1 knockout and with re-introduced full length ATP6AP1 or ATP6AP1Δ420-440 (m), were treated with 200 μM and 5 mM metformin (for MEFs), 300 μM and 5 mM metformin (for HEK293T cells) for 12 h, 5 μM and 500 μM metformin (for mouse primary hepatocytes). Cells were then lysed, and the activity of mTORC1 was determined by immunoblotting the phosphorylation levels of its substrate S6K (p-S6K). n, AMPK is required for the inhibition of mTORC1 by low metformin. AMPKα1/2-/- mouse primary hepatocytes were treated with 5 μM and 500 μM metformin for 2 h. Cells were then lysed, and the activity of mTORC1 was determined by immunoblotting the phosphorylation levels of its substrate S6K (p-S6K). Experiments in this figure were performed three times, except a, j, l, m four times. Source data

Comment in

References

    1. Foretz M, Guigas B, Viollet B. Understanding the glucoregulatory mechanisms of metformin in type 2 diabetes mellitus. Nat. Rev. Endocrinol. 2019;15:569–589. - PubMed
    1. Barzilai N, Crandall JP, Kritchevsky SB, Espeland MA. Metformin as a tool to target aging. Cell Metab. 2016;23:1060–1065. - PMC - PubMed
    1. Morales DR, Morris AD. Metformin in cancer treatment and prevention. Annu Rev Med. 2015;66:17–29. - PubMed
    1. Rena G, Hardie DG, Pearson ER. The mechanisms of action of metformin. Diabetologia. 2017;60:1577–1585. - PMC - PubMed
    1. Foretz M, Guigas B, Bertrand L, Pollak M, Viollet B. Metformin: from mechanisms of action to therapies. Cell Metab. 2014;20:953–966. - PubMed

Publication types

MeSH terms