. 2022 Mar;603(7899):166-173.
doi: 10.1038/s41586-022-04437-2. Epub 2022 Feb 23.

Effective drug combinations in breast, colon and pancreatic cancer cells

Affiliations

Effective drug combinations in breast, colon and pancreatic cancer cells

Patricia Jaaks et al. Nature. 2022 Mar.

Abstract

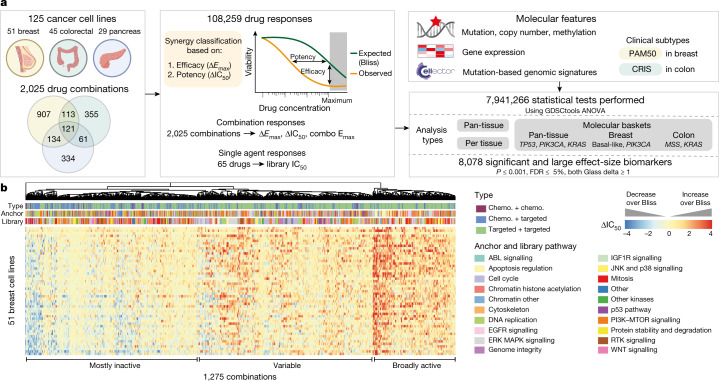
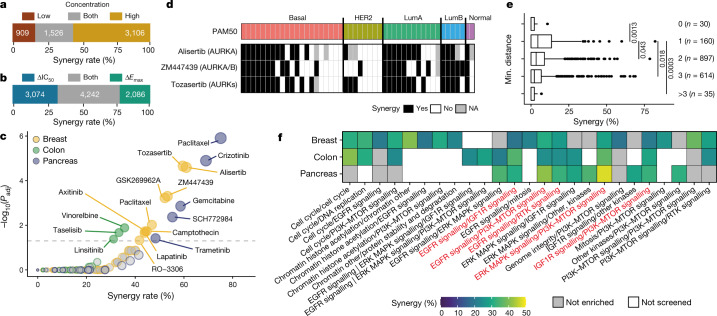
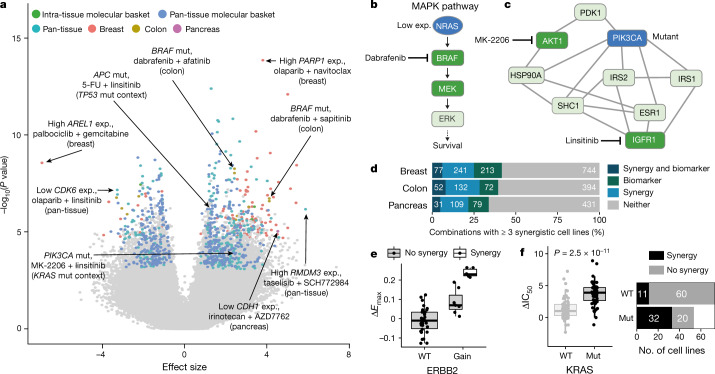
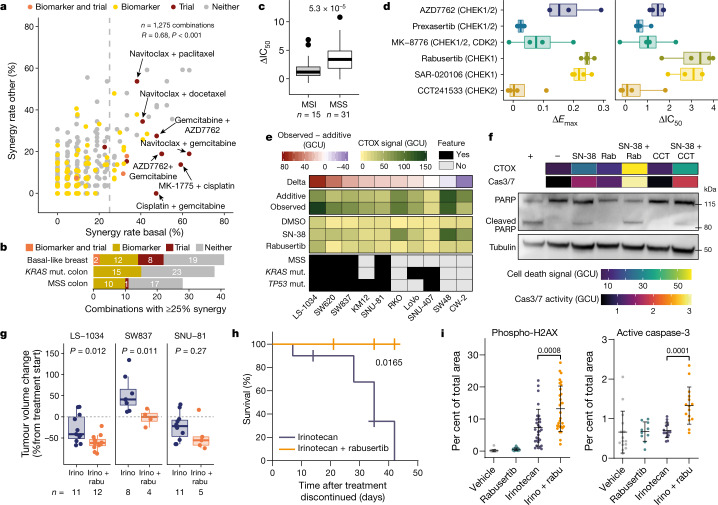
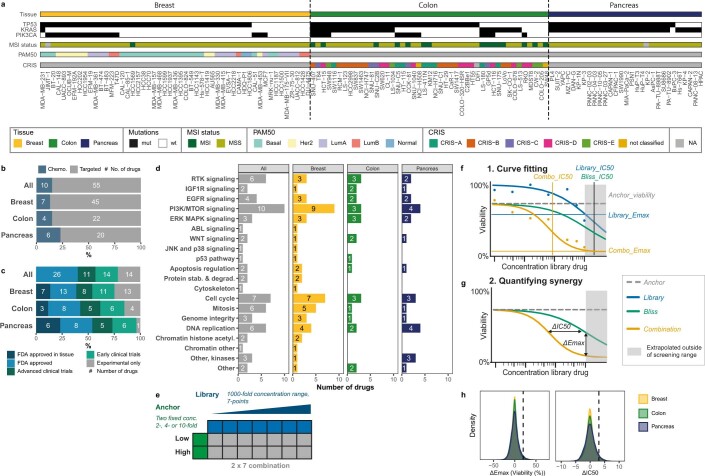
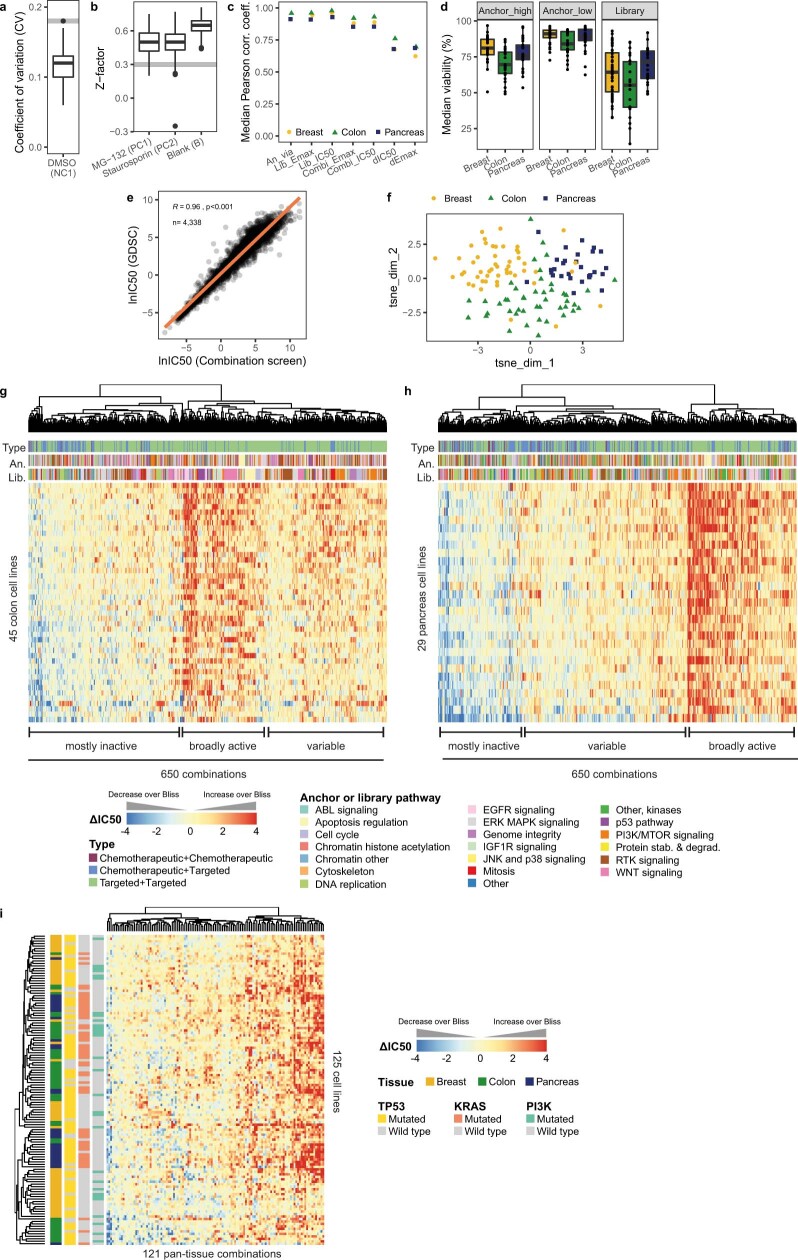
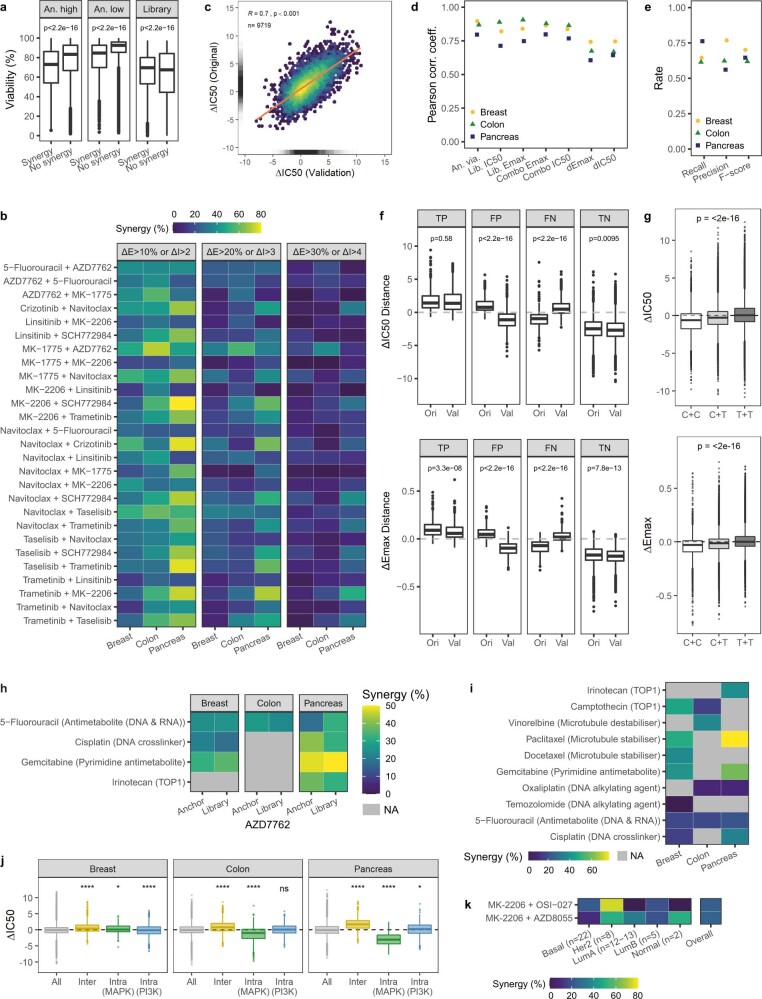
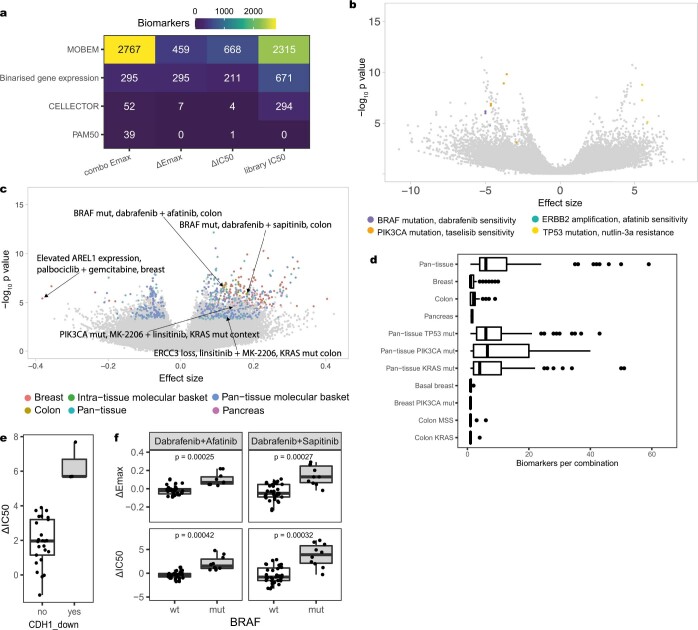
Combinations of anti-cancer drugs can overcome resistance and provide new treatments1,2. The number of possible drug combinations vastly exceeds what could be tested clinically. Efforts to systematically identify active combinations and the tissues and molecular contexts in which they are most effective could accelerate the development of combination treatments. Here we evaluate the potency and efficacy of 2,025 clinically relevant two-drug combinations, generating a dataset encompassing 125 molecularly characterized breast, colorectal and pancreatic cancer cell lines. We show that synergy between drugs is rare and highly context-dependent, and that combinations of targeted agents are most likely to be synergistic. We incorporate multi-omic molecular features to identify combination biomarkers and specify synergistic drug combinations and their active contexts, including in basal-like breast cancer, and microsatellite-stable or KRAS-mutant colon cancer. Our results show that irinotecan and CHEK1 inhibition have synergistic effects in microsatellite-stable or KRAS-TP53 double-mutant colon cancer cells, leading to apoptosis and suppression of tumour xenograft growth. This study identifies clinically relevant effective drug combinations in distinct molecular subpopulations and is a resource to guide rational efforts to develop combinatorial drug treatments.


Conflict of interest statement

M.J.G. has received research grants from AstraZeneca, GlaxoSmithKline, and Astex Pharmaceuticals, and is founder of Mosaic Therapeutics. C.H.B is an employee of Novartis and previously received research funding from Novartis. L.T. reports research grants from Symphogen, Servier, Pfizer, Menarini, Merck KGaA and Merus. Drug combinations described in this study are subject to patents filed by Genome Research Limited, which is the name under which the Sanger Institute operates.

Figures

Fig. 1
Fig. 1. A large-scale drug combination screen.
a, 2,025 drug combinations were screened in breast, colon and pancreas cancer cell lines (n = 125). Synergy was evaluated on the basis of efficacy (ΔEmax) and potency (ΔIC50) for 108,259 drug responses and integrated with cell line molecular features to identify biomarkers. b, Heat map of ΔIC50 values for 1,275 combinations in 51 breast cancer cell lines: clustering by combination and annotation by combination type, anchor and library pathway. ΔIC50 limits are clipped to −4 and 4, rows are sorted by conditional mean ΔIC50 on cell line identity. Chemo., chemotherapeutic agent.
Fig. 2
Fig. 2. Synergy is rare and highly context-dependent.
a, Overlap of synergy identified at two anchor concentrations. n = 5,541 synergistic combination-cell line pairs. b, Synergy calls by ΔIC50 and ΔEmax are complementary. n = 9,402 synergistic measurements. c, Navitoclax combination partners and tissue-specific enrichment in synergy (hypergeometric test). Enriched navitoclax partners (P ≤ 0.005, FDR ≤ 5%) are labelled. d, Combinations of navitoclax with AURK inhibitors are frequently synergistic in breast cancer cell lines, with exception of HER2 cells. Binary synergy for navitoclax (anchor) paired with three AURK inhibitors with indicated specificity across PAM50 subtypes. e, Synergy rates for 1,736 combinations of two targeted drugs by minimum (min.) network distance between drug targets. Two-sided Student’s t-test. f, Twenty-four unique target pathway pairs enriched in synergy in at least one tissue (136 unique pairs tested; hypergeometric test, P ≤ 0.005, FDR ≤ 5%). Red denotes pathway pairs that are enriched in all three tissues.
Fig. 3
Fig. 3. A biomarker pipeline incorporating multi-omics features identifies context-specific associations.
a, Volcano plot of biomarkers associated with ΔIC50 (n = 2,006,328). Statistically significant large effect-size biomarkers (n = 884) are coloured by analysis type. Examples discussed in the text and selected outliers are labelled. Exp., expression; mut., mutant. b, Schematic of MAPK pathway showing the relationship between NRAS and BRAF. Low expression of NRAS is a biomarker of certain dabrafenib-containing combinations. c, Network of interactors of PIK3CA, showing its position two nodes away from targets of MK-2206 and linsitinib. PIK3CA mutation is predictive of the linsitinib + MK-2206 combination response in the KRAS-mutant molecular context. d, Number of combinations with at least three synergistic cell lines and combination response biomarkers (ΔEmax or ΔIC50). e, Gain of ERBB2 is associated with sapitinib + JQ1 combination response in breast and all synergistic cell lines have an ERBB2 amplification. f, KRAS mutation is associated with trametinib + MK-2206 combination response in a pan-tissue setting (left, two-sided Welch’s t-test) and most synergistic cell lines harbour mutated KRAS (right). In box plots, the horizontal line shows the median, boxes extend across first and third quartiles, and whiskers extend to 1.5× interquartile range.
Fig. 4
Fig. 4. Populations of unmet clinical need and validation of combined irinotecan and CHEK1 inhibitor treatment.
a, Synergy rates of combination treatments for breast cancer, comparing basal-like (x-axis) against other PAM50 subtypes (y-axis). Dashed line indicates a 25% synergy rate. R, Pearson correlation coefficient. Combinations with biomarkers or clinical trials are indicated. b, Combinations with at least 25% synergy with biomarkers or ongoing trials. c, AZD7762 (CHEK1/2 inhibitor) and camptothecin (TOP1 inhibitor) show higher potency (ΔIC50) in colon MSS cells. Replicates averaged and both combination anchor–library configurations pooled. Two-sided Welch’s t-test. d, The response to combination treatment is CHEK1-specific. Activity of camptothecin combined with six CHEK inhibitors in 4 colon cell lines for 72 h. e, In most cases, combined TOP1 and CHEK1 inhibition produces cell death that is greater than the additive effect. CellTox green (CTOX) signal (in green calibrated units (GCU)) after 72 h of treatment with SN-38 (TOP1 inhibitor) and rabusertib (CHEK1 inhibitor). Mean of 3 or 4 biological replicates. Additive is defined as the sum of single-agent responses. Delta is observed response minus additive response. f, Inhibition of TOP1 and CHEK1 for 72 h induces caspase-dependent cell death in SW837 cells. CTOX and caspase 3/7 (Cas3/7) activity is shown as the mean of 3 biological replicates. PARP western blot is representative of three independent experiments (+, positive control; −, DMSO-only negative control); rabu, rabusertib; CCT, CCT241533. g, Rabusertib increases irinotecan response in vivo in colon cancer cells engrafted in NOD/SCID mice. Two-tailed unpaired Welch’s t-test. h, Addition of rabusertib to irinotecan treatment improves survival of mice. SNU-81 cells were engrafted in NOD/SCID mice; mice were treated with irinotecan (n = 10 mice) or irinotecan + rabusertib (n = 4) for 35 days and monitored for 42 days after treatment discontinued. Log-rank Mantel–Cox test; P value shown. i, Combined rabusertib and irinotecan treatment increases genotoxic stress. LS-1034 cells were treated as in g. Tumours were collected 72 h after start of treatment and stained for phospho-H2AX (n = 30) and active caspase 3 (rabusertib, n = 10; other groups, n = 15). Data are mean ± s.d. Two-tailed unpaired Welch’s t-test. In box plots, the horizontal line shows the median, boxes extend across first and third quartiles, and whiskers extend to 1.5× interquartile range. Source data
Extended Data Fig. 1
Extended Data Fig. 1. Information on cell lines, drugs and screen design.
a, OncoPrint detailing mutation status of three key mutations (TP53, KRAS, PIK3CA), MSI status, and clinical subtyping (PAM50 or CRIS where available) for all 125 cancer cell lines. b, Proportion of chemotherapeutic and targeted drugs screened. c, Proportion of drugs that are FDA-approved, in clinical trials, or are in development. d, Number of drugs screened per pathway and tissue. e, Schematic of anchored screening design. An anchor is tested at two fixed concentrations against a library screened at a 7-point, discontinuous 1,000-fold concentration range (two 2-fold dilution steps from the highest used concentration, all other dilution steps are 4-fold). f, Schematic of drug response curve fits of single-agent and combination responses. Vertical and horizontal lines are helper lines facilitating the reading of drug response metrics from the x-axis (concentration) and y-axis (viability), respectively. g, Schematic of synergy quantification based on efficacy (ΔEmax) or potency (ΔIC50). h, ΔEmax and ΔIC50 are normally distributed and only a minority meet synergy thresholds. Density distribution of ΔEmax (viability in %; left) and ΔIC50 (log2; right) across all combination responses. Vertical dashed lines represent synergy thresholds (ΔEmax ≥ 20% and ΔIC50  ≥ 3). n = 156,065 measurements in breast, n = 74,525 in colon, n = 66,117 in pancreas.
Extended Data Fig. 2
Extended Data Fig. 2. Screen quality control, single-agent response and combination response trends.
a, The coefficient of variation of the negative control DMSO across all 3,106 drug screening plates is low. Grey dashed line represents the quality control threshold of CV < 0.18. Median and interquartile range (IQR). b, The plate Z-factor scores for positive control drugs (MG-132, staurosporine) and blank wells across all drug screening plates. Grey dashed line represents the plate threshold of Z-factor > 0.3. Median and IQR. c, Single-agent and combination responses are well correlated across biological replicates (r > 0.6, p-value < 0.05) . Replicate data was collected over the duration of screening at various time points for 4-5 cell lines per tissue. Drug responses were averaged across technical replicates and correlated across biological replicates (n = 2–18, median = 4 biological replicates per ‘anchor concentration-library-cell line’ tuple) using Pearson correlation coefficient with Fisher’s Z transform as statistical test. d, Monotherapies captured an informative range of drug response at the concentration selected, generally having weak to moderate activity in cell lines. Median anchor (anchor viability by anchor concentration) and library (library Emax) responses across cell lines within a tissue. n = 26 drugs in colon and pancreas, n = 25 anchors and n = 52 libraries in breast. Median and IQR. e, Library IC50s were highly correlated with corresponding drug responses from the Genomics of Drug Sensitivity in Cancer, with IC50 on natural log scale. Pearson correlation coefficient, n = 4,338 drug-cell line pairs. f, Tissue accounts for some, but not all, variance in combination response. Dimensional reduction using t-SNE analysis on combination responses (ΔIC50) of 121 pan-tissue combinations across 125 cancer cell lines. g, h, Heatmaps of combination responses (ΔIC50) in 45 colon (g) or 29 pancreas (h) cell lines. Drug responses were clustered by combination and are annotated by combination type and anchor (An.) and library (Lib.) pathway. Rows are sorted by conditional mean ΔIC50 on cell line identity. n = 650 combinations. i, Heatmap of combination responses (ΔIC50) for 121 pan-tissue combinations across 125 breast, colon and pancreas cancer cell lines, clustered by combination and cell line. For all heatmaps ΔIC50 limits were clipped to −4 and 4.
Extended Data Fig. 3
Extended Data Fig. 3. Landscape of synergy.
a, Synergy is associated with weak to moderate single-agent drug activity. Single-agent activity (anchor low and high, library) of synergistic (n = 9,402) and non-synergistic (n = 287,305) measurements. Single-agent activity of synergistic measurements: Anchor high: 52 − 86% interquartile range (IQR), anchor low: 69 − 92% IQR, library: 53 − 80% IQR. Median and IQR. Two-sided Welch’s t-test. b, The relative rate of synergy for the 27 pan-tissue combinations with > 20% synergy in at least one tissue remains context-dependent upon variation of synergy thresholds. Three different synergy thresholds of ΔEmax (ΔE) and ΔIC50 (ΔI) were applied. Thresholds used in this study were, at either anchor concentration, combination IC50 or Emax was reduced 8-fold or 20% viability over Bliss, respectively (central panel), and here compared to less (left) or more (right) stringent thresholds. c, ΔIC50 correlates well between the original and the validation screen. Drug responses were averaged across replicates within a screen. n = 9,719 ‘library-anchor concentration-cell line’ tuples. Orange line represents linear fit. Pearson correlation coefficient and p-value. d, Single-agent and combination responses are well correlated between the original and validation screens. Drug responses were averaged across technical and biological replicates within a screen and correlated across screens. n > 3,000 ‘anchor concentration-library-cell line’ tuples. e, Synergy classification is consistent. The F-score as well as the recall and precision rates were calculated for validated responses in breast (yellow; n = 1,651), colon (green; n = 1,597) and pancreas (blue; n = 1,633). f, False positives (FP) and false negative (FN) synergistic measurements have borderline ΔIC50 and ΔEmax values close to the threshold for calling synergy (compared to true positive (TP) and true negative (TN)). Drug responses were averaged across replicates for each ‘anchor concentration-library-cell line’ tuple. Distance to the synergy threshold (log 2 normalised ΔIC50 ≥ 3 or ΔEmax ≥ 0.2) was determined for each synergistic measurement. Median and interquartile range (IQR). Two-sided Welch’s t-test. g, Combinations of two chemotherapeutics have lower combination responses. ΔIC50 and ΔEmax for chemotherapeutic+chemotherapeutic (C+C; n = 50), chemotherapeutic+targeted (C+T; n = 581) and targeted+targeted (T+T; n = 1,394) combinations. Median and IQR. ANOVA. h, AZD7762 has high synergy rates paired with certain chemotherapeutics. Synergy rate per tissue for AZD7762 paired with five chemotherapeutics in both anchor orientations. i, Several navitoclax+chemotherapeutic combinations have high synergy rates. Synergy rate per tissue for all combinations of navitoclax (anchor) paired with a chemotherapeutic (library). j, Inter-pathway targeting of MAPK and PI3K signalling leads to increased synergy effects. ΔIC50 per tissue for all combinations (All), inter-pathway MAPK and PI3K combinations (Inter), and intra-pathway combinations (Intra). Median and IQR. Two-sided Welch’s t-test, *: p-value ≤ 0.05, **: p-value ≤ 0.01, ***: p-value ≤ 0.001, ****= p < 0.0001. k, Combinations of MK-2206 (AKT1, AKT2) and MTOR inhibitors are highly synergistic in Her2 breast cancer cell lines. Synergy rate of MK-2206 (anchor) paired with OSI-027 or AZD8055 (libraries) across all breast cancer cell lines and PAM50 subtypes.
Extended Data Fig. 4
Extended Data Fig. 4. Landscape of biomarkers I.
a, Heatmap showing the distribution of 8,078 significant biomarkers across four inputs and four feature types. MOBEM: binary matrix of mutations, copy number alterations and methylations present in cell lines (see Methods for feature selection). b, Volcano plot of single-agent response biomarker associations tested (library IC50; n = 1,922,552; significant and large-effect biomarkers n = 3,280), with select statistically significant large-effect size biomarkers showing known single agent examples highlighted, namely BRAF mutation and dabrafenib sensitivity (purple), ERBB2 amplification and afatinib sensitivity (turquoise), PIK3CA mutation and taselisib sensitivity (orange), and TP53 mutation and resistance to nutlin-3a (yellow). Biomarkers identified using ANOVA test, p ≤ 0.001, FDR ≤ 5%, Glass deltas for positive and negative populations both ≥ 1. c, Volcano plot of biomarkers tested for associations with ΔEmax (n = 2,006,328), with significant and large-effect biomarkers (n = 761) coloured by analysis type. Examples discussed in the text and selected outliers are labelled. Biomarkers identified using ANOVA test, p ≤ 0.001, FDR ≤ 5%, Glass deltas for positive and negative populations both ≥ 1. d, Number of significant and large-effect biomarkers found per combination per context. Median and interquartile range (IQR). e, ΔIC50 drug combination response for irinotecan+AZD7762 in pancreatic cell lines with low expression of CDH1. n = 3 CDH1_down, n = 27 not CDH1_down. ANOVA, p ≤ 0.001, FDR ≤ 5%. Median and IQR. f, Drug combination responses for dabrafenib paired with EGFR inhibitors afatinib or sapitinib in BRAF wild-type (wt; n = 36) and mutant (mut, n = 11) colon cell lines. ΔEmax and ΔIC50 were averaged across replicates and highest response between anchor concentrations is reported. Two-sided Welch’s t-test. Median and IQR.
Extended Data Fig. 5
Extended Data Fig. 5. Landscape of biomarkers II.
a, Shortest distance in IntAct interactome between unique drug targets and biomarker features for combination metrics (ΔIC50 and ΔEmax biomarkers, n = 582) and single-agent library IC50 biomarkers (n = 124), split by whether the biomarker is associated with sensitivity or resistance. b, Shortest distance in Reactome interactome between unique drug targets and biomarker features for combination metrics (ΔIC50 and ΔEmax biomarkers, n = 420) and single-agent library IC50 biomarkers (n = 68), split by whether the biomarker is associated with sensitivity or resistance. c, Shortest distance in IntAct interactome between randomly shuffled unique drug targets and biomarker features for combination metrics (ΔIC50 and ΔEmax biomarkers, n = 589) and single-agent library IC50 biomarkers (n = 985), split by biomarker effect. d, Shortest distance in Reactome interactome between randomly shuffled unique drug targets and biomarker features for combination metrics (ΔIC50 and ΔEmax biomarkers, n = 422) and single-agent library IC50 biomarkers (n = 569), split by biomarker effect.
Extended Data Fig. 6
Extended Data Fig. 6. Populations of unmet clinical need.
a, b, 28 and 38 combinations are highly synergistic in KRAS mut (a) or MSS (b) colon cancer cell lines and some have ΔEmax or ΔIC50 biomarkers or are in clinical trials. Synergy rates of all colon combinations shown by KRAS mutant (mut; x-axis) versus wild-type (wt; y-axis;). b) or MSS (x-axis) versus MSI (y-axis; a). Colours represent biomarker or clinical trial presence. Vertical dashed line represents a synergy rate of 25% in MSS or KRAS mutant cell lines. n = 650 combinations. Pearson correlation with Fisher’s Z transform as statistical test. c, Loss of ERCC3 is associated with increased efficacy (ΔEmax) of linsitinib+MK-2206 in KRAS mutant colon (n = 20 wt; n = 5 loss). Median and interquartile range. p-value < 0.001, FDR < 0.05. d, Colon MSS cells show higher efficacy (ΔEmax) for AZD7762 (CHEK1/2) and camptothecin (TOP1). Drug combination responses were averaged across replicates and both anchor-library combination configurations were pooled (n = 31 MSS cell lines; n = 15 MSI cell lines). Median and interquartile range. Two-sided Welch’s t-test. e, AZD7762 and camptothecin have greater potency (ΔIC50) and efficacy (ΔEmax) in KRAS-TP53 double mutant colon cancer cells (n = 8 KRAS mutant & TP53 wild-type cell lines (wt); n = 16 KRAS-TP53 double mutant cell lines (mut)). Drug combination responses were averaged across replicates and both combination configurations were pooled. Median and interquartile range. Two-sided Welch’s t-test.
Extended Data Fig. 7
Extended Data Fig. 7. In vitro validation of combined targeting of TOP1 and CHEK1 in colon cancer.
a, Combination response is mostly CHEK1 specific. SW837 and SNU-81 cells were reverse transfected with pooled siRNA against CHEK1, CHEK2 or PLK1 (positive control), and 0.025 µM SN-38 was added 30 h later. Viability was measured with CellTiter-Glo (CTG) after 72 h of drug treatment. Signal was normalised to non-targeting siRNA (siNT)+DMSO controls. Median and interquartile range. Two-sided Welch’s t-test, *= p ≤ 0.05, **= p ≤ 0.01, ***= p ≤ 0.001, ****= p ≤ 0.0001. b, CHEK1 and CHEK2 knockdown confirmation by Western blotting. SW837 and SNU-81 cells were reverse transfected with siRNAs (40 nM) and knockdown was examined after 72 h. Western blot is a representative of two independent experiments. For gel source data, see Supplementary Fig. 1. Some knockdown of CHEK2 was observed in SW837 cells with CHEK1 siRNA pool. c, CHEK1 specificity of combination response is confirmed with individual siRNAs against CHEK1. SW837 and SNU-81 cells were reverse transfected with pooled or four individual siRNA against CHEK1 and 0.025 µM SN-38 were added 30 h later. Viability was measured with CellTiter-Glo after 72 h of drug treatment. Signal was normalised to siNT+DMSO controls. Median and interquartile range. Two-sided Welch’s t-test, *= p ≤ 0.05, **= p ≤ 0.01, ***= p ≤ 0.001, ****= p ≤ 0.0001. d, CHEK1 knockdown confirmation by Western blotting. SW837 and SNU-81 cells were reverse transfected with pooled or four individual siRNAs (40 nM) against CHEK1 and knockdown was examined after 72 h. Western blot is a representative of two independent experiments. For gel source data, see Supplementary Fig. 1. e, CHEK1 (but not CHEK2) silencing by siRNA significantly shifts and reduces the IC50 of SN-38 (SNU-81: 7.2-fold (IC50 siNT: 611.1 nM; siCHEK1: 84.4 nM (p = 0.0013); siCHEK2: 714.7 nM (p = 0.339)); SW837: 120-fold (IC50 siNT: 84.4 nM; siCHEK1: 0.69 nM (p = 0.0019); siCHEK2: 66.6 nM (p = 0.091)). SW837 and SNU-81 cells were reverse transfected with siRNAs and the following day cells were treated with a dose range of SN-38 (0.001–9  μM). Viability was assessed after 72 h using CellTiter-Glo. Signal was normalised to siNT+DMSO controls. Mean ± SD. Two-way ANOVA. f, Combination of rabusertib (CHEK1) and SN-38 reduces colony formation. Colon cancer cells were seeded and treated with drugs (0.1 nM SN-38, 0.5 μM rabusertib, 0.5 μM CCT241533) or DMSO for 14 days. CCT241533 is a CHEK2 selective inhibitor. Representative pictures of three experiments. g, Combination of rabusertib and SN-38 leads to caspase-mediated cell death. Colon cancer cells were seeded and treated with drugs (0.125 μM staurosporine (positive control), 0.025 μM SN-38, 0.75 μM rabusertib, 0.75 μM CCT241533) or DMSO in the presence of fluorescent reagents (CellTox-Green for cell death and IncuCyte Caspase-3/7 Red for caspase activity). Pictures were taken every 2 h for 96 h on the IncuCyte and fluorescent signals were measured as mean intensity per area and normalised to time 0 h. Mean of three independent experiments. h, Combined TOP1 and CHEK2 inhibition leads to mostly less than additive combination response. Cell death was measured by CellTox-Green signal (CTOX; in green calibrated units (GCU)) after 72 h of treatment with SN-38 (TOP1; 0.025 µM) and CCT241533 (CHEK2; 0.75 µM). Drug responses are mean across 3-4 biological replicates. Additive response: sum of SN-38 and rabusertib responses. Delta: observed - additive response. i, Combined TOP1 and CHEK1 inhibition results in PARP cleavage in SNU-81 cells. SNU-81 cells were treated with drugs for 96 h. Western blot is a representative of three repeated experiments. +: positive control (MG-132; 2 µM); -: negative control (DMSO; 1:1,000); SN-38 (0.025 µM); Rab: rabusertib (1.5 µM); CCT: CCT241533 (1.5 µM). Source data
Extended Data Fig. 8
Extended Data Fig. 8. In vivo validation of combined targeting of irinotecan and CHEK1 in colon cancer.
a, Addition of rabusertib increases irinotecan response in two of three colon cancer xenograft models. NOD/scid mice were engrafted with colon cancer cell lines and treated with irinotecan (25 mg/kg twice a week) +/- rabusertib (200 mg/kg daily) for 24–35 days. Shown is average tumour volume change under treatment. LS-1034: n = 6 mice for vehicle, n = 11 for irinotecan, n = 12 for rabusertib and irinotecan+rabusertib. SW837: n = 6 mice for vehicle and rabusertib, n = 8 for irinotecan, n = 4 for irinotecan+rabusertib. SNU-81: n = 5 mice for vehicle and irinotecan+rabusertib, n = 6 for rabusertib, n = 10 for irinotecan. Two-way ANOVA. b, Treatment of rabusertib with irinotecan decreases proliferation. LS-1034 cells were engrafted and treated as described in (a). Tumours were collected 72 h after treatment start and stained for Ki67 (proliferative cells). n = 30 for vehicle, rabusertib and irinotecan+rabusertib; n = 25 for irinotecan. Mean ± SD. Two-tailed unpaired Welch’s t-test. Source data

References

    1. Al-Lazikani B, Banerji U, Workman P. Combinatorial drug therapy for cancer in the post-genomic era. Nat. Biotechnol. 2012;30:679–692. - PubMed
    1. Lopez JS, Banerji U. Combine and conquer: challenges for targeted therapy combinations in early phase trials. Nat. Rev. Clin. Oncol. 2017;14:57–66. - PMC - PubMed
    1. Kopetz S, et al. Encorafenib, binimetinib, and cetuximab in BRAF V600E-mutated colorectal cancer. N. Engl. J. Med. 2019;381:1632–1643. - PubMed
    1. Menden MP, et al. Community assessment to advance computational prediction of cancer drug combinations in a pharmacogenomic screen. Nat. Commun. 2019;10:2674. - PMC - PubMed
    1. Iorio F, et al. A landscape of pharmacogenomic interactions in cancer. Cell. 2016;166:740–754. - PMC - PubMed

Publication types

MeSH terms

Substances