. 2022 Mar;603(7900):290-296.
doi: 10.1038/s41586-022-04430-9. Epub 2022 Feb 23.

Ancient DNA and deep population structure in sub-Saharan African foragers

Affiliations

Ancient DNA and deep population structure in sub-Saharan African foragers

Mark Lipson et al. Nature. 2022 Mar.

Abstract

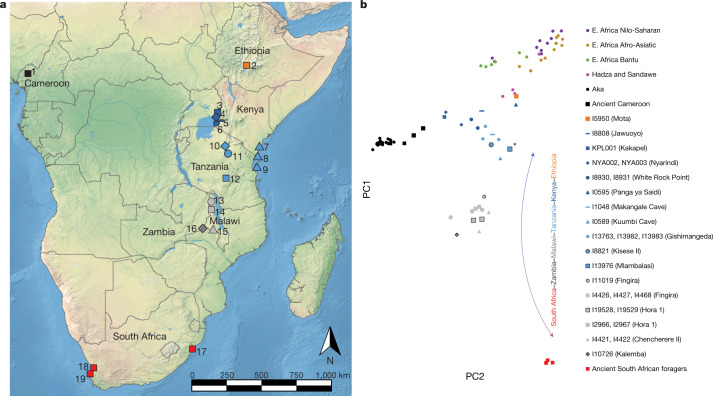
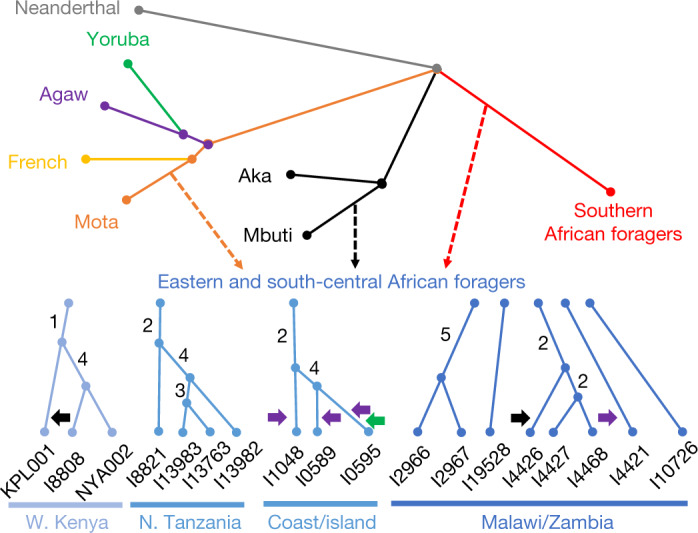
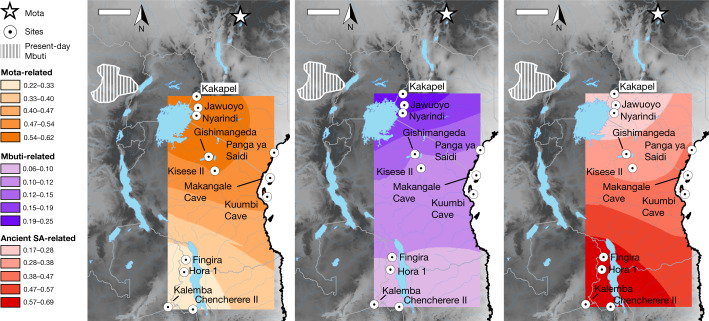
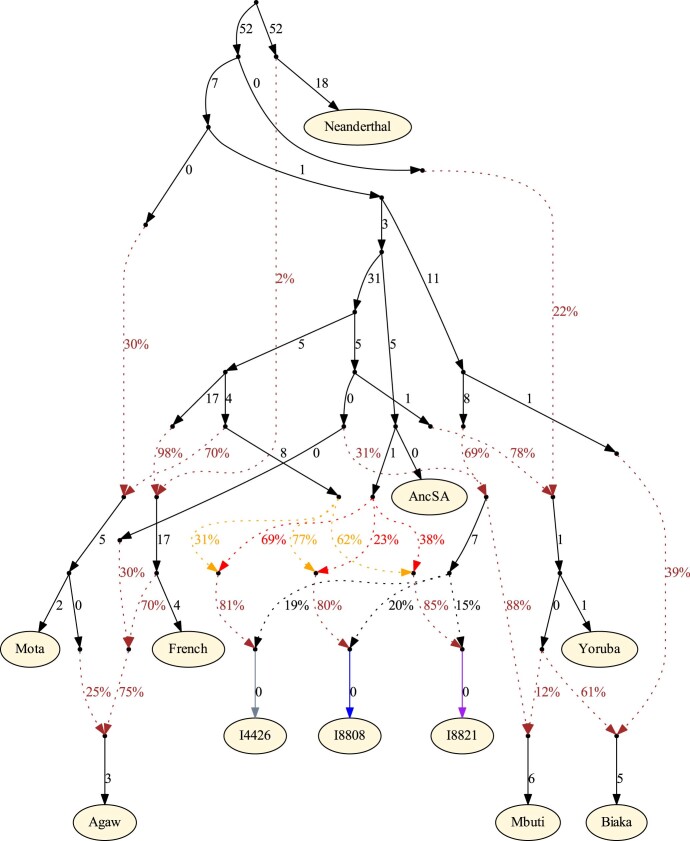
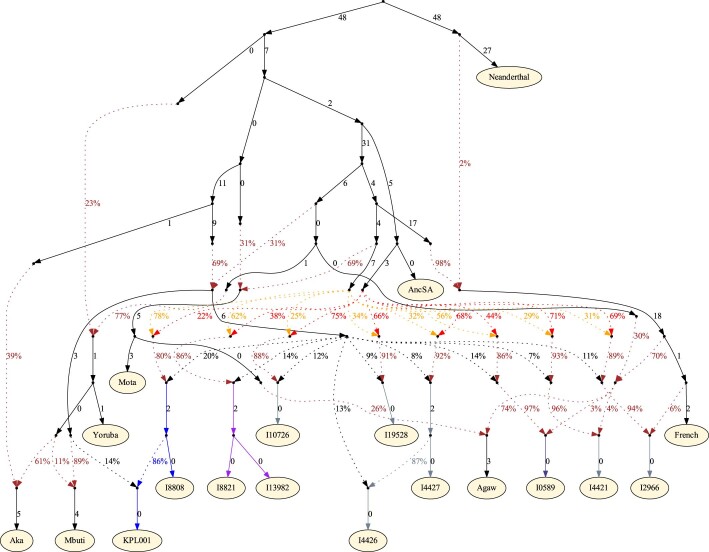
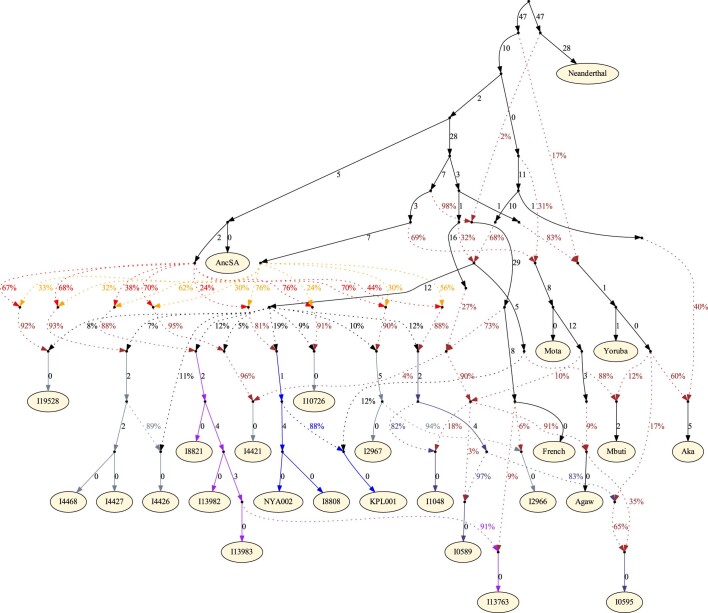
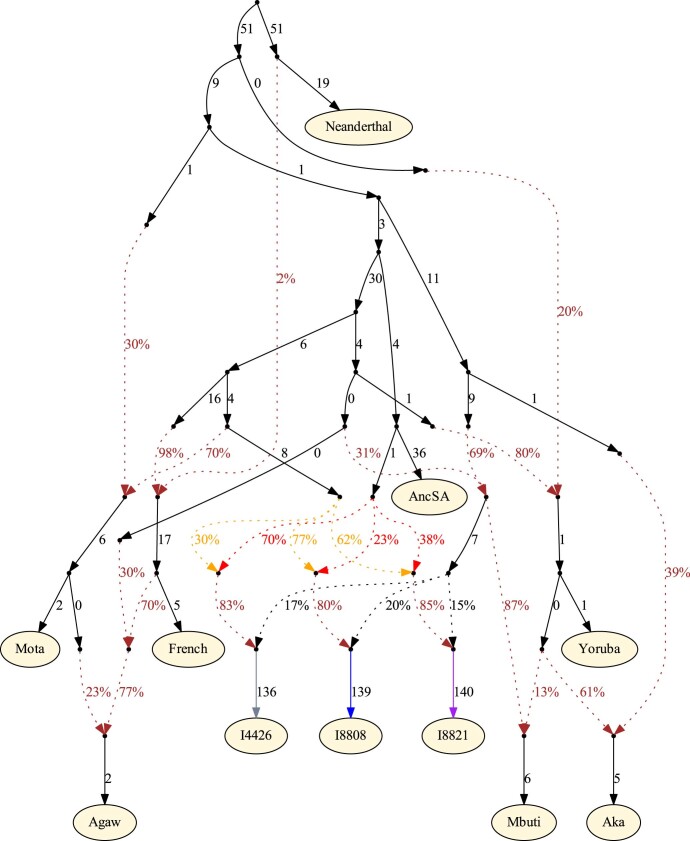
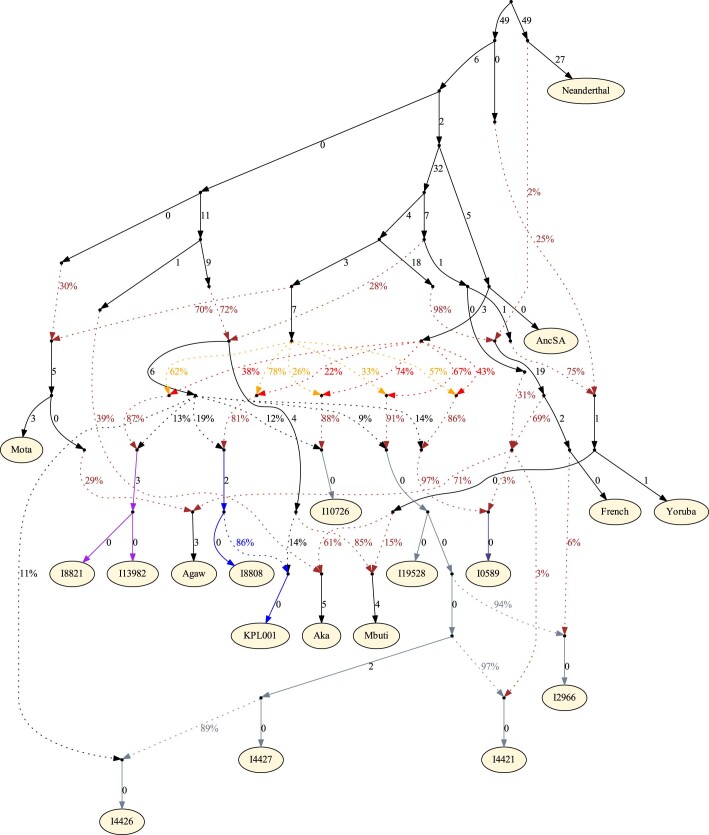
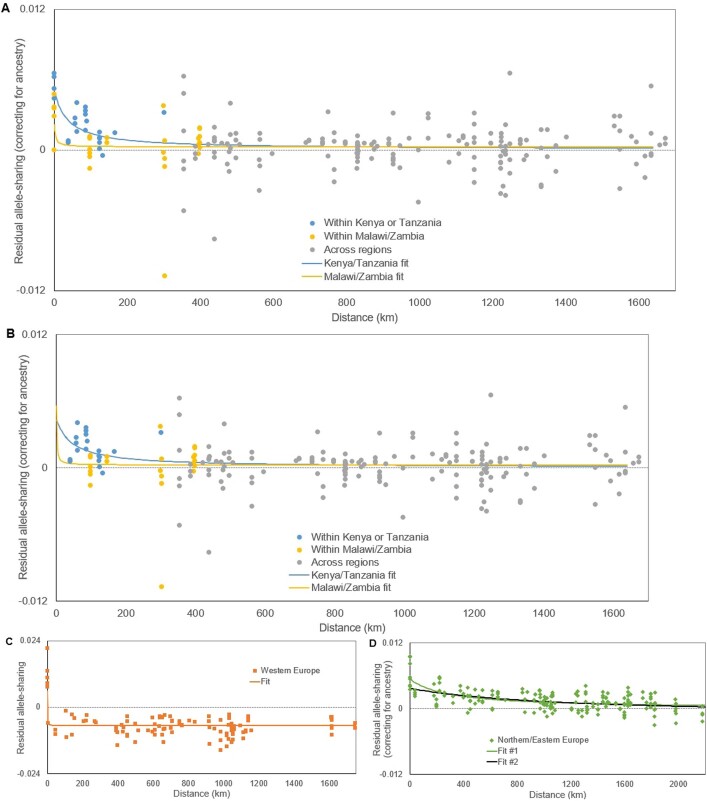
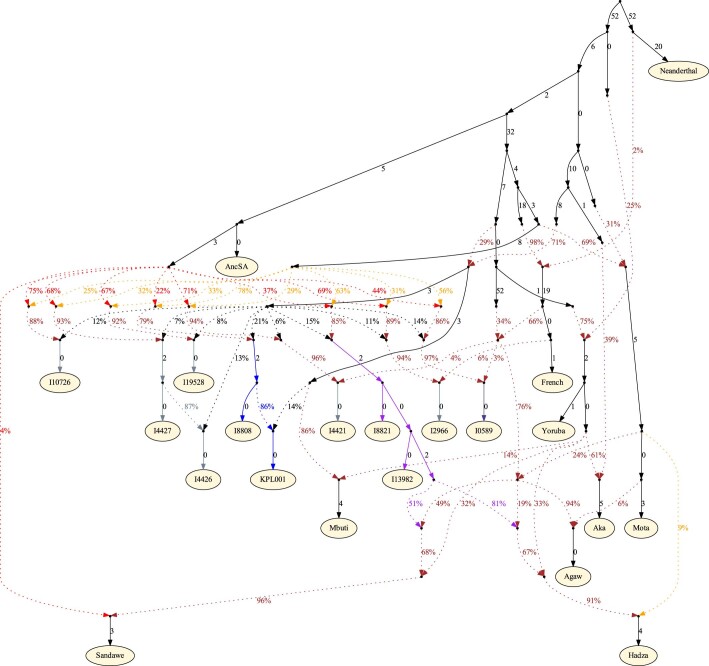
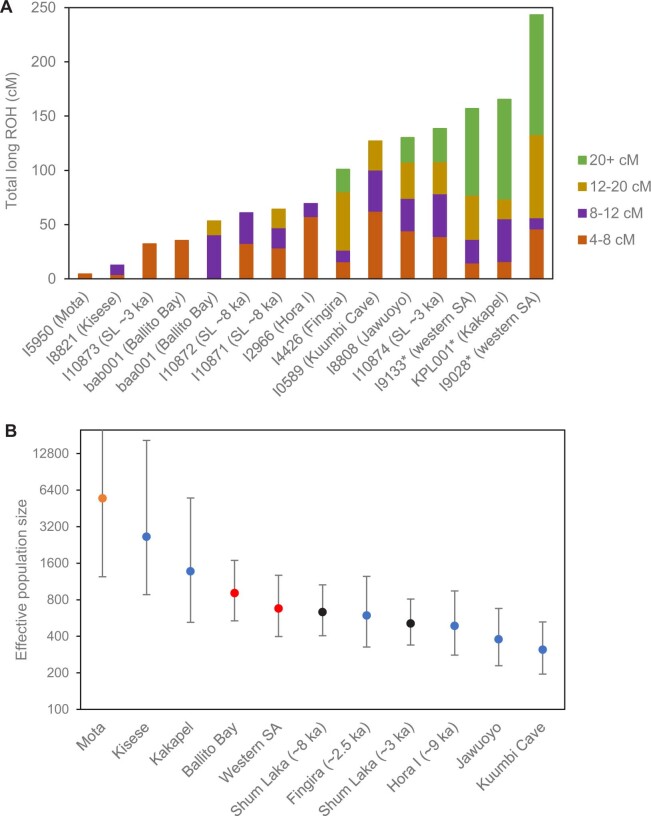
Multiple lines of genetic and archaeological evidence suggest that there were major demographic changes in the terminal Late Pleistocene epoch and early Holocene epoch of sub-Saharan Africa1-4. Inferences about this period are challenging to make because demographic shifts in the past 5,000 years have obscured the structures of more ancient populations3,5. Here we present genome-wide ancient DNA data for six individuals from eastern and south-central Africa spanning the past approximately 18,000 years (doubling the time depth of sub-Saharan African ancient DNA), increase the data quality for 15 previously published ancient individuals and analyse these alongside data from 13 other published ancient individuals. The ancestry of the individuals in our study area can be modelled as a geographically structured mixture of three highly divergent source populations, probably reflecting Pleistocene interactions around 80-20 thousand years ago, including deeply diverged eastern and southern African lineages, plus a previously unappreciated ubiquitous distribution of ancestry that occurs in highest proportion today in central African rainforest hunter-gatherers. Once established, this structure remained highly stable, with limited long-range gene flow. These results provide a new line of genetic evidence in support of hypotheses that have emerged from archaeological analyses but remain contested, suggesting increasing regionalization at the end of the Pleistocene epoch.


Conflict of interest statement

The authors declare no competing interests.

Figures

Fig. 1
Fig. 1. Locations of the individuals analysed and PCA analysis.
a, Locations of individuals analysed in this study. The shapes and colours of the symbols correspond to the PCA in b. 1, Shum Laka; 2, Mota Cave; 3, Kakapel RS (Rockshelter); 4, Nyarindi RS; 5, Jawuoyo RS; 6, White Rock Point; 7, Panga ya Saidi; 8, Makangale Cave; 9, Kuumbi Cave; 10, Gishimangeda Cave; 11, Kisese II RS; 12, Mlambalasi RS; 13, Fingira; 14, Hora 1; 15, Chencherere II; 16, Kalemba RS; 17, Ballito Bay; 18, Faraoskop RS; 19, St Helena. b, PCA results. Axes were computed using present-day groups from eastern (Dinka pastoralists), southern (Juǀ'hoansi foragers) and central Africa (Mbuti foragers). Small circles represent present-day individuals; other symbols represent ancient individuals (larger points corresponding to earlier individuals and black outlines to newly reported individuals). The lowest-coverage individual (from Mlambalasi), shown with an asterisk, has the most uncertain position. The base map in a is from Natural Earth (https://www.naturalearthdata.com). E., east.
Fig. 2
Fig. 2. Schematic of admixture graph results.
Branch lengths are not to scale. The arrows denote admixture events, with the three primary components of ancestry shown as dashed arrows, and other inferred gene flow as small solid arrows (with colours corresponding to related groups). Subclusters of ancient eastern and south-central African foragers reflect the inferred instances of excess relatedness among individuals, with internal branch lengths shown in genetic-drift units. Mixture proportions are shown in Fig. 3 and Supplementary Table 9 and the full results are shown in Extended Data Fig. 4. Individual laboratory numbers are shown at the bottom (Extended Data Table 1). N., north; W., west.
Fig. 3
Fig. 3. Distribution of main ancestry components.
Kriged distribution of the proportions of each of the three main ancestry components (summing to 1) found in ancient eastern and south-central African foragers analysed in this study (details are provided in Supplementary Table 9). The approximate present-day Mbuti home region is from ref. . Individuals from the same site were included using locations that differed by 0.000001 decimal degrees latitude to ensure representation in the interpolation. Scale bars, 250 km. Topographical data are from the Shuttle Radar Topography Mission (SRTM). SA, southern African.
Extended Data Fig. 1
Extended Data Fig. 1. Sex chromosome ratios and kinship analysis.
A, Sex chromosome ratios. For each library, we show the proportion of reads aligning to chromosome Y of the total aligning to either X or Y; individuals determined to be genetically female to the left and males to the right. Bars show 95% binomial confidence intervals (normal approximation) around the mean. See also Supplementary Table 2 and Supplementary Note 5. B, Kinship analysis. Different-individual allelic mismatch rates (orange points) are mostly approximately twice as high as same-individual rates (blue points), as expected for unrelated individuals. The labelled pair (I8930 and I8931, both from White Rock Point), have a rate that is roughly seven-eighths that of the other pairs, which would correspond to a second-degree familial relationship (but with relatively high uncertainty given the low SNP coverage). Bars show two standard errors in each direction around the mean as determined by a Block Jackknife; note log scale for the x-axis.
Extended Data Fig. 2
Extended Data Fig. 2. Full admixture graph results for Model 1.
Branch lengths are shown in units of average squared allele frequency divergence (multiplied by 1000, rounded to the nearest integer). All predicted and observed f-statistics agree to within Z = 2.0. AncSA = ancient southern African foragers.
Extended Data Fig. 3
Extended Data Fig. 3. Full admixture graph results for Model 2.
Branch lengths are shown in units of average squared allele frequency divergence (multiplied by 1000, rounded to the nearest integer). All predicted and observed f-statistics agree to within Z = 3.0. AncSA = ancient southern African foragers.
Extended Data Fig. 4
Extended Data Fig. 4. Full admixture graph results for Model 3.
Branch lengths are shown in units of average squared allele frequency divergence (multiplied by 1000, rounded to the nearest integer). All predicted and observed f-statistics agree to within Z = 3.7. AncSA = ancient southern African foragers.
Extended Data Fig. 5
Extended Data Fig. 5. Admixture graph results for a version of Model 1 using only overlapping SNPs (without the qpfstats program).
Branch lengths are shown in units of average squared allele frequency divergence (multiplied by 1000, rounded to the nearest integer). All predicted and observed f-statistics agree to within Z = 2.0. AncSA = ancient southern African foragers.
Extended Data Fig. 6
Extended Data Fig. 6. Admixture graph results for a version of Model 2 with the Malawi individuals fit using a shared three-way admixture clade.
Branch lengths are shown in units of average squared allele frequency divergence (multiplied by 1000, rounded to the nearest integer). All predicted and observed f-statistics agree to within Z = 2.9. AncSA = ancient southern African foragers.
Extended Data Fig. 7
Extended Data Fig. 7. Excess relatedness as a function of geographical distance.
Each point represents the model residual for one pair of individuals. The lines show best-fitting curves of the functional form y = 1/kx (allowing for horizontal and vertical translation). See Methods for details. A, B: Eastern and south-central Africa, with same-site pairs omitted from the analysis in B (grey: different sub-regions; blue: both Kenya, both Tanzania, or both coastal; yellow: both Malawi/Zambia). C: Western Europe. Note the different y-axis range. D: Northern and eastern Europe, where fit #1 includes all pairs, while fit #2 omits same-site pairs.
Extended Data Fig. 8
Extended Data Fig. 8. Admixture graph results for a version of Model 2 with Hadza and Sandawe added.
Branch lengths are shown in units of average squared allele frequency divergence (multiplied by 1000, rounded to the nearest integer). All predicted and observed f-statistics agree to within Z = 3.2. AncSA = ancient southern African foragers.
Extended Data Fig. 9
Extended Data Fig. 9. ROH and effective population sizes.
A: total lengths of ROH per individual in segments of > 4 cM, divided by colours into length bins. Asterisks denote individuals with evidence of familial relatedness between parents. B: estimated recent effective population sizes by individual or group (note log scale). Colours correspond to those in Fig. 1. Bars show 95% confidence intervals centred around the maximum likelihood estimate, reflecting uncertainty in our inferences due to the limited number in the number of ROH segments available for analysis; see Methods for details. SL, Shum Laka; western SA, western South African sites Faraoskop and St Helena.

References

    1. Tryon CA. The Middle/Later Stone Age transition and cultural dynamics of late Pleistocene East Africa. Evol. Anthropol. Issues News Rev. 2019;28:267–282. - PubMed
    1. Mirazón Lahr M. The shaping of human diversity: filters, boundaries and transitions. Philos. Trans. R. Soc. B. 2016;371:20150241. - PMC - PubMed
    1. Hollfelder N, Breton G, Sjödin P, Jakobsson M. The deep population history in Africa. Hum. Mol. Genet. 2021;30:R2–R10. - PMC - PubMed
    1. Miller JM, Wang YV. Ostrich eggshell beads reveal 50,000-year-old social network in Africa. Nature. 2021;601:234–239. - PMC - PubMed
    1. Vicente M, Schlebusch CM. African population history: an ancient DNA perspective. Curr. Opin. Genet. Dev. 2020;62:8–15. - PubMed

Publication types