. 2022 Mar;603(7899):119-123.
doi: 10.1038/s41586-022-04428-3. Epub 2022 Feb 23.

A biophysical account of multiplication by a single neuron

Affiliations

A biophysical account of multiplication by a single neuron

Lukas N Groschner et al. Nature. 2022 Mar.

Abstract

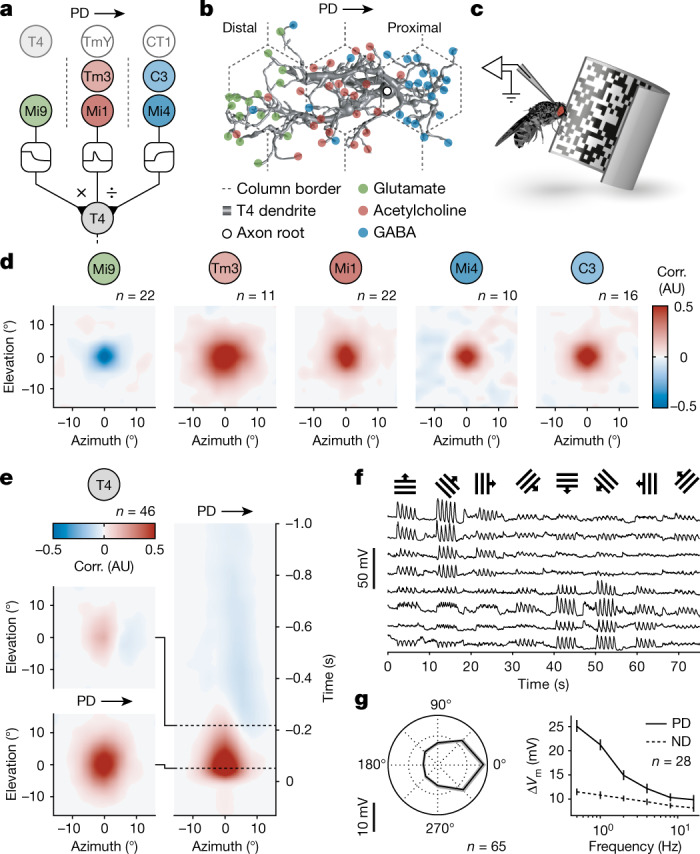
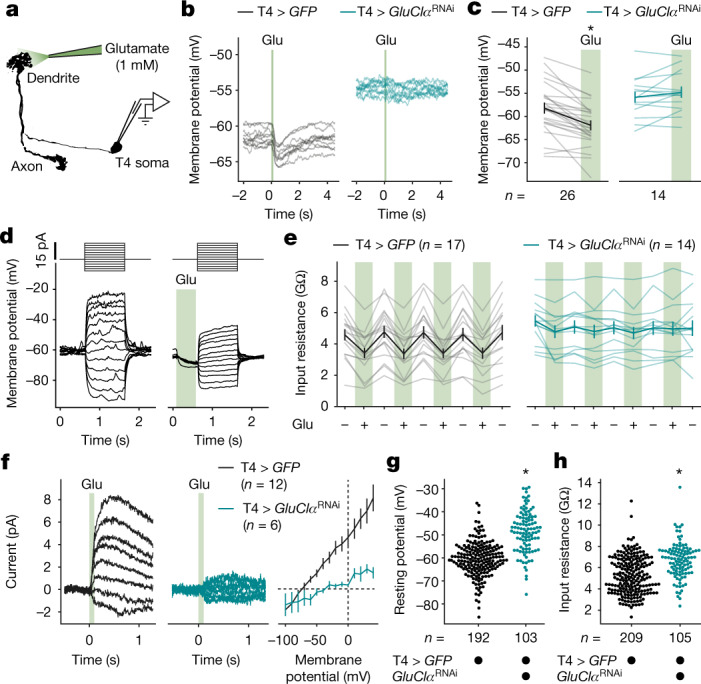
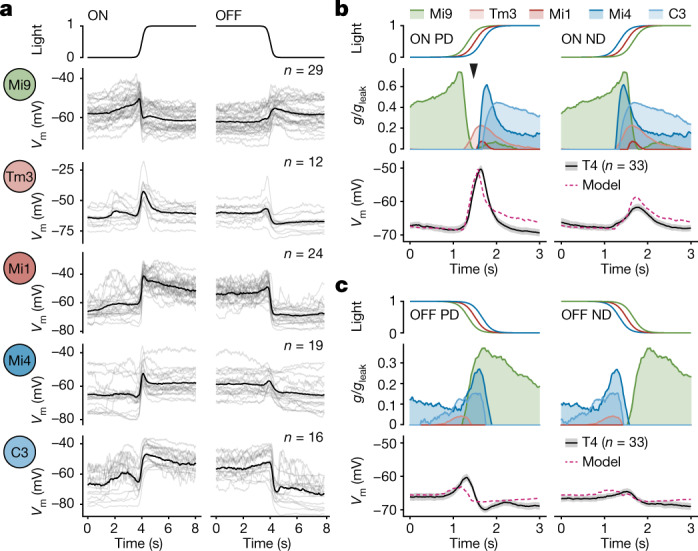
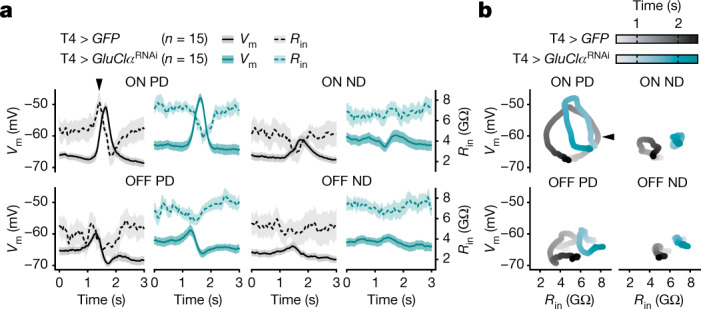
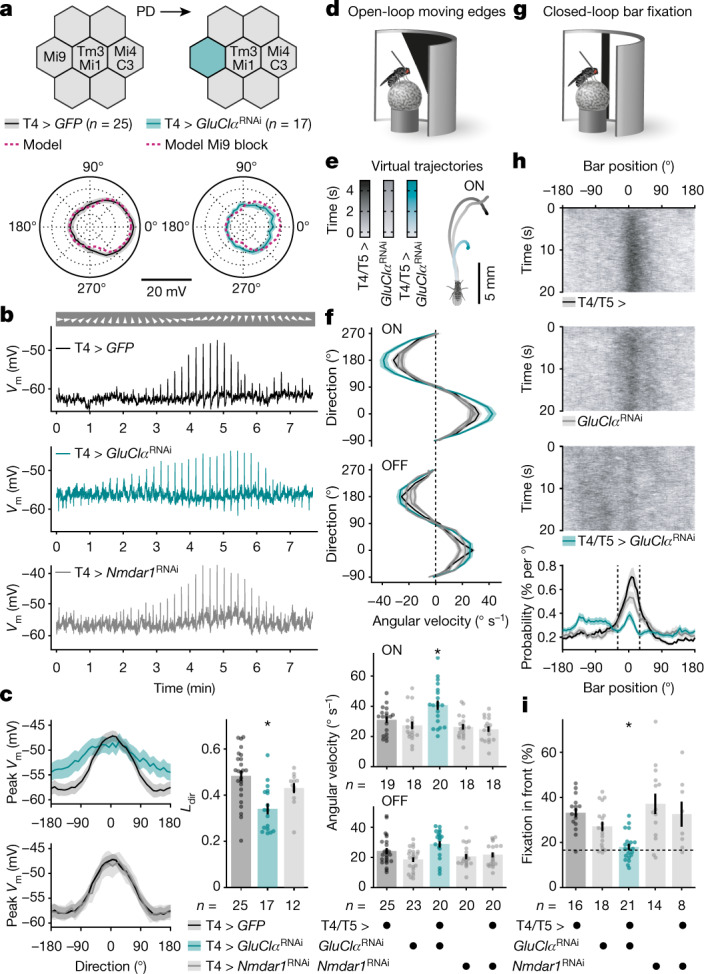
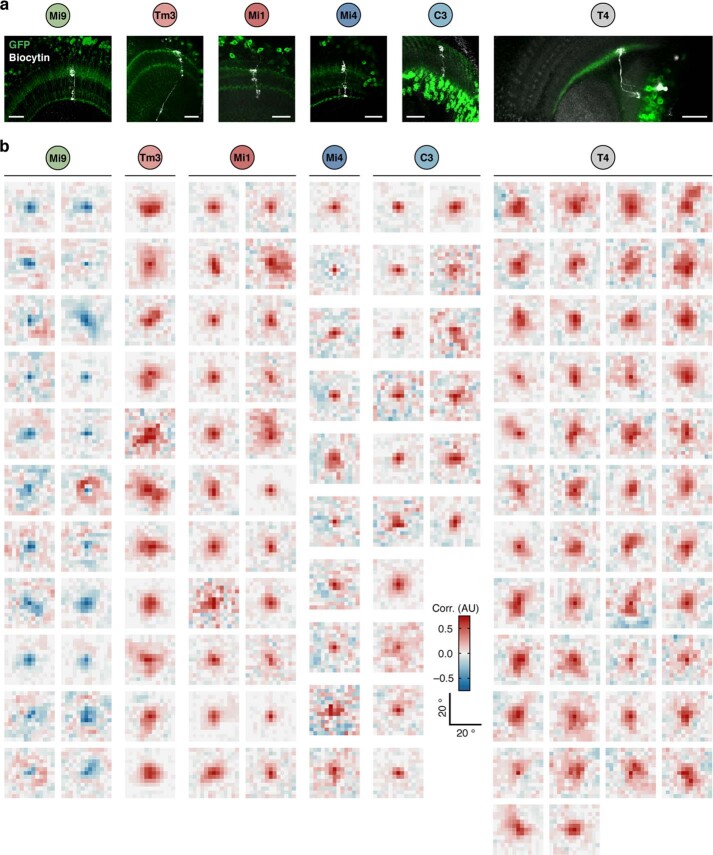
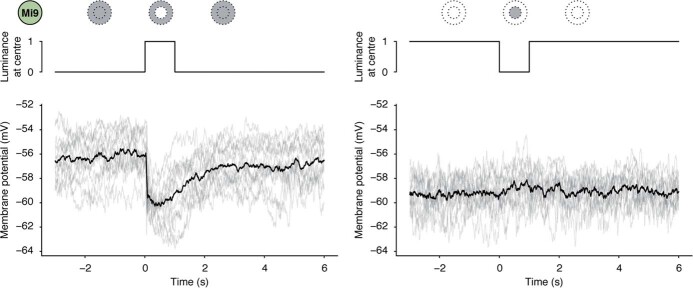
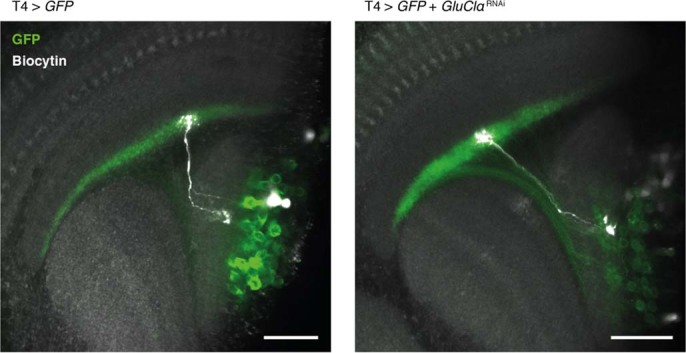
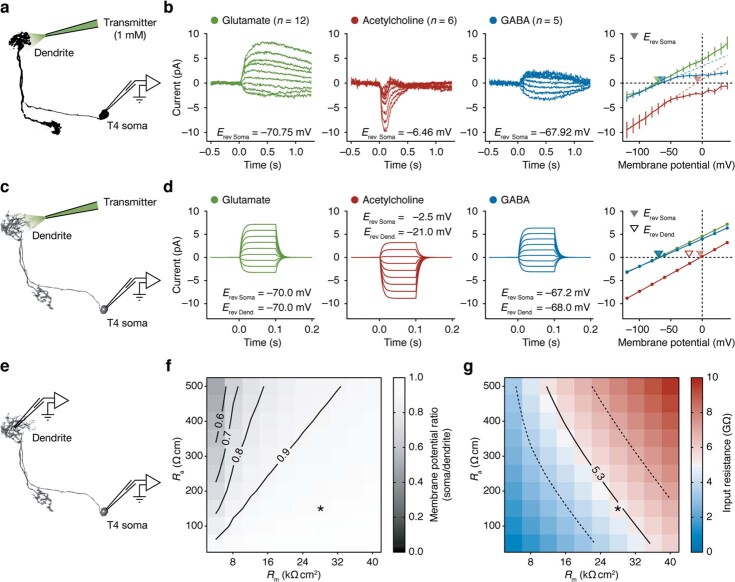
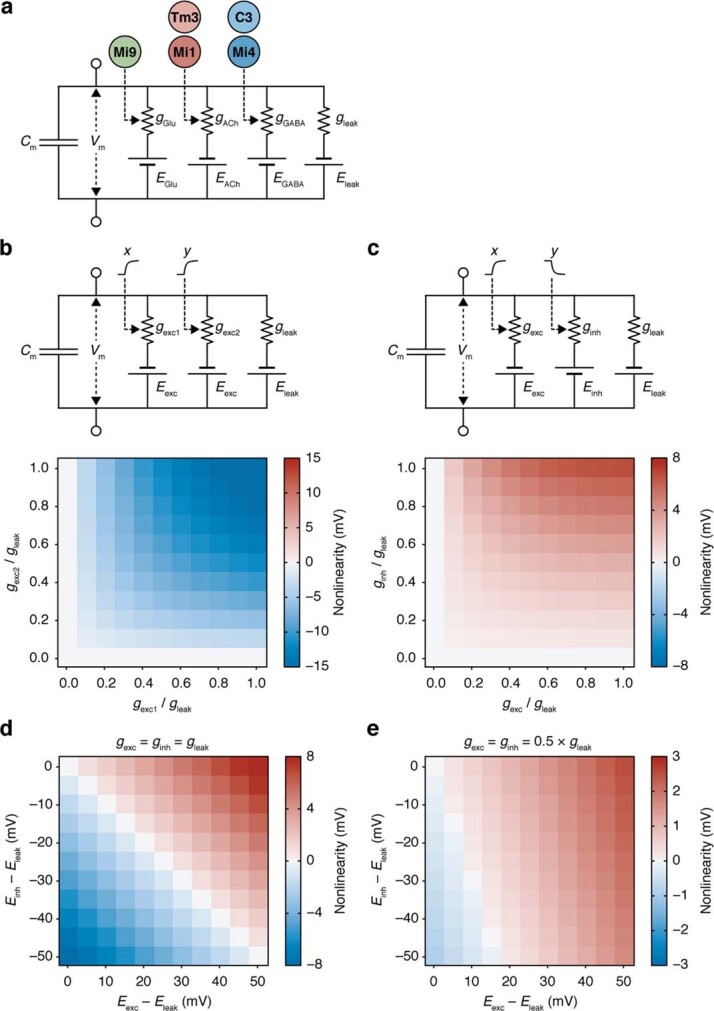
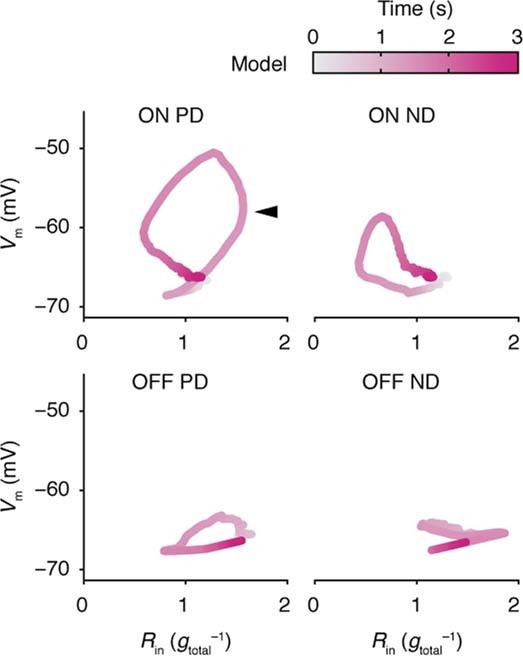
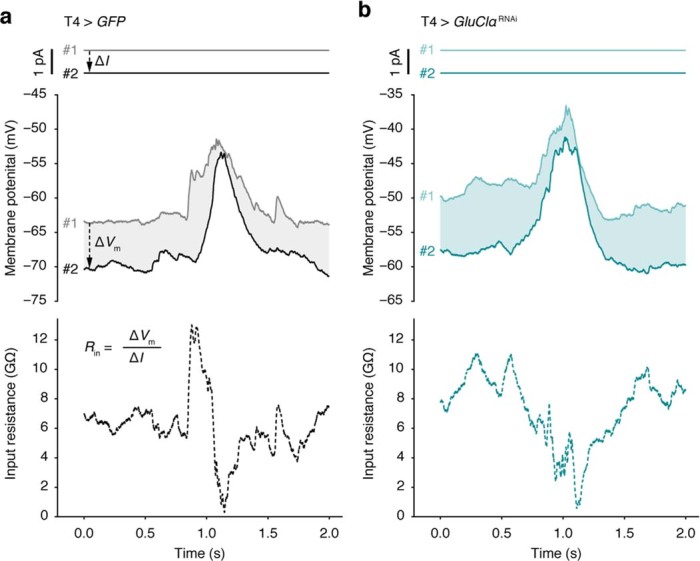
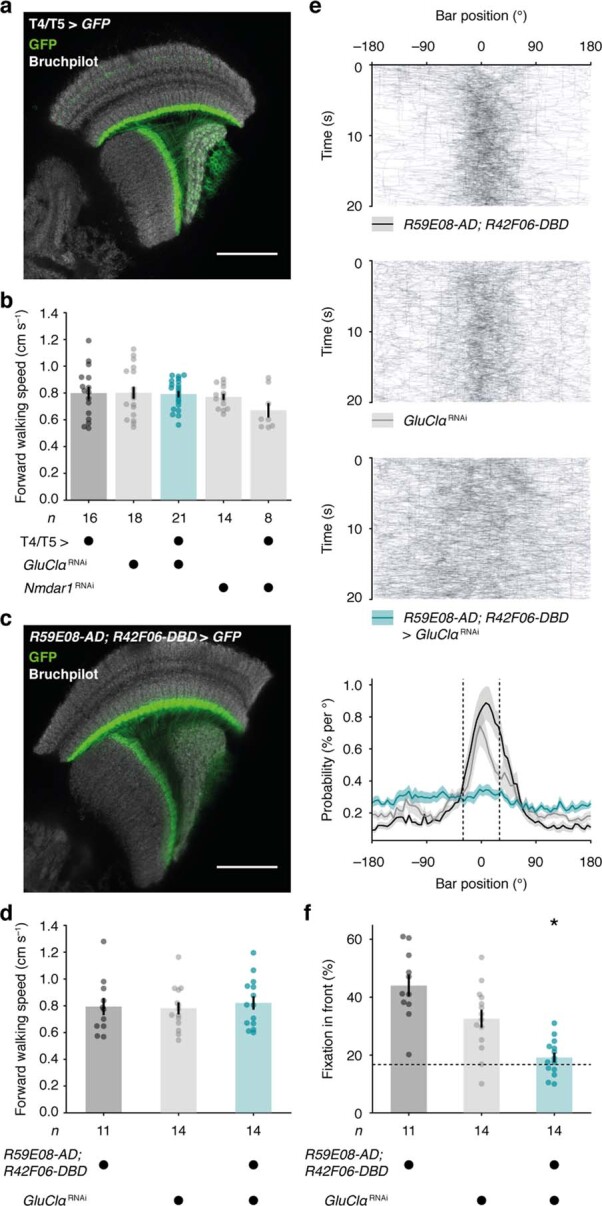
Nonlinear, multiplication-like operations carried out by individual nerve cells greatly enhance the computational power of a neural system1-3, but our understanding of their biophysical implementation is scant. Here we pursue this problem in the Drosophila melanogaster ON motion vision circuit4,5, in which we record the membrane potentials of direction-selective T4 neurons and of their columnar input elements6,7 in response to visual and pharmacological stimuli in vivo. Our electrophysiological measurements and conductance-based simulations provide evidence for a passive supralinear interaction between two distinct types of synapse on T4 dendrites. We show that this multiplication-like nonlinearity arises from the coincidence of cholinergic excitation and release from glutamatergic inhibition. The latter depends on the expression of the glutamate-gated chloride channel GluClα8,9 in T4 neurons, which sharpens the directional tuning of the cells and shapes the optomotor behaviour of the animals. Interacting pairs of shunting inhibitory and excitatory synapses have long been postulated as an analogue approximation of a multiplication, which is integral to theories of motion detection10,11, sound localization12 and sensorimotor control13.


Conflict of interest statement

The authors declare no competing interests.

Figures

Fig. 1
Fig. 1. Receptive fields of direction-selective T4 neurons and their presynaptic partners.
a, The circuit architecture for visual ON motion detection involving a multiplicative interaction (×) between synapses of glutamatergic Mi9 and synapses of cholinergic Mi1/Tm3 neurons and a divisive interaction (÷) between synapses of Mi1/Tm3 and synapses of GABAergic C3/Mi4 neurons. Non-columnar inputs from T4, TmY15 and CT1 neurons are shaded. The dashed lines show the column borders. b, A T4 dendrite with subcellular segregation of glutamatergic (green), cholinergic (red) and GABAergic synapses (blue). Data from ref. . c, Targeted patch-clamp recording in vivo during visual stimulation. d, Average spatial receptive fields of input neuron classes obtained by reverse correlation (corr.) of membrane potentials and white-noise stimuli. AU, arbitrary units. e, The average spatial receptive fields of T4 neurons (left) representing cross-sections of the spatiotemporal receptive field (right) at two time points (dashed lines). f, Exemplary membrane potential recordings of T4 neurons in response to visual stimulation with square-wave gratings moving in the directions indicated on top. g, Directional (left) and frequency tuning (right) of T4 neurons based on the change in membrane potential (∆Vm) in response to visual stimulation with square-wave gratings. Data are mean ± s.e.m. n values indicate the number of cells. Source data.
Fig. 2
Fig. 2. Glutamate controls T4 neuron excitability through GluClα.
a, Glutamate application during whole-cell recording. b, Membrane potential traces of exemplary T4 neurons in response to 100 ms glutamate pulses (Glu) in flies expressing GFP (black; T4 > GFP, full genotypes are provided in the Methods) or GFP + GluClαRNAi (teal; T4 > GluClαRNAi) under T4-cell-specific GAL4 control. Ten technical replicates per genotype are shown. c, The average membrane potentials of T4 neurons expressing GFP (black) or GFP + GluClαRNAi (teal) before and after glutamate application (green). A significant effect of glutamate, determined using a two-tailed paired Student’s t-test, is indicated; *P = 2.1 × 10−6. The light lines represent individual cells. The dark lines represent the mean ± s.e.m. d, Voltage responses of one exemplary T4 neuron to current steps (top) without (left) and with (right) prior glutamate application. e, Input resistances of T4 neurons expressing GFP (black) or GFP + GluClαRNAi (teal) during (+) and in between (–) repeated glutamate applications. The light lines represent individual cells. The dark lines represent the mean ± s.e.m. Two-way repeated-measures analysis of variance (ANOVA) detected a significant effect of glutamate (P = 3.5 × 10–12) and a significant glutamate × genotype interaction (P = 1.6 × 10–11). f, Average whole-cell currents in response to 100 ms glutamate pulses at different voltages (left and middle) and current–voltage relationships (right) of T4 neurons expressing GFP (black) or GFP + GluClαRNAi (teal). Data are mean ± s.e.m. g, h, Resting membrane potentials (g) and input resistances (h) of T4 neurons expressing GFP (black) or GFP + GluClαRNAi (teal) measured under dark conditions. Significant differences between genotypes, determined using two-tailed Mann–Whitney U-tests, are indicated; *P = 3.4 × 10−23 (g), *P = 4.8 × 10–11(h). n values indicate the number of cells. Source data.
Fig. 3
Fig. 3. Conductance-based T4 neuron model.
a, Aligned membrane voltage (Vm) responses of columnar T4 input neurons to ON and OFF edges moving at 30° s−1. Time course of normalized light intensity at the receptive field centre is shown at the top. The light lines represent individual cells. The dark lines represent the mean. b, c, Conductance-based biophysical simulations of the membrane voltage (Vm) of a T4 neuron in response to ON (b) and OFF (c) edge motion. Input signals were time-shifted, as evident from light intensities at receptive field centres (top), to simulate visual motion in the T4 neuron’s PD and ND, respectively. The voltage signals of presynaptic neurons were converted into normalized postsynaptic conductances (g/gleak, centre) using a threshold and gain obtained by fitting the model (dashed pink) to measured T4 voltage responses (solid black, bottom). Conductance values are mean and area under curve. Voltage values are mean ± s.e.m. The arrowhead in b marks the window of opportunity when a minimum of shunting inhibition (green/blue) coincides with excitation (red). n values indicate the number of cells. Source data.
Fig. 4
Fig. 4. A GluClα-dependent input resistance peak.
a, Simultaneously measured membrane potentials (Vm, solid lines) and input resistances (Rin, dashed lines) of T4 neurons expressing GFP (black) or GFP + GluClαRNAi (teal) in response to ON (top) and OFF (bottom) edges moving at 30° s−1 in the neurons’ PD and ND. Data are mean ± s.e.m. n values indicate the number of cells. b, The average membrane potential (Vm) as a function of input resistance (Rin) of T4 neurons shown in a in response to ON (top) and OFF (bottom) edges moving in the PD (left) and ND (right). The arrowheads mark the input resistance peak. Source data.
Fig. 5
Fig. 5. GluClα sharpens directional tuning of T4 neurons and optomotor behaviour.
a, T4 input organization in the presence (top left) and absence of Mi9 neurons (top right). Bottom, directional tuning of T4 neurons expressing GFP (black) or GFP + GluClαRNAi (teal) on the basis of membrane potential responses to ON edges moving at 30° s−1. Data are mean ± s.e.m. n values indicate the number of cells. The pink dashed lines show model predictions. b, Exemplary membrane voltage (Vm) recordings from T4 neurons in c in response to ON edges moving in the indicated directions (arrowheads). c, Peak membrane voltages of T4 neurons expressing GFP (black), GFP + GluClαRNAi (T4 > GluClαRNAi, teal) or GFP + Nmdar1RNAi (T4 > Nmdar1RNAi; grey) as a function of the direction of ON edge motion (left). Data are mean ± s.e.m. Right, directional tuning (Ldir) for all genotypes. Kruskal–Wallis test followed by Dunn’s multiple-comparisons test detected a significant difference of T4 > GluClαRNAi from T4 > GFP; *P = 0.0002. The circles show individual cells. The bars show the mean ± s.e.m. n values indicate the number of cells. d, Open-loop optomotor behaviour. e, Average virtual walking trajectories of flies expressing GluClαRNAi in T4/T5 cells (teal, n = 20) and of their parental controls (back and grey, n = 19 and n = 18, respectively) in response to ON edge motion at a 22.5° angle. f, The angular velocities of flies expressing GluClαRNAi (teal) or Nmdar1RNAi (grey) in T4/T5 neurons, and of their parental controls (black/grey), as a function of stimulus direction and polarity (top). Data are mean ± s.e.m. Bottom, absolute angular velocities scaled by horizontal stimulus components. For moving ON edges, one-way ANOVA followed by Holm–Šídák’s multiple comparisons test detected a significant difference of flies expressing GluClαRNAi in T4/T5 cells from both parental controls; *P = 0.0105. The circles represent individual flies. The bars show the mean ± s.e.m. n values indicate the number of flies. g, Closed-loop bar fixation behaviour. h, Exemplary bar trajectories (832 trials and 16 flies per genotype, top) and the overall bar position probabilities (bottom) for flies expressing GluClαRNAi in T4/T5 cells (teal) and their parental controls (back/grey). Probabilities are mean ± s.e.m. of flies in i. i, The percentage of the time that the bar occupied a 60° central window (fixation in front, dashed lines in h). Welch’s ANOVA followed by Dunnett’s T3 multiple comparisons test detected a significant difference of flies expressing GluClαRNAi in T4/T5 cells from both parental controls; *P = 0.0042. The dashed line indicates the chance level. The circles represent individual flies. The bars show mean ± s.e.m. n values indicate the number of flies. Source data.
Extended Data Fig. 1
Extended Data Fig. 1. Neuronal morphologies and receptive fields of the ON motion detection circuit.
a, Maximum intensity projections of confocal stacks with GFP expression in the respective neuronal population (green) and single biocytin-filled neurons (white) recovered after patch-clamp recordings. Scale bars, 20 μm. Micrographs are representative of independent experiments in different flies (Mi9: n = 5, Tm3: n = 3, Mi1: n = 3, Mi4: n = 4, C3: n = 3, T4: n = 7). b, Individual spatial receptive fields of T4 and their columnar input neurons obtained by reverse correlation (corr.) of membrane potentials and white noise stimuli. AU, arbitrary units. Filtered averages are shown in Fig. 1d, e. Source data
Extended Data Fig. 2
Extended Data Fig. 2. Mi9 neurons hyperpolarize in response to luminance increments.
Membrane potential responses of the same Mi9 neurons to increments (left) and decrements in luminance (right) presented in a 5° circle at the centre of the neurons’ receptive fields on a dark or bright background, respectively. Traces on top are normalized light intensities at the respective receptive field centre. The light lines represent technical replicates; the dark lines represent the mean; n = 14 technical replicates/2 cells/2 flies. Note the difference in membrane potential depending on the baseline luminance. Source data
Extended Data Fig. 3
Extended Data Fig. 3. Morphology of wild-type and GluClα-deficient T4 neurons.
Maximum intensity projections of representative confocal stacks of T4 neurons expressing GFP (left) or GFP and GluClαRNAi (right), each containing an individual biocytin-filled neuron (white) recovered after patch-clamp recording. The soma of the GluClαRNAi-expressing neuron was lost during pipette removal. Scale bars, 20 μm. Micrographs are representative of independent experiments in different flies (T4 > GFP: n = 7 and T4 > GFP + GluClαRNAi: n = 3). At the light microscopic level, no obvious genotype-specific morphological differences were detectable.
Extended Data Fig. 4
Extended Data Fig. 4. Measured and modelled T4 whole-cell currents in response to three types of neurotransmitter.
a, Placement of pipettes for neurotransmitter application during whole-cell recording. b, Average whole-cell currents of T4 neurons in response to 100 ms applications of neurotransmitter to the dendrite at different holding potentials (left) and full current-voltage relationships (right). Coloured dashed lines are linear fits to measurements taken at membrane potentials in the physiologically observed range between −100 and −40 mV. Filled triangles denote reversal potentials obtained by linear fits to currents measured at the soma (Erev Soma). Data are mean ± s.e.m. n values indicate the number of cells. The inward rectification of GABA-induced currents could be due to coupling of GABAB receptors to inwardly-rectifying potassium channels. c, Electron microscopic reconstruction of a T4 neuron used for compartmental modelling. Pipettes indicate approximate locations of conductances and the recording site for simulations in d. d, Somatic currents at different holding potentials simulated during 100 ms openings of conductances at the electron microscopically-determined synaptic sites corresponding to the respective transmitter (left) and current-voltage relationships (right). Conductances were adjusted in order to approximate measured reversal potentials at the soma. Filled triangles denote modelled reversal potentials at the soma (Erev Soma); open triangles denote corresponding reversal potentials at the dendritic root (Erev Dend.). Note the predicted deviation of Erev Soma from Erev Dend. for currents induced by acetylcholine, but not for currents induced by glutamate or GABA. e, Pipettes indicate locations of recording sites on the compartmental model (c) for simulations in f. f, Ratio of somatic to dendritic membrane potential in response to dendritic injection of 10 pA of depolarizing current as a function of membrane resistance (Rm) and axial resistivity (Ra) in the model. Note that soma and dendrite were quasi-isopotential (ratio > 0.9) across a wide range of parameters. Asterisk indicates parameter set used for simulations in d. g, Modelled somatic input resistance as a function of Rm and Ra. Solid and dashed lines correspond to the measured mean input resistance ± s.d. for wild-type T4 neurons (as shown in Fig. 2h). Asterisk indicates parameter set used for simulations in d. Source data
Extended Data Fig. 5
Extended Data Fig. 5. Nonlinear response properties of model circuits.
a, Resistor-capacitor equivalent circuit of a passive T4 neuron used for simulations in Fig. 3b, c, and 5a and Extended Data Figs. 6, 7, and 8. EGlu, EACh, and EGABA denote the equilibrium potentials and gGlu, gACh, and gGABA denote the conductances associated with glutamate, acetylcholine and GABA, respectively. The signals of Mi9 neurons control gGlu, the signals of Tm3 and Mi1 neurons control gAch, and those of C3 and Mi4 neurons act on gGABA. Vm, membrane potential; Cm, membrane capacitance; gleak, leak conductance. b, c, Top: Equivalent circuits of two passive isopotential neurons. One neuron (b) receives two input signals x and y, which control the excitatory conductances gexc1 and gexc2, respectively. The other neuron (c) receives one input signal x controlling the excitatory conductance gexc and another input signal y of opposite polarity that controls the inhibitory conductance ginh. Eexc, Einh, and Eleak are the equilibrium potentials of excitatory, inhibitory, and leak currents, respectively. Bottom: Nonlinearity as a function of signal amplitude for two excitatory conductances (b) and for one excitatory and the release from an inhibitory conductance (c). Nonlinearity was defined as the difference between the voltage response to both coincident inputs and the sum of the responses to each individual input. Equilibrium potentials were set to Eexc − Eleak = 50 mV and Einh − Eleak = −10 mV. d, e, Nonlinearity of the circuit in c as a function of Eexc and Einh. Conductances were set to gexc = ginh = gleak (d) or gexc = ginh = 0.5 × gleak (e). Disinhibition supports supralinear responses over a wide range of equilibrium potentials and input signal amplitudes. Source data
Extended Data Fig. 6
Extended Data Fig. 6. Free parameters of the conductance-based T4 neuron model.
Samples (n = 10,000) drawn from conditional probability distributions of input neuron gains and thresholds, leak reversal potential (Eleak), and leak conductance (gleak) consistent with measured voltage traces of T4 neurons inferred by deep neural density estimation. Histograms of individual parameter distributions are shown at the bottom; the remaining panels each contain the relationship between two respective parameters. Pink arrowheads and crosses indicate model parameters used for simulations shown in Figs. 3b, c, and 5a and Extended Data Figs. 7b, c, and 8. Source data
Extended Data Fig. 7
Extended Data Fig. 7. A direction-selective ‘window of opportunity’.
a, Schematic columnar organization of T4 neuron inputs. Synapses from Mi9 neurons (green), Tm3/Mi1 neurons (red), and Mi4 /C3 neurons (blue) are each separated by one column (hexagons) resulting in direction-dependent time differences during visual motion. Arrows indicate the directions of edge motion in corresponding panels in b and c. b, c, Top: Normalized T4 cell conductances (g/gleak) of respective input synapses during ON (b) and OFF edge motion (c) at a velocity of 30° s−1 in the directions indicated in a using the same model parameters as in Figs. 3b, c, and 5a and Extended Data Fig. 8. Data are mean and area under curve. Arrowheads in b mark the coincidence of increased excitability and cholinergic excitatory input (red). Bottom: T4 cell membrane voltage (Vm) responses predicted by the model. Source data
Extended Data Fig. 8
Extended Data Fig. 8. Predicted relationship between membrane potential and input resistance during edge motion.
Simulated T4 cell membrane potential (Vm) as a function of input resistance (Rin) in response to ON (top) and OFF edges (bottom) moving at 30° s–1 in the preferred (PD, left) and the null direction (ND, right) of the model. The arrowhead marks the peak in input resistance. Source data
Extended Data Fig. 9
Extended Data Fig. 9. Input resistance measurements during visual stimulation.
Holding currents (solid lines, top), membrane potentials (solid lines, centre), and input resistances (dashed lines, bottom) of exemplary T4 neurons expressing either GFP (a) or GFP + GluClαRNAi (b). To obtain input resistance measurements at high temporal resolution, neurons were subjected to at least two repetitions of identical visual stimulation while recording their membrane potentials. In this case, the stimulus was an ON edge moving at 30° s−1 in the neuron’s preferred direction. The holding current I was altered in between the first (#1) and the second repetition (#2) by ΔI = −1 pA. The input resistance Rin at each time point was calculated as ΔVmI, where ΔVm denotes the difference in membrane potential between repetitions (shaded areas/dashed arrows in a). Source data
Extended Data Fig. 10
Extended Data Fig. 10. GAL4 expression patterns, walking speeds, and bar fixation.
a, Confocal cross section through the optic lobe of a fly expressing GFP (green) under control of R39H12-GAL4 (T4/T5 >) as used in behavioural experiments in Fig. 5d–i. Synaptic structures were counterstained with an antibody against bruchpilot (grey). Scale bar, 40 µm. The micrograph is representative of 8 biological replicates. b, Average forward walking speeds of flies expressing GluClαRNAi (teal) or Nmdar1RNAi (grey) in T4/T5 neurons and their parental controls (black/grey) during closed-loop bar fixation experiments in Fig. 5h, i. c, Confocal cross section through the optic lobe of a fly expressing GFP (green) under control of the split GAL4 line R59E08-AD; R42F06-DBD. Synaptic structures were counterstained with an antibody against bruchpilot (grey). Scale bar, 40 µm. The micrograph is representative of 5 biological replicates. d, Average forward walking speeds of flies expressing GluClαRNAi (teal) under control of R59E08-AD; R42F06-DBD and their parental controls (black/grey) during closed-loop bar fixation in e, f. e, Exemplary bar trajectories (242 trials and 11 flies per genotype, top) and the overall bar position probabilities (bottom) for flies expressing GluClαRNAi (teal) under control of R59E08-AD; R42F06-DBD and their parental controls (back/grey). Data are mean ± s.e.m. of flies in f. f, The percentage of time that the bar occupied a central 60° window (fixation in front, dashed lines in e). The dashed line indicates the chance level. Circles, individual flies; bars, mean ± s.e.m. Asterisk denotes a significant difference from both parental controls (P = 0.0012, one-way ANOVA followed by Holm–Šídák’s multiple comparisons test). n values indicate the number of flies. Source data

References

    1. Koch, C. & Poggio, T. Multiplying with Synapses and Neurons. In Single Neuron Computation (eds Mckenna T. et al.) 315–345 (Academic Press, 1992).
    1. Koch C, Segev I. The role of single neurons in information processing. Nat. Neurosci. 2000;3:1171–1177. - PubMed
    1. London M, Häusser M. Dendritic computation. Annu. Rev. Neurosci. 2005;28:503–532. - PubMed
    1. Joesch M, Schnell B, Raghu SV, Reiff DF, Borst A. ON and OFF pathways in Drosophila motion vision. Nature. 2010;468:300–304. - PubMed
    1. Maisak MS, et al. A directional tuning map of Drosophila elementary motion detectors. Nature. 2013;500:212–216. - PubMed

Publication types

LinkOut - more resources