. 2022 Feb 7:16:785199.
doi: 10.3389/fncel.2022.785199. eCollection 2022.

Transcorneal Electrical Stimulation Induces Long-Lasting Enhancement of Brain Functional and Directional Connectivity in Retinal Degeneration Mice

Affiliations

Transcorneal Electrical Stimulation Induces Long-Lasting Enhancement of Brain Functional and Directional Connectivity in Retinal Degeneration Mice

Stephen K Agadagba et al. Front Cell Neurosci. .

Abstract

To investigate neuromodulation of functional and directional connectivity features in both visual and non-visual brain cortices after short-term and long-term retinal electrical stimulation in retinal degeneration mice. We performed spontaneous electrocorticography (ECoG) in retinal degeneration (rd) mice following prolonged transcorneal electrical stimulation (pTES) at varying currents (400, 500 and 600 μA) and different time points (transient or day 1 post-stimulation, 1-week post-stimulation and 2-weeks post-stimulation). We also set up a sham control group of rd mice which did not receive any electrical stimulation. Subsequently we analyzed alterations in cross-frequency coupling (CFC), coherence and directional connectivity of the primary visual cortex and the prefrontal cortex. It was observed that the sham control group did not display any significant changes in brain connectivity across all stages of electrical stimulation. For the stimulated groups, we observed that transient electrical stimulation of the retina did not significantly alter brain coherence and connectivity. However, for 1-week post-stimulation, we identified enhanced increase in theta-gamma CFC. Meanwhile, enhanced coherence and directional connectivity appeared predominantly in theta, alpha and beta oscillations. These alterations occurred in both visual and non-visual brain regions and were dependent on the current amplitude of stimulation. Interestingly, 2-weeks post-stimulation demonstrated long-lasting enhancement in network coherence and connectivity patterns at the level of cross-oscillatory interaction, functional connectivity and directional inter-regional communication between the primary visual cortex and prefrontal cortex. Application of electrical stimulation to the retina evidently neuromodulates brain coherence and connectivity of visual and non-visual cortices in retinal degeneration mice and the observed alterations are largely maintained. pTES holds strong possibility of modulating higher cortical functions including pathways of cognition, awareness, emotion and memory.

Keywords: brain coherence; brain connectivity analysis; electrocorticography (ECoG); retinal degeneration; theta-gamma coupling; transcorneal electrical stimulation.


Conflict of interest statement

The authors declare that the research was conducted in the absence of any commercial or financial relationships that could be construed as a potential conflict of interest.

Figures

FIGURE 1
FIGURE 1
ECoG Experimental design and steps taken to compute cross-frequency phase-amplitude coupling. (A,B) Represent ECoG signal traces from one rd10 mouse. ECoG signal was recorded from the four brain sites: the left primary visual cortex (LV1), the left prefrontal cortex (LPF), the right prefrontal cortex (RPF) and the right primary visual cortex (RV1) across four stages of stimulation (pre-stimulation, transient, post-stimulation 1 and post-stimulation 2) (A) scale bar, 5 s, (B) Scale bar, 100 ms. (C) Pictorial representation of the ECoG recording positions in the mouse brain and biphasic transcorneal electrical stimulation applied to the right eye. Ref: reference electrode position. (D) Timeline of experimental design. Transient stage ECoG recording was performed on the first day of the 7 days prolonged stimulation. The raw ECoG signal (E) was filtered into phase of LFO (F) and amplitude (thin line) of HFO (G). The time series of LFO phase and amplitude envelope of HFO (thick line) was computed from the respective filtered ECoG signals via Hilbert transformation (H). The phase amplitude plot (I) was constructed and used to calculate the mean distribution of amplitudes over the phase bins.
FIGURE 2
FIGURE 2
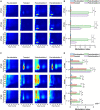
Following retinal electrical stimulation theta waves modulates medium-gamma oscillations in the left primary visual cortex (A,B) while modulating both medium-gamma and high-gamma oscillations in the left prefrontal cortex (C,D). (A) Phase-amplitude comodulograms was computed for ECoG signals from 400 μA stimulation (n = 6), 500 μA stimulation (n = 6), 600 μA stimulation (n = 6) during pre-stimulation (baseline), transient stimulation, post-stimulation stage 1 and post-stimulation stage 2. (B) Mean MI values for phases of slow theta waves (5.5–10 Hz) and amplitudes of fast medium-gamma oscillations (60–115 Hz) in the left primary visual cortex. (C) Phase-amplitude comodulograms computed for ECoG signals from 400 μA stimulation (n = 6), 500 μA stimulation (n = 6), 600 μA stimulation (n = 6) during pre-stimulation (baseline), transient stimulation, post-stimulation stage 1 and post-stimulation stage 2. (D) Mean MI values for phases of slow theta waves (5.5–10 Hz) and amplitudes of fast medium-gamma (60–115 Hz) and high-gamma oscillations (125–175 Hz) in the left prefrontal cortex. Twelve types of cross-frequency coupling were investigated between the three phase frequency bands [delta (0.5–5 Hz), theta (5–10 Hz) and alpha (10–15 Hz)], and four amplitude frequency bands [low gamma (30–55 Hz), medium-gamma (60–115 Hz), high-gamma (125–175 Hz), and ultra-gamma (185–300 Hz)]. θ—γm, Theta medium-gamma coupling; θ—γh, Theta high-gamma coupling. * Significant (P < 0.025); Error bar denotes SEM.
FIGURE 3
FIGURE 3
Theta, alpha and beta coherence is markedly elevated between the left prefrontal cortex and left primary visual cortex after retinal electrical stimulation. (A) Coherence spectrum showed prominent enhancement in theta, alpha and beta frequency bands; the shaded area depicts SEM. (B) Mean coherence values over two ECoG channels (left prefrontal cortex and primary visual cortex) from 400 μA stimulation (n = 6), 500 μA stimulation (n = 6), 600 μA stimulation (n = 6) during pre-stimulation (baseline), transient stimulation, post-stimulation stage 1 and post-stimulation stage 2. * Significant (P < 0.025); Error bar denotes SEM.
FIGURE 4
FIGURE 4
Corticocortical directional connectivity enhancement following retinal electrical stimulation. (A) Time course of feedforward (blue lines) and feedback (red lines) directional connectivity for theta, alpha and beta bands, respectively, during pre-stimulation (10 min), transient stimulation (10 min), post-stimulation stage 1 (10 min) and post-stimulation stage 2 (10 min). Feedforward (left primary visual cortex to left prefrontal cortex) and feedback (left prefrontal cortex to left primary visual cortex); vertical scale bar, 0.01, horizontal scale bar, 100 sec. (B) The average feedforward (upper panel) and feedback (lower panel) directional connectivity at three frequency bands from 400 μA stimulation (n = 6), 500 μA stimulation (n = 6), 600 μA stimulation (n = 6) was computed during pre-stimulation (baseline), transient stimulation, post-stimulation stage 1 and post-stimulation stage 2. Feedforward (left primary visual cortex to left prefrontal cortex) and feedback (left prefrontal cortex to left primary visual cortex). * Significant (P < 0.025); Error bar denotes SEM.

Similar articles

Cited by

References

    1. Agadagba S. K., Chan L. L. H. (2020). Spontaneous feedforward connectivity in electrically stimulated retinal degeneration mice(). Annu. Int. Conf. IEEE Eng. Med. Biol. Soc. 2020 3513–3516. 10.1109/embc44109.2020.9175231 - DOI - PubMed
    1. Agadagba S. K., Chan L. L. H. (2021). Modulation of narrowband and broadband gamma connectivity in retinal degeneration mice according to electrical stimulation pulse width. HKIE Trans. 27 148–155. 10.33430/thie-2020-0006 - DOI
    1. Agadagba S. K., Li X., Chan L. L. (2019). “Electroencephalogram power alterations in retinal degeneration mice after prolonged transcorneal electrical stimulation,” in Proceedings of the 2019 9th International IEEE/EMBS Conference on Neural Engineering (NER), (Piscataway, NJ: IEEE; ), 219–222.
    1. Agadagba S. K., Li X., Chan L. L. H. (2020). Excitation of the pre-frontal and primary visual cortex in response to transcorneal electrical stimulation in retinal degeneration mice. Front. Neurosci. 14:572299. 10.3389/fnins.2020.572299 - DOI - PMC - PubMed
    1. Andino-Pavlovsky V., Souza A. C., Scheffer-Teixeira R., Tort A. B., Etchenique R., Ribeiro S. (2017). Dopamine modulates delta-gamma phase-amplitude coupling in the prefrontal cortex of behaving rats. Front. Neural Circuits 11:29. 10.3389/fncir.2017.00029 - DOI - PMC - PubMed