. 2022 Feb 7:16:827628.
doi: 10.3389/fncel.2022.827628. eCollection 2022.

Long-Term Cultures of Spinal Cord Interneurons

Affiliations

Long-Term Cultures of Spinal Cord Interneurons

Ingrid Vargova et al. Front Cell Neurosci. .

Abstract

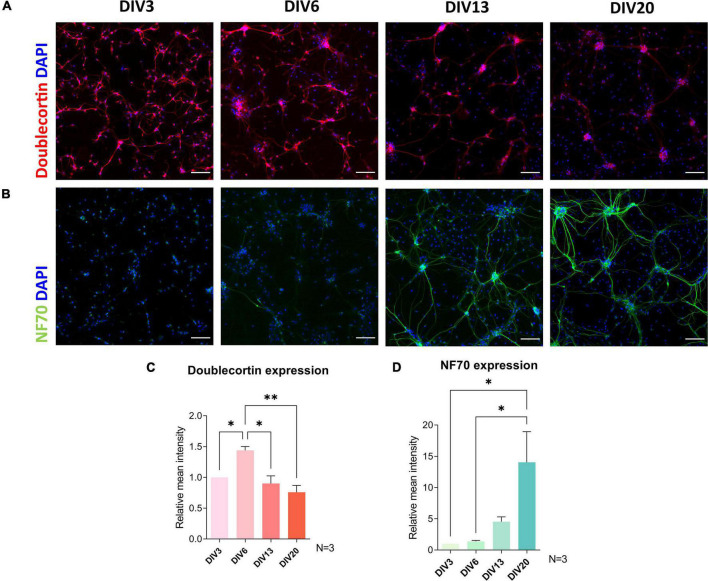
Spinal cord interneurons (SpINs) are highly diverse population of neurons that play a significant role in circuit reorganization and spontaneous recovery after spinal cord injury. Regeneration of SpIN axons across rodent spinal injuries has been demonstrated after modification of the environment and neurotrophin treatment, but development of methods to enhance the intrinsic regenerative ability of SpINs is needed. There is a lack of described in vitro models of spinal cord neurons in which to develop new regeneration treatments. For this reason, we developed a new model of mouse primary spinal cord neuronal culture in which to analyze maturation, morphology, physiology, connectivity and regeneration of identified interneurons. Isolated from E14 mice, the neurons mature over 15 days in vitro, demonstrated by expression of maturity markers, electrophysiological patch-clamp recordings, and formation of synapses. The neurons express markers of SpINs, including Tlx3, Lmx1b, Lbx1, Chx10, and Pax2. The neurons demonstrate distinct morphologies and some form perineuronal nets in long-term cultivation. Live neurons in various maturation stages were axotomized, using a 900 nm multiphoton laser and their fate was observed overnight. The percentage of axons that regenerated declined with neuronal maturity. This model of SpINs will be a valuable tool in future regenerative, developmental, and functional studies alongside existing models using cortical or hippocampal neurons.

Keywords: axon regeneration; culture; laser axotomy; maturation; spinal interneurons.


Conflict of interest statement

The authors declare that the research was conducted in the absence of any commercial or financial relationships that could be construed as a potential conflict of interest.

Figures

FIGURE 1
FIGURE 1
Brightfield images of live spinal cord culture in day in vitro (DIV) 1 (A), DIV3 (B), DIV10 (C), DIV17 (D), DIV41 (E), and DIV70 (F). Growth of processes was observed already at DIV3, while more complex network occurred in older cultures, after DIV17. Scale bars: 50 μm.
FIGURE 2
FIGURE 2
βIII tubulin and DAPI immunocytochemistry analysis of the cultures during day in vitro (DIV) 3 (A), DIV6 (B), DIV13 (C), and DIV20 (D). The number of neurons was stable during cultivation (E), but the number of cells assessed by DAPI increased continuously (F), which led to a decrease in the ratio of neuronal population in the culture (G). Scale bars: 50 μm. Data are shown as means + SEM of N = 3 biological replicate cultures; *p < 0.05.
FIGURE 3
FIGURE 3
Electrophysiological properties of cultured neurons during maturation. Resting membrane potential (A) and sodium current (D) did not change significantly after day in vitro (DIV) 16. Input resistance (B), membrane capacitance (C), and the percentage of neurons producing action potentials (E) did not change significantly after DIV9. Data are presented as means ± SEM of N = 3 biological replicate cultures and n number of cells; *p < 0.05, **p < 0.01, ***p < 0.001.
FIGURE 4
FIGURE 4
Immunocytochemical analysis of maturity markers doublecortin (A,C) and neurofilament 70 kDa (NF70) (B,D) expression during cultivation. Doublecortin expression was downregulated after DIV6, while a significant increase in NF70 signal was observed after DIV13. Scale bars: 100 μm. Data are presented as means + SEM of N = 3 biological replicate cultures; *p < 0.05, **p < 0.01.
FIGURE 5
FIGURE 5
Immunocytochemical analysis of synapse formation during cultivation of spinal cord culture. For excitatory synapse analysis, colocalization of VGLUT1 and Homer1 was examined (A,C,D), while colocalization of synaptic markers VGAT and Gephyrin was used for analysis of inhibitory synapses (B,E,F). Formation of new excitatory synapses was the most prominent between day in vitro (DIV) 7 and 15 (C). A similar pattern was observed in colocalization analysis of inhibitory synapses (E). VGLUT1, Homer1, and VGAT colocalization ratios were stable during cultivation (D,F), while an increase of ratio of Gephyrin marked synapses that colocalized with VGAT occurred between DIV7 and DIV15 (F). Scale bars: 25 μm. Data are presented as means + SEM of N = 3 biological replicate cultures; *p < 0.05, **p < 0.01, ***p < 0.001.
FIGURE 6
FIGURE 6
Markers of spinal interneurons Lbx1 (A), Lmx1b (B), Chx10 (C), Pax2, and Tlx3 (I) are present in primary spinal cord cultures. Pax2+ and Tlx3+ cells represent approximately half of neurons in the culture (H). Neurons also expressed PKCγ (D), GDNFR1α (E), parvalbumin (PV) (F), and Wisteria floribunda agglutinin (WFA) (G). Scale bars: 50 μm.
FIGURE 7
FIGURE 7
Morphological groups of neurons transfected with GFP (black) during various days in vitro (DIV), DIV7-8 (A), DIV14-15 (B), DIV21-22 (C), DIV28-29 (D). While DIV7 neurons were successfully categorized according to the number of processes into simple, intermediate, and branched, from DIV14 onward, the length of processes was found to be a better parameter for segregating morphologies into small, medium, and large. Scale bars: 200 μm. One-way ANOVA with Turkey’s post hoc test was used for analyzing the difference between morphological groups. Data are presented as means + SEM of N number of cells from 3 biological replicates; *p < 0.05, **p < 0.01, ***p < 0.001.
FIGURE 8
FIGURE 8
Comparison of all studied morphological parameters between various days in vitro (DIVs). A major shift in morphological properties was observed between DIV7 and DIV15. Growth of processes was observed even in prolonged cultivation periods, as parameters related to length of processes increased significantly at DIV28. Two-way ANOVA followed by Turkey’s post hoc test was used for analyzing the difference between DIVs. Data are presented as means ± SEM, means of plotted values are annotated in each bar; **p < 0.01, ***p < 0.001 of N number of cells from 3 biological replicates.
FIGURE 9
FIGURE 9
Axotomy of the GFP (black) transfected neurons was achieved using a 900 nm laser (A). Red arrow points at the location of the cut. Retraction bulb formed at certain distance from the injury site as indicated by the blue arrow. Bulb formation time (B) and retraction distance (C) were lower in DIV7 neurons. These two parameters have a positive linear relationship demonstrated by Pearson’s correlation coefficient (D). Percentage of regenerating axons decreased significantly between DIV7 and DIV16 (E). Time between retraction bulb formation and growth cone formation increased significantly at DIV16 (F), while speed of regeneration decreased marginally (G). Scale bars: 25 μm. Data are presented as means ± SEM of n number of cells from 3 biological replicates; *p < 0.05, **p < 0.01, ***p < 0.001.

Similar articles

Cited by

References

    1. Abraira V. E., Ginty D. D. (2013). The sensory neurons of touch. Neuron 79 618–639. 10.1016/j.neuron.2013.07.051 - DOI - PMC - PubMed
    1. Abu-Rub M., McMahon S., Zeugolis D. I., Windebank A., Pandit A. (2010). Spinal cord injury in vitro: modelling axon growth inhibition. Drug Discov. Today 15 436–443. 10.1016/j.drudis.2010.03.008 - DOI - PubMed
    1. Ahlemeyer B., Kölker S., Zhu Y., Hoffmann G. F., Krieglstein J. (2003). Cytosine arabinofuranoside-induced activation of astrocytes increases the susceptibility of neurons to glutamate due to the release of soluble factors. Neurochem. Int. 42 567–581. 10.1016/s0197-0186(02)00164-x - DOI - PubMed
    1. Alaynick W. A., Jessell T. M., Pfaff S. L. (2011). SnapShot: spinal cord development. Cell 146 178.e–178.e. 10.1016/j.cell.2011.06.038 - DOI - PMC - PubMed
    1. Allen N. J., Barres B. A. (2005). Signaling between glia and neurons: focus on synaptic plasticity. Curr. Opin. Neurobiol. 15 542–548. 10.1016/j.conb.2005.08.006 - DOI - PubMed