. 2022 Jan 7:15:777741.
doi: 10.3389/fnint.2021.777741. eCollection 2021.

Temporal Profile of Descending Cortical Modulation of Spinal Excitability: Group and Individual-Specific Effects

Affiliations

Temporal Profile of Descending Cortical Modulation of Spinal Excitability: Group and Individual-Specific Effects

Jiang Xu et al. Front Integr Neurosci. .

Abstract

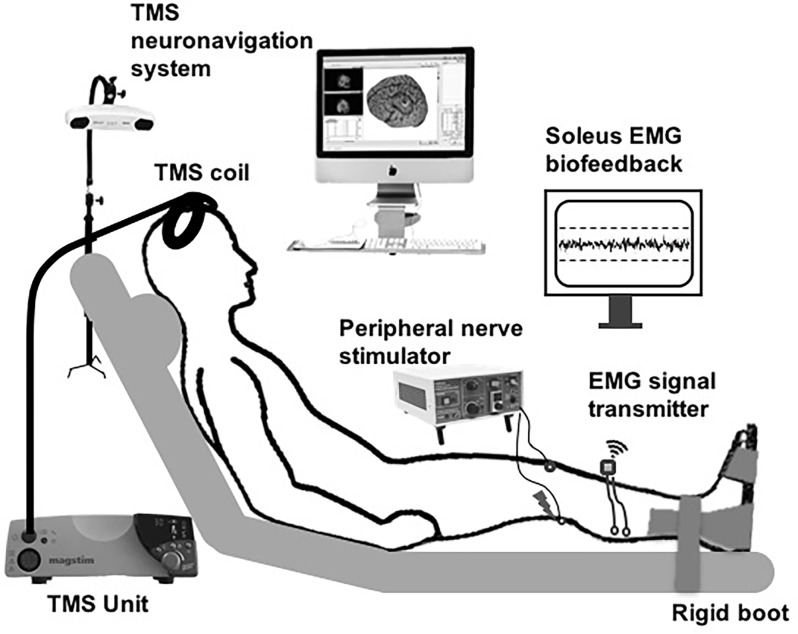
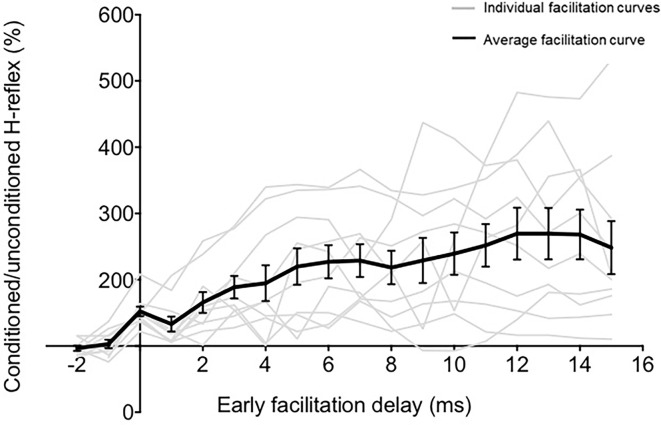
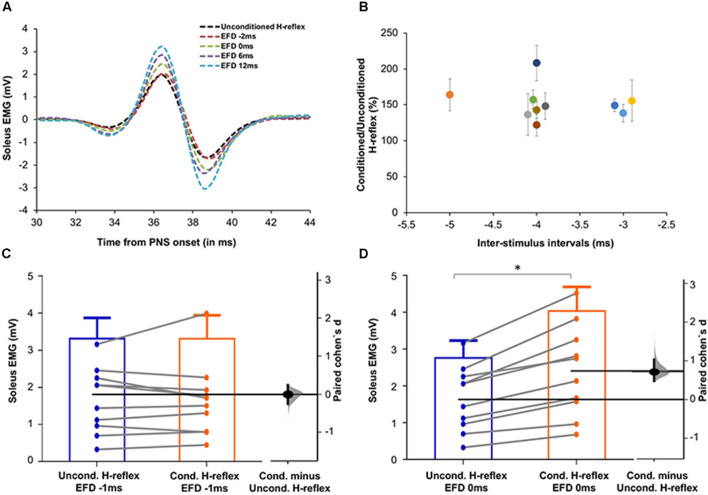
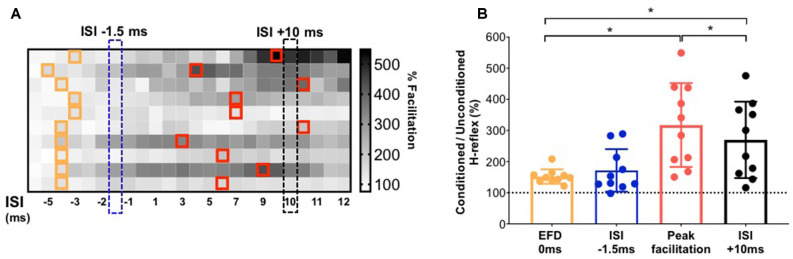
Sensorimotor control is modulated through complex interactions between descending corticomotor pathways and ascending sensory inputs. Pairing sub-threshold transcranial magnetic stimulation (TMS) with peripheral nerve stimulation (PNS) modulates the Hoffmann's reflex (H-reflex), providing a neurophysiologic probe into the influence of descending cortical drive on spinal segmental circuits. However, individual variability in the timing and magnitude of H-reflex modulation is poorly understood. Here, we varied the inter-stimulus interval (ISI) between TMS and PNS to systematically manipulate the relative timing of convergence of descending TMS-induced volleys with respect to ascending PNS-induced afferent volleys in the spinal cord to: (1) characterize effective connectivity between the primary motor cortex (M1) and spinal circuits, mediated by both direct, fastest-conducting, and indirect, slower-conducting descending pathways; and (2) compare the effect of individual-specific vs. standard ISIs. Unconditioned and TMS-conditioned H-reflexes (24 different ISIs ranging from -6 to 12 ms) were recorded from the soleus muscle in 10 able-bodied individuals. The magnitude of H-reflex modulation at individualized ISIs (earliest facilitation delay or EFD and individual-specific peak facilitation) was compared with standard ISIs. Our results revealed a significant effect of ISI on H-reflex modulation. ISIs eliciting earliest-onset facilitation (EFD 0 ms) ranged from -3 to -5 ms across individuals. No difference in the magnitude of facilitation was observed at EFD 0 ms vs. a standardized short-interval ISI of -1.5 ms. Peak facilitation occurred at longer ISIs, ranging from +3 to +11 ms. The magnitude of H-reflex facilitation derived using an individual-specific peak facilitation was significantly larger than facilitation observed at a standardized longer-interval ISI of +10 ms. Our results suggest that unique insights can be provided with individual-specific measures of top-down effective connectivity mediated by direct and/or fastest-conducting pathways (indicated by the magnitude of facilitation observed at EFD 0 ms) and other descending pathways that encompass relatively slower and/or indirect connections from M1 to spinal circuits (indicated by peak facilitation and facilitation at longer ISIs). By comprehensively characterizing the temporal profile and inter-individual variability of descending modulation of spinal reflexes, our findings provide methodological guidelines and normative reference values to inform future studies on neurophysiological correlates of the complex array of descending neural connections between M1 and spinal circuits.

Keywords: corticospinal pathways; inter-stimulus interval (ISI); lower extremity muscles; spinal reflex excitability; transcranial magnetic stimulation (TMS).


Conflict of interest statement

The authors declare that the research was conducted in the absence of any commercial or financial relationships that could be construed as a potential conflict of interest.

Figures

Figure 1
Figure 1
Schematic of the experimental setup. Subthreshold transcranial magnetic stimulation (TMS) pulses applied over the soleus motor cortex hotspot were paired with peripheral nerve stimulation (PNS) delivered to the tibial nerve at a range of inter-stimulus intervals (ISIs). The participants were instructed to maintain low-level background soleus muscle EMG activation targeting 10% maximal voluntary contraction (MVC), with ongoing visual biofeedback of ongoing EMG activity was displayed to the participant throughout the session.
Figure 2
Figure 2
The relationship between ISI and TMS-conditioning of Hoffmann’s reflex (H-reflex). The graph demonstrates the relationship between different early facilitation delays (EFDs) and H-reflex facilitation (normalized as a percentage of unconditioned H-reflex amplitude), with gray lines representing data from individual participants and the black line representing the group average (error bars represent standard error). The ordinate (y-axis) shows the amplitude of the conditioned H-reflex as a percentage of the control (unconditioned) reflex amplitude. The abscissa (x-axis) shows the inter-stimulus timing between TMS and PNS normalized with reference to delay (in ms) from the ISI at which the earliest onset of facilitation occurred (EFD).
Figure 3
Figure 3
(A) Raw H-reflex data. Raw H-reflex traces from a representative participant without (unconditioned H-reflex) and with TMS conditioning at multiple ISIs (conditioned H-reflexes at different delays with respect to the timing of earliest onset of facilitation, i.e., EFD). The conditioned H-reflexes are displayed at EFD −2 ms, 0 ms, 6 ms, and 12 ms. Note that in contrast to the absence of facilitation at EFD 0 ms, H-reflexes at the other EFD ISI intervals are facilitated (larger in amplitude) compared to the unconditioned H-reflex, showing modulation of the spinal reflex by the descending TMS-induced volleys. (B) Magnitude and timing of earliest onset of facilitation. The earliest onset of facilitation was observed at ISIs ranging from −3 to −5 ms (mean = −3.70 ± 0.67ms) across study participants (x-axis). The average magnitude of facilitation (y-axis) was 158.00 ± 28.58% but varied across different ISIs. (C,D) Graphs with estimation plots showing comparisons between unconditioned vs. conditioned H-reflex amplitudes at EFD −1 ms and EFD 0 ms. Unconditioned and conditioned H-reflexes (means with standard deviation as well as individual participant data) are shown at EFD −1 ms (C) and EFD 0 ms (D). The paired mean difference (Cohen’s d) is shown with a Gardner-Altman estimation plot on a floating axis on the right as a bootstrap sampling distribution; the mean difference is depicted as a dot; the 95% confidence interval is indicated by the ends of the vertical error bars. Note that while no significant increase in the conditioned H-reflex amplitudes was observed at EFD −1 ms, a significantly larger amplitude of conditioned vs. unconditioned (with a large effect size) was observed at EFD 0 ms. *Indicates statistically significant difference.
Figure 4
Figure 4
Demonstration of individualized earliest onset of and peak magnitude of facilitation in comparison to standard ISIs. (A) The gradient map shows the gray-scale rank of the magnitude of facilitation for each study participant (rows) at each ISI (columns). The cells in the map filled with different gray scale colors (from white to black) represent the rank of conditioned H-reflexes amplitude (from highest facilitation to lowest facilitation) for each participant. For each participant, ISIs at which the earliest onset of facilitation was detected are demarcated with orange outlines. On the same color matrix, individualized ISIs that elicited peak facilitation are demarcated with red outlines. The chart shows the inter-individual variability in the location of ISI that elicits earliest or peak facilitation. (B) Comparison of the magnitude of facilitation for early facilitation at individualized EFD 0 ms vs. at a standard early ISI of −1.5 ms; and between individualized peak facilitation vs. at a longer interval standard ISI of +10 ms. *Indicates statistically significant difference.

Similar articles

Cited by

References

    1. Abbruzzese G., Trompetto C. (2002). Clinical and research methods for evaluating cortical excitability. J. Clin. Neurophysiol. 19, 307–321. 10.1097/00004691-200208000-00005 - DOI - PubMed
    1. Aguiar S. A., Baker S. N. (2018). Descending inputs to spinal circuits facilitating and inhibiting human wrist flexors. Front. Hum. Neurosci. 12:147. 10.3389/fnhum.2018.00147 - DOI - PMC - PubMed
    1. Bae S., Kim K. Y. (2017). Dual-afferent sensory input training for voluntary movement after stroke: a pilot randomized controlled study. NeuroRehabilitation 40, 293–300. 10.3233/NRE-161417 - DOI - PubMed
    1. Barker A. T., Jalinous R., Freeston I. L. (1985). Non-invasive magnetic stimulation of human motor cortex. Lancet 1, 1106–1107. 10.1016/s0140-6736(85)92413-4 - DOI - PubMed
    1. Baudry S., Collignon S., Duchateau J. (2015). Influence of age and posture on spinal and corticospinal excitability. Exp. Gerontol. 69, 62–69. 10.1016/j.exger.2015.06.006 - DOI - PubMed

LinkOut - more resources