. 2022 Feb 7:14:803973.
doi: 10.3389/fnagi.2022.803973. eCollection 2022.

Early Noise-Induced Hearing Loss Accelerates Presbycusis Altering Aging Processes in the Cochlea

Affiliations

Early Noise-Induced Hearing Loss Accelerates Presbycusis Altering Aging Processes in the Cochlea

Anna Rita Fetoni et al. Front Aging Neurosci. .

Abstract

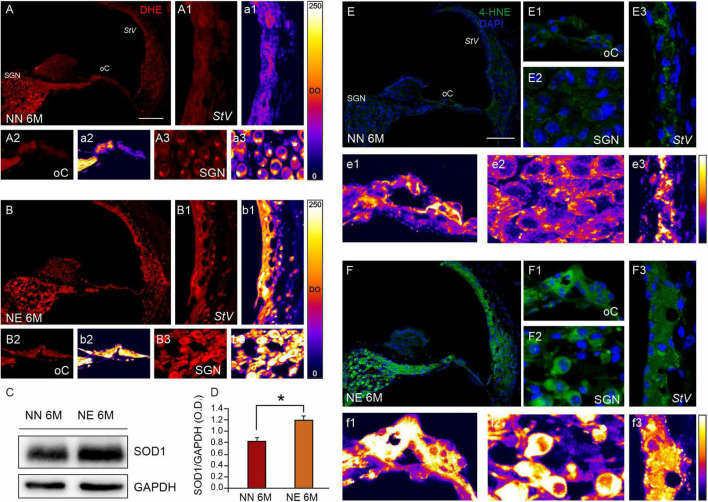
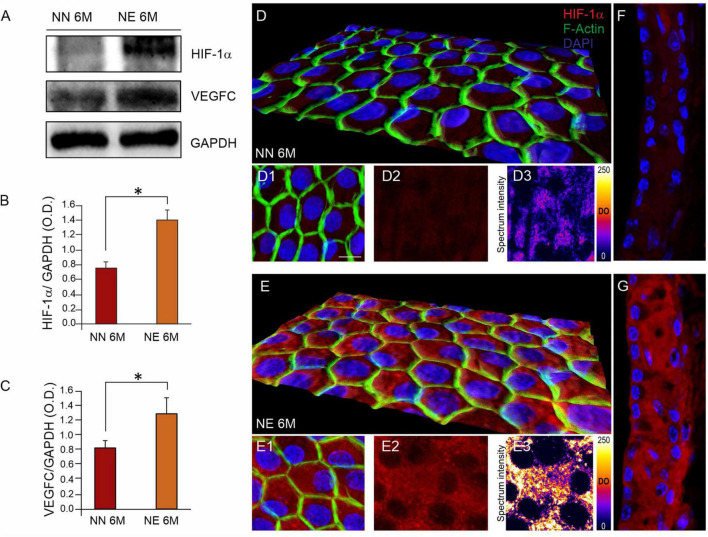
Several studies identified hearing loss as a risk factor for aging-related processes, including neurodegenerative diseases, as dementia and age-related hearing loss (ARHL). Although the association between hearing impairment in midlife and ARHL has been widely documented by epidemiological and experimental studies, the molecular mechanisms underlying this association are not fully understood. In this study, we used an established animal model of ARHL (C57BL/6 mice) to evaluate if early noise-induced hearing loss (NIHL) could affect the onset or progression of age-related cochlear dysfunction. We found that hearing loss can exacerbate ARHL, damaging sensory-neural cochlear epithelium and causing synaptopathy. Moreover, we studied common pathological markers shared between hearing loss and ARHL, demonstrating that noise exposure can worsen/accelerate redox status imbalance [increase of reactive oxygen species (ROS) production, lipid peroxidation, and dysregulation of endogenous antioxidant response] and vascular dysfunction [increased expression of hypoxia-inducible factor-1alpha (HIF-1α) and vascular endothelial growth factor C (VEGFC)] in the cochlea. Unveiling the molecular mechanisms underlying the link between hearing loss and aging processes could be valuable to identify effective therapeutic strategies to limit the effect of environmental risk factors on age-related diseases.

Keywords: acoustic trauma; age-related hearing loss; aging; hearing loss; oxidative stress; vascular dysfunction.


Conflict of interest statement

The authors declare that the research was conducted in the absence of any commercial or financial relationships that could be construed as a potential conflict of interest.

Figures

FIGURE 1
FIGURE 1
Experimental design and time schedule. Mice of 2 months of age (M) at the beginning of the study were used. Baseline hearing thresholds were evaluated the day before (D0) the exposure to repeated noise sessions lasting 10 consecutive days (D1 - D10). After 1, 4, and 7 months from trauma sessions, when the mice were aged 3, 6, and 9 M, the functional (ABR and DPOAEs) and/or molecular (WB/IF) evaluations were performed. ABRs, auditory brainstem responses; DPOAEs, distortion products otoacoustic emissions; IF, immunofluorescence; WB, western immunoblotting.
FIGURE 2
FIGURE 2
Noise-induced hearing loss accelerates auditory dysfunctions in 6 months of age mice. (A–D) ABR recordings in no noise-exposed (NN) and/or noise-exposed (NE) C57BL/6 mice at different months of age. (A) Graph shows ABR threshold values (means ± SEM) in mice of 3, 6, and 9 months of age (M). A progressive worsening of auditory threshold was observed in NN mice during physiological aging. (B–D) Graphs show ABR threshold values (means ± SEM) in animals exposed to noise in young age and evaluated at 3, 6, and 9 M (corresponding to 1, 4, and 7 months after noise exposure). At 3 M, noise causes a marked increase of auditory threshold, spanning at all frequencies (B). Threshold increase was evident also at 6 M (C), whereas, at 9 M, the threshold also worsened in not-exposed group and no difference was observed between the groups (D). Asterisks indicate significant differences between groups (*p < 0.05; **p < 0.01) from three way ANOVA with repeated measures. (E,F) Amplitude-intensity curves (mean ± SEM) showing a decreased amplitude of wave I and wave II in NE animals of 6 M at 16 kHz compared with NN mice. Asterisks indicate significant differences between groups (*p < 0.05; **p < 0.01) from Student’s t-test. (G,H) Graphs (mean ± SEM) show DPOAE responses recorded in NE and NN animals at different ages (3 and 6 M). Asterisks indicate significant differences between groups (*p < 0.05; **p < 0.01) from two-way ANOVA with repeated measures.
FIGURE 3
FIGURE 3
Sensory and neuronal damage in noise-exposed animals. (A) Schematic representation of principal cochlear structures (spiral ganglion neurons-SGNs; neural afferent fibers and organ of Corti) in cochlear section with high magnification of different cell types in the organ of Corti and a schematic representation of cell view in surface preparations of the organ of Corti. IHC: inner ear cell; OHCs, outer hair cells; Hen, Hensen cells. (B,C) Representative images of surface preparations of the organ of Corti (middle turn region) showing hair cells and F-Actin distribution in the middle cochlear turn of no noise-exposed [NN group; (B)] and noise-exposed [NE group; (C)] animals of early presbycusis mice of 6 months of age (M). Cochlear organization with well aligned three rows of outer hair cells (OHCs) and one row of inner hair cells (IHCs) was shown in panel (B). In NE group, a severe OHC loss was observed, as indicated by asterisks (C). (D) Histogram (means ± SEM) indicates percentage of OHC survival in all cochlear turns normalized to NN early presbycusis mice of 6 M. (E,F) Representative images of spiral ganglion neuron (SGN, indicated by arrows) cryosections marked with Rh-Ph (red fluorescence) and DAPI staining (blue fluorescence). A marked SGN loss was observed in NE group (F) compared with NN animals (E). (G) Histogram (means ± SEM) shows the SGNs count in cochlear turns normalized to NN early presbycusis mice of 6 M. Note that no significant differences between NE and NN mice were observed in basal cochlear region (affected already by aging) but significant differences were observed in middle and high cochlear region, indicating a worsened/accelerated aging effect by noise. Asterisks in panels (D,G) refer to significant difference vs. NN group (*p < 0.05) from Student’s t-test. Scale bar 20 μm.
FIGURE 4
FIGURE 4
Noise exacerbates age-related decrease of primary afferent fibers and synaptic ribbons. (A–D) Representative images showing primary afferent fibers (NF200, green fluorescence), Rh-Ph (red fluorescence) and DAPI staining (blue fluorescence) in cochlear cryosections (middle turn region) of no noise-exposed [NN group; (A,B)] and noise-exposed [NE group; (C,D)] animals of 6 months of age (M). A marked decrease of primary afferent fibers (AF) was observed in the Noise group compared with NN. (E,F) Representative images of surface preparations of the organ of Corti showing one row of inner hair cells stained for CtBP2 (red fluorescence, to label the synaptic ribbons, red arrows) and anti-GluA2 (green fluorescence, to visualize postsynaptic puncta, green arrows) and double stained with DAPI. Paired puncta are indicated by yellow (red + green) labeling (yellow puncta). High magnifications of a single hair cell (outlines of selected hair cells are indicated by dashed lines) are shown in panels (e,f). (G) Histogram (means ± SEM) shows the percentage of paired synapses/IHC, normalized to NN 6 M values, in cochlear turns. Note that no significant differences between NE and NN mice were observed in basal cochlear region (affected already by aging) but significant differences were observed in middle and high cochlear region, indicating a worsened/accelerated aging effect by noise. Asterisks indicate significant differences between groups (***p < 0.001) from Student’s t-test. Scale bar (A,D) 20 μm; (E,F) 8 μm.
FIGURE 5
FIGURE 5
Noise exposure accelerates cochlear oxidative stress and lipid peroxidation in 6 M mice with ARHL. (A,B) Representative images of cochlear cryosections (middle turn region) of no noise- exposed [NN group; (A)] and noise-exposed [NE group; (B)] animals of 6 months of age (M) stained with DHE (red fluorescence). ROS fluorescence increases in noise-exposed animals in all cochlear structures. High magnifications of stria vascularis (A1,B1), the organ of Corti (A2,B2), and spiral ganglion neurons (A3,B3) are shown. The distribution of fluorescence signals in a pseudo-color rainbow scale is shown in the stria vascularis (a1,b1), the organ of Corti (a2,b2), and spiral ganglion neurons (a3,b3). StV, stria vascularis; oC, organ of Corti; SGNs, spiral ganglion neurons. Scale bar: 100 μm. (C) Western immunoblotting indicating SOD1 overexpression in cochlear samples of NE animals of 6 M. (D) Histograms (mean ± SEM) represent relative optical density (O.D.) values (SOD1/GAPDH ratios). Experiments were performed in triplicate. Asterisks indicate significant differences between groups (*p < 0.05) from Student’s t-test. (E,F) Representative images showing cochlear cryosections (middle-basal turns) of not-exposed [NN; (E)] and noise-exposed animals [NE; (F)] of 6 M stained with 4-HNE (green fluorescence) and DAPI (blue fluorescence). High magnifications of the organ of Corti (E1,F1), spiral ganglion neurons (E2,F2), and stria vascularis (E3,F3) are shown. The distribution of fluorescence signals in a pseudo-color rainbow scale is shown in the organ of Corti (e1,f1), spiral ganglion neurons (e2,f2), and stria vascularis (e3,f3). StV, stria vascularis; oC, organ of Corti; SGNs, spiral ganglion neurons. Scale bar: 100 μm.
FIGURE 6
FIGURE 6
Noise exposure enhances the age-related cochlear vascular damage. (A) Western immunoblotting showing cochlear overexpression of HIF-1α and VEGFC in animals of 6 months of age (M) exposed to noise. (B,C) Histograms showing densitometry evaluations (optical density, O.D., proteins/GAPDH ratios). Data are expressed as mean ± SEM from three independent experiments. Asterisks indicate significant differences between groups (*p < 0.05) from Student’s t-test. (D,E) Representative 3D reconstruction of confocal Z-stacks images of HIF-1α expression [red fluorescence, (D2,E2)] in stria vascularis whole-mounts stained with F-actin (green fluorescence) showing marginal cell monolayer in no noise-exposed (NN) and noise-exposed (NE) groups (D1,E1). Distribution of HIF-1α fluorescence signal is shown in a pseudo-color rainbow scale in panels (D3,E3). (F,G) Representative images of stria vascularis cryosections stained for HIF-1α (red fluorescence) and DAPI (blue fluorescence) of NN (F) and NE (G) animals of 6 M confirming high expression of HIF-1α induced by noise. Scale bar: 20 μm.

References

    1. Alvarado J. C., Fuentes-Santamaría V., Gabaldón-Ull M. C., Juiz J. M. (2019). Age-Related Hearing Loss Is Accelerated by Repeated Short-Duration Loud Sound Stimulation. Front. Neurosci. 13:77. 10.3389/fnins.2019.00077 - DOI - PMC - PubMed
    1. Alvarado J. C., Fuentes-Santamaría V., Gabaldón-Ull M. C., Blanco J. L., Juiz J. M. (2014). Wistar rats: a forgotten model of age-related hearing loss. Front. Aging Neurosci. 6:29. 10.3389/fnagi.2014.00029 - DOI - PMC - PubMed
    1. Alvarado J. C., Fuentes-Santamaría V., Melgar-Rojas P., Valero M. L., Gabaldón-Ull M. C., Miller J. M., et al. (2015). Synergistic effects of free radical scavengers and cochlear vasodilators: a new otoprotective strategy for age-related hearing loss. Front. Aging Neurosci. 7:86. 10.3389/fnagi.2015.00086 - DOI - PMC - PubMed
    1. Bai U., Seidman M. D., Hinojosa R., Quirk W. S. (1997). Mitochondrial DNA deletions associated with aging and possibly presbycusis: a human archival temporal bone study. Am. J. Otol. 18 449–453. - PubMed
    1. Beckmann D., Feldmann M., Shchyglo O., Manahan-Vaughan D. (2020). Hippocampal Synaptic Plasticity, Spatial Memory, and Neurotransmitter Receptor Expression Are Profoundly Altered by Gradual Loss of Hearing Ability. Cereb. Cortex 30 4581–4596. 10.1093/cercor/bhaa061 - DOI - PMC - PubMed

LinkOut - more resources