. 2022 Feb 7:14:818340.
doi: 10.3389/fnagi.2022.818340. eCollection 2022.

Intermittent Theta Burst Stimulation Increases Natural Oscillatory Frequency in Ipsilesional Motor Cortex Post-Stroke: A Transcranial Magnetic Stimulation and Electroencephalography Study

Affiliations

Intermittent Theta Burst Stimulation Increases Natural Oscillatory Frequency in Ipsilesional Motor Cortex Post-Stroke: A Transcranial Magnetic Stimulation and Electroencephalography Study

Qian Ding et al. Front Aging Neurosci. .

Abstract

Objective: Intermittent theta burst stimulation (iTBS) has been widely used as a neural modulation approach in stroke rehabilitation. Concurrent use of transcranial magnetic stimulation and electroencephalography (TMS-EEG) offers a chance to directly measure cortical reactivity and oscillatory dynamics and allows for investigating neural effects induced by iTBS in all stroke survivors including individuals without recordable MEPs. Here, we used TMS-EEG to investigate aftereffects of iTBS following stroke.

Methods: We studied 22 stroke survivors (age: 65.2 ± 11.4 years; chronicity: 4.1 ± 3.5 months) with upper limb motor deficits. Upper-extremity component of Fugl-Meyer motor function assessment and action research arm test were used to measure motor function of stroke survivors. Stroke survivors were randomly divided into two groups receiving either Active or Sham iTBS applied over the ipsilesional primary motor cortex. TMS-EEG recordings were performed at baseline and immediately after Active or Sham iTBS. Time and time-frequency domain analyses were performed for quantifying TMS-evoked EEG responses.

Results: At baseline, natural frequency was slower in the ipsilesional compared with the contralesional hemisphere (P = 0.006). Baseline natural frequency in the ipsilesional hemisphere was positively correlated with upper limb motor function following stroke (P = 0.007). After iTBS, natural frequency in the ipsilesional hemisphere was significantly increased (P < 0.001).

Conclusions: This is the first study to investigate the acute neural adaptations after iTBS in stroke survivors using TMS-EEG. Our results revealed that natural frequency is altered following stroke which is related to motor impairments. iTBS increases natural frequency in the ipsilesional motor cortex in stroke survivors. Our findings implicate that iTBS holds the potential to normalize natural frequency in stroke survivors, which can be utilized in stroke rehabilitation.

Keywords: TMS-EEG; evoked oscillatory response; intermittent theta burst stimulation; natural frequency; stroke rehabilitation.


Conflict of interest statement

The authors declare that the research was conducted in the absence of any commercial or financial relationships that could be construed as a potential conflict of interest.

Figures

FIGURE 1
FIGURE 1
TMS-evoked EEG potentials in a representative subject. Top row: The gray curves represent TEP in each channel, and the red bold curves represent the averaged TEP in the channels surrounding the stimulated motor cortex (C4). Bottom row: Topographic plots of the TMS-evoked responses at 30, 45, 60, 100, and 180 ms post-TMS.
FIGURE 2
FIGURE 2
Local and global mean field power changes after iTBS. Data presented are group mean ± standard error. The top panel presents the data in the IH, and the bottom panel presents the data in the CH. (A,B) LMFP in the Active and Sham TBS group, respectively. (C,D) GMFP in the Active and Sham TBS group, respectively. The red curves represent LMFP or GMFP before iTBS, and the blue curves represent LMFP or GMFP after iTBS. There was no significant change in LMFP or GMFP after iTBS in either group.
FIGURE 3
FIGURE 3
TMS-evoked oscillatory response (EOR) changes after iTBS. Data presented are group mean ± standard error. The top panel presents the data in the IH, and the bottom panel presents the data in the CH. (A–D) presents EOR before and after iTBS in the delta, theta, alpha and beta bands, respectively. The red circles represent the Active iTBS group, and the blue circles represent the Sham iTBS group. There was no significant change in EOR after iTBS in any frequency band in either group.
FIGURE 4
FIGURE 4
Differences in baseline natural frequency between hemispheres. (A,B) Illustration of TEP, ERSP and natural frequency in the IH and CH in a representative subject. The gray curves represent TEP in each channel, and the red bold curves represent the averaged TEP in the channels surrounding the stimulated motor cortex. The ERSP plots show the TMS-evoked oscillatory responses in amplitude and duration, with black dotted lines highlighting the frequency with the highest power (i.e., natural frequency). (C) Data presented are group mean ± standard error. Baseline natural frequency was significantly slower in the IH compared with CH in the entire sample. The solid circles represent the IH, and the empty circles represent the CH.
FIGURE 5
FIGURE 5
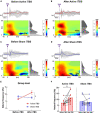
Natural frequency changes after iTBS. (A–D) Illustration of TEP, ERSP and natural frequency in the IH before and after iTBS in representative subjects in the Active (A,B) and Sham (C,D) iTBS groups. The gray curves represent TEP in each channel, and the bold curves represent the averaged TEP in the channels surrounding the stimulated motor cortex. The ERSP plots show the TMS-evoked oscillatory responses in amplitude and duration, with black dotted lines highlighting the frequency with the highest power (i.e., natural frequency). (E) Data presented are group mean ± standard error. In the Active iTBS group, IH natural frequency was significantly increased after iTBS; while in the Sham iTBS group, there was no significant change in natural frequency after iTBS. (F) Illustration of individual changes in IH natural frequency after iTBS in both groups. The red circles represent the Active iTBS group, and the blue circles represent the Sham iTBS group.
FIGURE 6
FIGURE 6
Correlations between natural frequency and motor function. (A) There was a significant positive correlation between natural frequency in the IH and upper extremity Fugl-Meyer assessment (FMA) score. (B) There was a significant positive correlation between natural frequency in the IH and action research arm test (ARAT) score.

Similar articles

Cited by

References

    1. Atluri S., Frehlich M., Mei Y., Garcia Dominguez L., Rogasch N. C., Wong W., et al. (2016). TMSEEG: A MATLAB-based graphical user interface for processing electrophysiological signals during transcranial magnetic stimulation. Front. Neural. Circ. 10:78. 10.3389/fncir.2016.00078 - DOI - PMC - PubMed
    1. Bai Z., Zhang J., Fong K. N. K. (2021). Intermittent theta burst stimulation to the primary motor cortex reduces cortical inhibition: a tms-eeg study. Brain Sci. 11:1114. 10.3390/brainsci11091114 - DOI - PMC - PubMed
    1. Benes F. M., Berretta S. (2001). GABAergic interneurons: implications for understanding schizophrenia and bipolar disorder. Neuropsychopharmacology 25 1–27. 10.1016/S0893-133X(01)00225-1 - DOI - PubMed
    1. Bestmann S., Baudewig J., Siebner H. R., Rothwell J. C., Frahm J. (2004). Functional MRI of the immediate impact of transcranial magnetic stimulation on cortical and subcortical motor circuits. Eur. J. Neurosci. 19 1950–1962. 10.1111/j.1460-9568.2004.03277.x - DOI - PubMed
    1. Bonkhoff A. K., Espinoza F. A., Gazula H., Vergara V. M., Hensel L., Michely J., et al. (2020). Acute ischaemic stroke alters the brain’s preference for distinct dynamic connectivity states. Brain 143 1525–1540. 10.1093/brain/awaa101 - DOI - PMC - PubMed

LinkOut - more resources