

Integrated 16S rRNA Gene Sequencing and Metabolomics Analysis to Investigate the Important Role of Osthole on Gut Microbiota and Serum Metabolites in Neuropathic Pain Mice
- PMID: 35197864
- PMCID: PMC8860327
- DOI: 10.3389/fphys.2022.813626
Integrated 16S rRNA Gene Sequencing and Metabolomics Analysis to Investigate the Important Role of Osthole on Gut Microbiota and Serum Metabolites in Neuropathic Pain Mice
Abstract
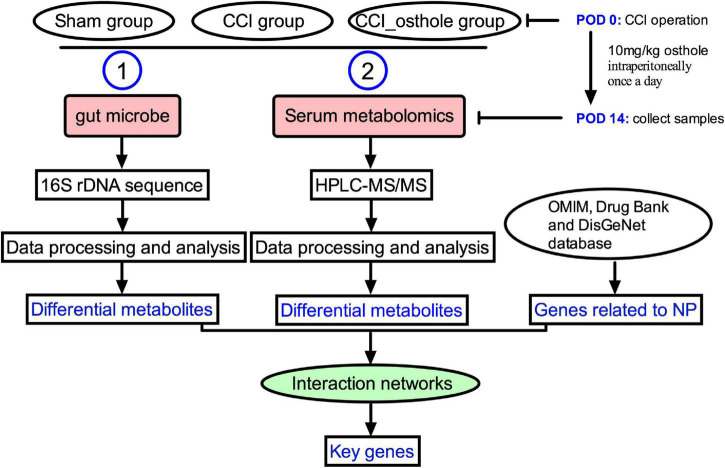
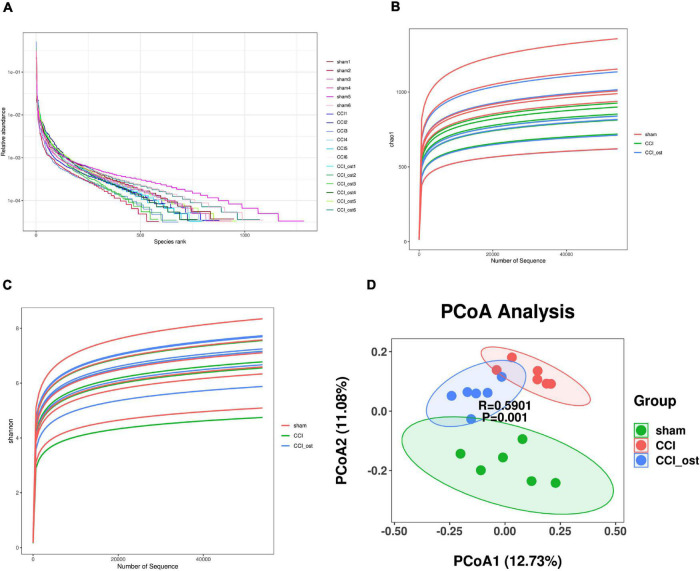
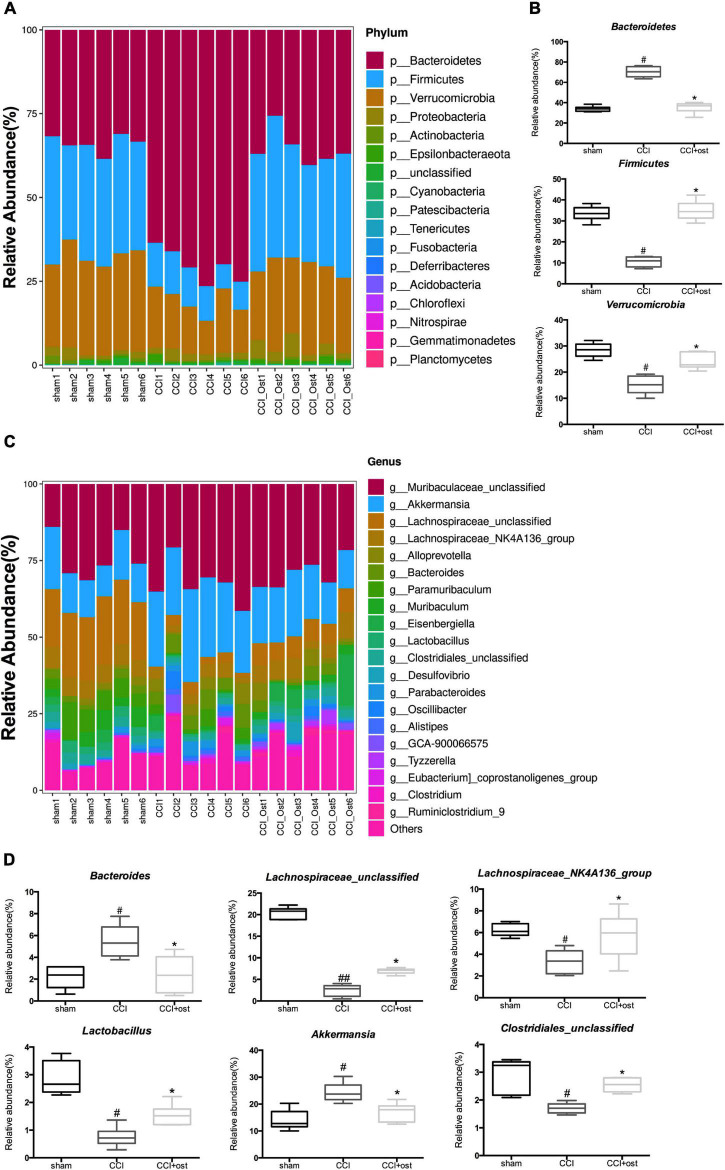
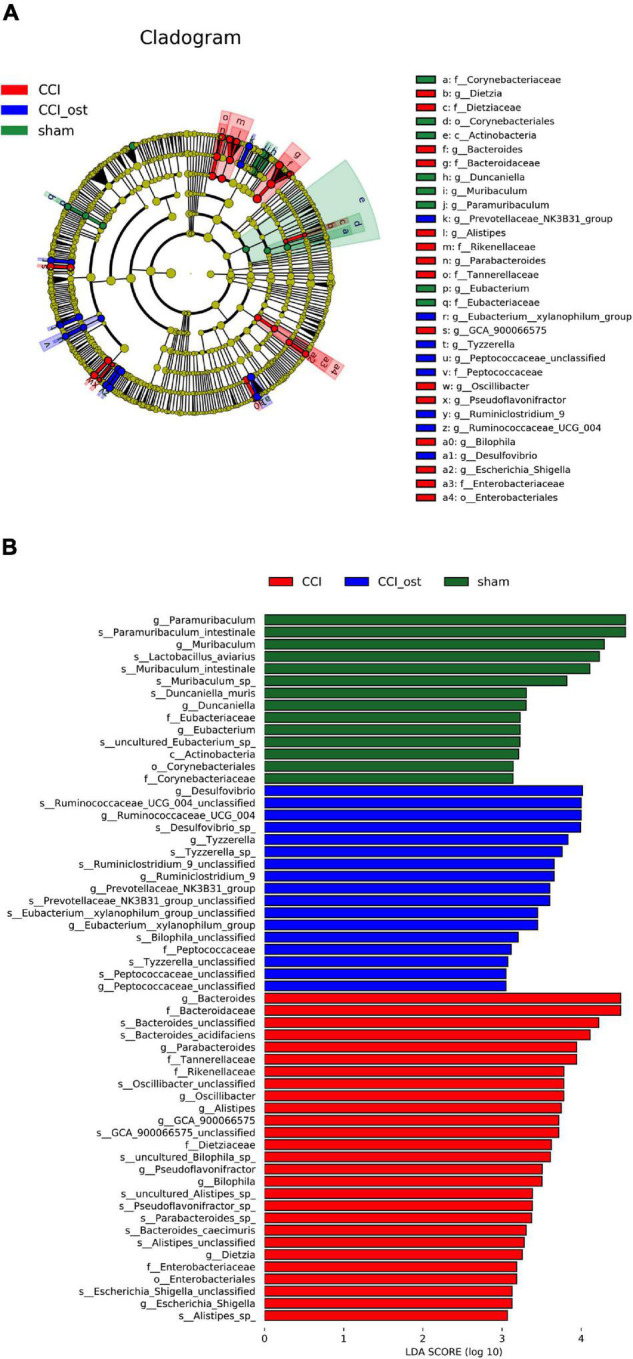
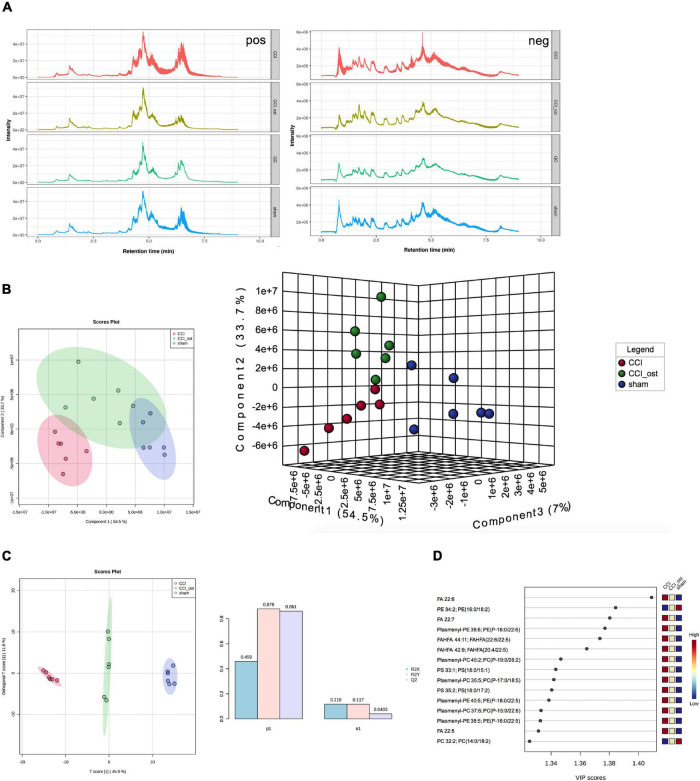
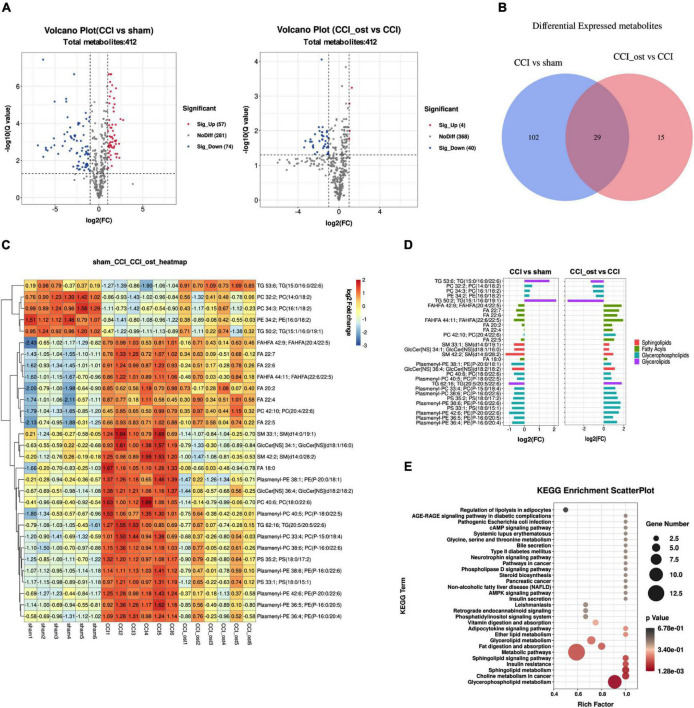
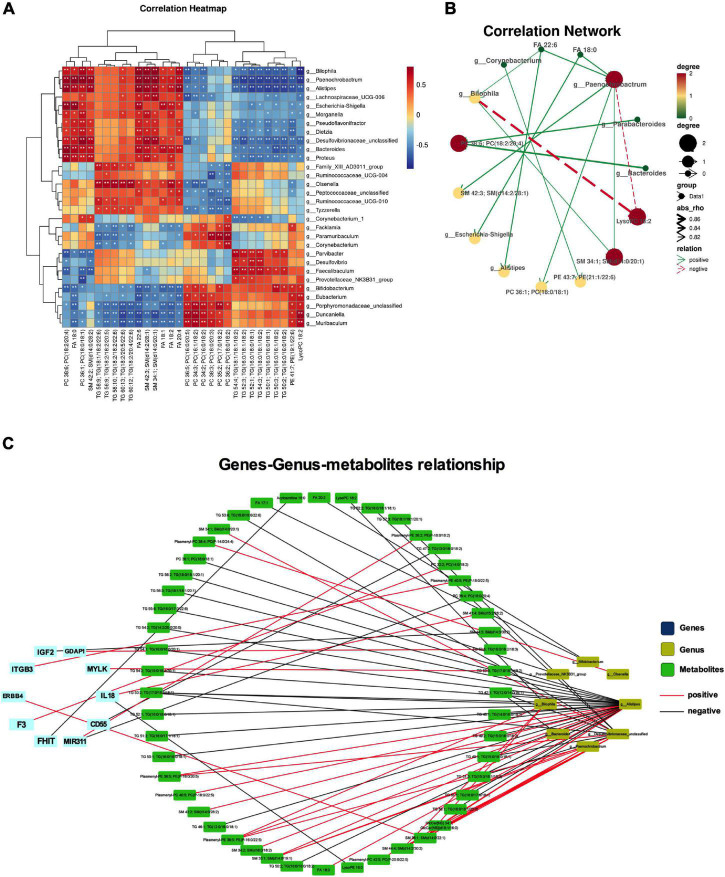
Accumulating evidence suggests that neuropathic pain (NP) is closely connected to the metabolic disorder of gut microbiota, and natural products could relieve NP by regulating gut microbiota. The purpose of this study is to investigate the important regulatory effects of osthole on gut microbiota and serum metabolites in mice with chronic constriction injury (CCI). Mice's intestinal contents and serum metabolites were collected from the sham group, CCI group, and osthole treatment CCI group. The 16S rRNA gene sequencing was analyzed, based on Illumina NovaSeq platform, and ANOVA analysis were used to analyze the composition variety and screen differential expression of intestinal bacteria in the three groups. Ultra-high-performance liquid chromatography-quadrupole time of flight-tandem mass spectrometry (UHPLC-Q-TOF-MS) was used for analyzing the data obtained from serum specimens, and KEGG enrichment analysis was used to identify pathways of differential metabolites in the treatment of neuralgia mice. Furthermore, the Pearson method and Cytoscape soft were used to analyze the correlation network of differential metabolites, gut microbiota, and disease genes. The analysis results of 16S rRNA gene sequencing displayed that Bacteroidetes, Firmicutes, and Verrucomicrobia were highly correlated with NP after osthole treatment at the phylum level. Akkermansia, Lachnospiraceae_unclassified, Lachnospiraceae_NK4A136_group, Bacteroides, Lactobacillus, and Clostridiales_unclassified exhibited higher relative abundance and were considered important microbial members at genus level in neuralgia mice. Serum metabolomics results showed that 131 metabolites were considered to be significantly different in the CCI group compared to the sham group, and 44 metabolites were significantly expressed between the osthole treatment group and the CCI group. At the same time, we found that 29 differential metabolites in the two comparison groups were overlapping. Integrated analysis results showed that many intestinal microorganisms and metabolites have a strong positive correlation. The correlation network diagram displays that 10 genes were involved in the process of osthole alleviating NP through a metabolic pathway and gut microbiota, including IGF2, GDAP1, MYLK, IL18, CD55, MIR331, FHIT, F3, ERBB4, and ITGB3. Our findings have preliminarily confirmed that NP is closely related to metabolism and intestinal microbial imbalance, and osthole can improve the metabolic disorder of NP by acting on gut microbiota.
Keywords: 16S rRNA gene sequencing; gut microbiota; neuropathic pain; osthole; serum metabolomes.
Copyright © 2022 Li, Wang, Dang, Yao, Zhang and Wang.
Conflict of interest statement
The authors declare that the research was conducted in the absence of any commercial or financial relationships that could be construed as a potential conflict of interest.
Figures
Similar articles
-
Fecal metabonomics combined with 16S rRNA gene sequencing to analyze the changes of gut microbiota in rats with kidney-yang deficiency syndrome and the intervention effect of You-gui pill.J Ethnopharmacol. 2019 Nov 15;244:112139. doi: 10.1016/j.jep.2019.112139. Epub 2019 Aug 8. J Ethnopharmacol. 2019. PMID: 31401318
-
Integrated 16S rRNA sequencing and metabolomics analysis to investigate the antidepressant role of Yang-Xin-Jie-Yu decoction on microbe-gut-metabolite in chronic unpredictable mild stress-induced depression rat model.Front Pharmacol. 2022 Sep 30;13:972351. doi: 10.3389/fphar.2022.972351. eCollection 2022. Front Pharmacol. 2022. PMID: 36249818 Free PMC article.
-
Combining fecal 16 S rRNA sequencing and spinal cord metabolomics analysis to explain the modulatory effect of PPARα on neuropathic pain.Brain Res Bull. 2024 Jun 1;211:110943. doi: 10.1016/j.brainresbull.2024.110943. Epub 2024 Apr 12. Brain Res Bull. 2024. PMID: 38614408
-
The interplay between the microbiota and opioid in the treatment of neuropathic pain.Front Microbiol. 2024 Jun 10;15:1390046. doi: 10.3389/fmicb.2024.1390046. eCollection 2024. Front Microbiol. 2024. PMID: 38919504 Free PMC article. Review.
-
Potential roles of gut microbiota and microbial metabolites in chronic inflammatory pain and the mechanisms of therapy drugs.Ther Adv Chronic Dis. 2022 Jul 28;13:20406223221091177. doi: 10.1177/20406223221091177. eCollection 2022. Ther Adv Chronic Dis. 2022. PMID: 35924009 Free PMC article. Review.
Cited by
-
Genetically supported causality between gut microbiota, gut metabolites and low back pain: a two-sample Mendelian randomization study.Front Microbiol. 2023 Apr 14;14:1157451. doi: 10.3389/fmicb.2023.1157451. eCollection 2023. Front Microbiol. 2023. PMID: 37125171 Free PMC article.
-
Gut brain interaction theory reveals gut microbiota mediated neurogenesis and traditional Chinese medicine research strategies.Front Cell Infect Microbiol. 2022 Dec 8;12:1072341. doi: 10.3389/fcimb.2022.1072341. eCollection 2022. Front Cell Infect Microbiol. 2022. PMID: 36569198 Free PMC article. Review.
-
Live and heat-killed Leuconostoc mesenteroides counteract the gastrointestinal dysfunction in chronic kidney disease mice through intestinal environment modulation.PLoS One. 2025 Feb 24;20(2):e0318827. doi: 10.1371/journal.pone.0318827. eCollection 2025. PLoS One. 2025. PMID: 39992980 Free PMC article.
-
Gut Microbiota: A Modulator and Therapeutic Target for Chronic Pain.Mol Neurobiol. 2025 May;62(5):5875-5890. doi: 10.1007/s12035-024-04663-x. Epub 2024 Dec 9. Mol Neurobiol. 2025. PMID: 39652283 Review.
-
The importance of the gut microbiome and its signals for a healthy nervous system and the multifaceted mechanisms of neuropsychiatric disorders.Front Neurosci. 2024 Jan 5;17:1302957. doi: 10.3389/fnins.2023.1302957. eCollection 2023. Front Neurosci. 2024. PMID: 38249593 Free PMC article. Review.
References
-
- Afifa A. B., Isabelle P., Claire P., Claire R., Cherryl H., Viorica B., et al. (2018). Bifidobacterium longum and Lactobacillus helveticus synergistically suppress stress-related visceral hypersensitivity through hypothalamic-pituitary-adrenal axis modulation. J. Neurogastroenterol. 1 138–146. 10.5056/jnm16167 - DOI - PMC - PubMed
-
- Alonso-Castro A. J., Guzmán-Gutiérrez S. L., Betancourt C. A., Gasca-Martinez D., Alvarez-Martinez K. L., Perez-Nicolas M., et al. (2018). Antinociceptive, anti-inflammatory, and central nervous system (CNS) effects of the natural coumarin soulattrolide. Drug Dev. Res. 79 332–338. 10.1002/ddr.21471 - DOI - PubMed
-
- Barragan-Iglesias P., Pineda-Farias J. B., Cervantes-Duran C., Bravo-Hernandez M., Rocha-Gonzalez H. I., Murbartian J., et al. (2014). Role of spinal P2Y6 and P2Y11 receptors in neuropathic pain in rats: possible involvement of glial cells. Mol. Pain 10 29–39. 10.1186/1744-8069-10-29 - DOI - PMC - PubMed
LinkOut - more resources
Full Text Sources
Miscellaneous