

Analysis of SARS-CoV-2 Variants From 24,181 Patients Exemplifies the Role of Globalization and Zoonosis in Pandemics
- PMID: 35197938
- PMCID: PMC8859183
- DOI: 10.3389/fmicb.2021.786233
Analysis of SARS-CoV-2 Variants From 24,181 Patients Exemplifies the Role of Globalization and Zoonosis in Pandemics
Expression of concern in
-
Expression of Concern: Analysis of SARS-CoV-2 variants from 24,181 patients exemplifies the role of globalization and zoonosis in pandemics.Front Microbiol. 2025 Jul 7;16:1656738. doi: 10.3389/fmicb.2025.1656738. eCollection 2025. Front Microbiol. 2025. PMID: 40693149 Free PMC article. No abstract available.
Abstract
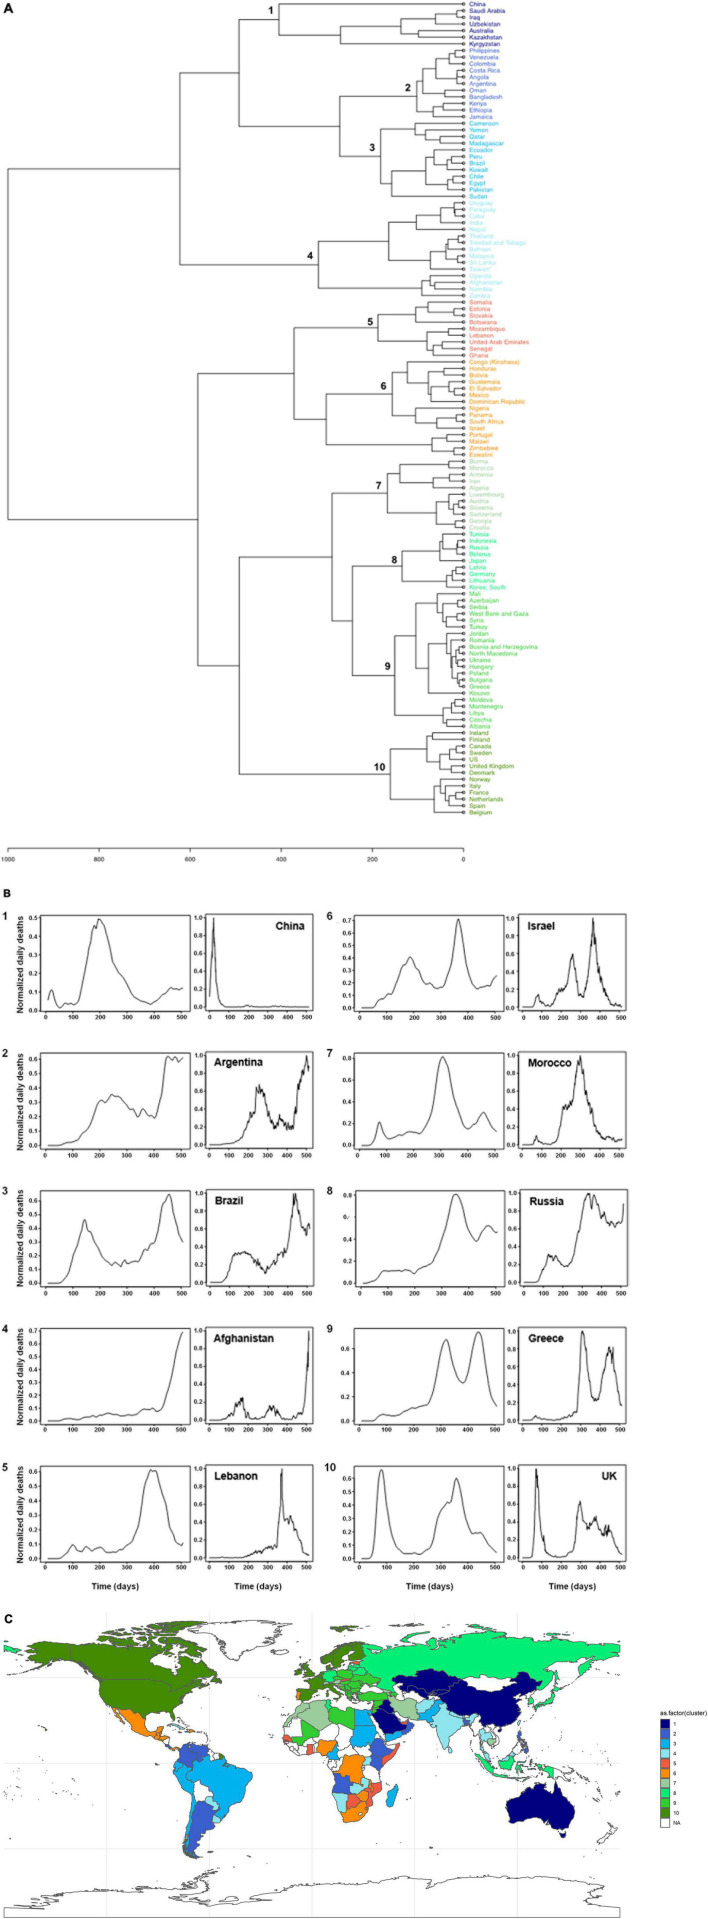
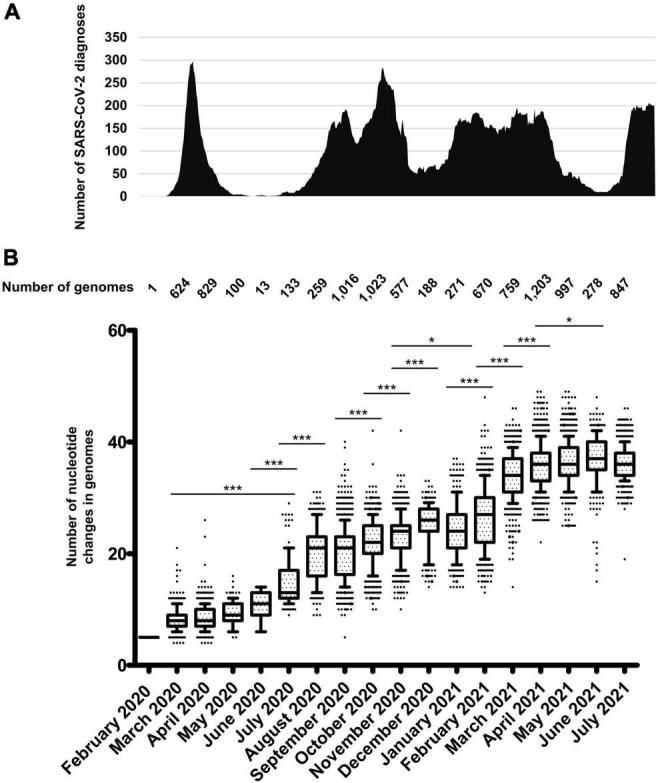
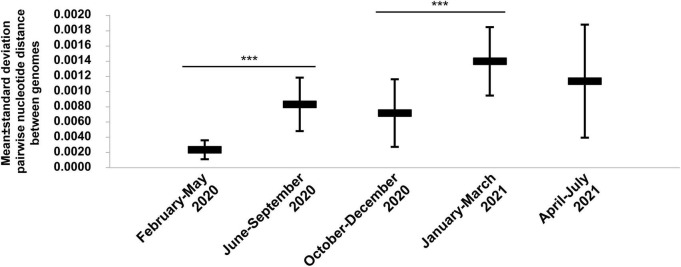
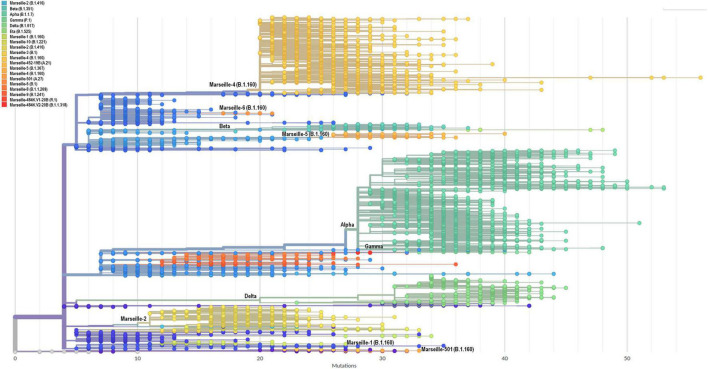
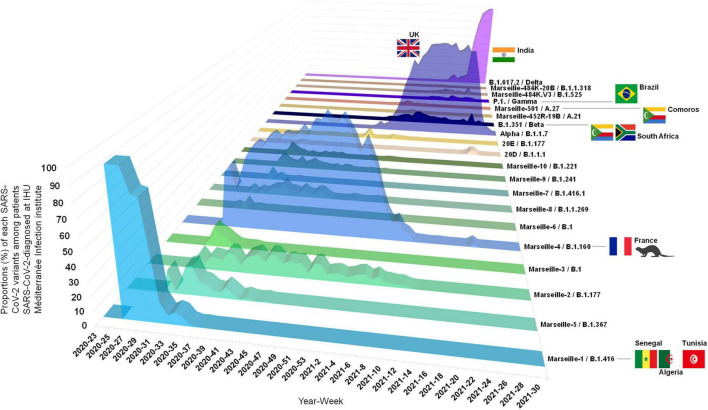
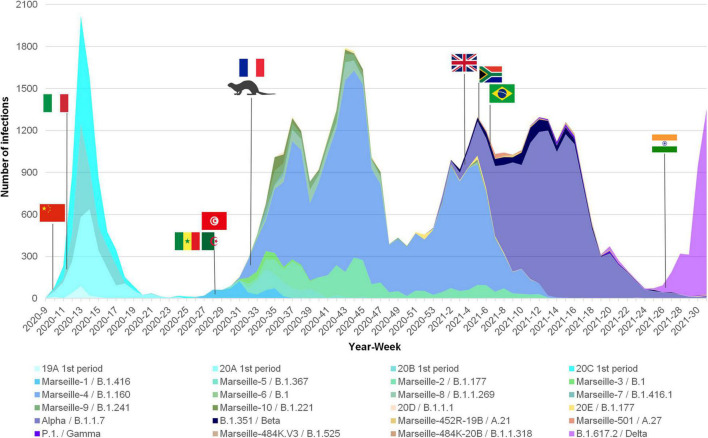
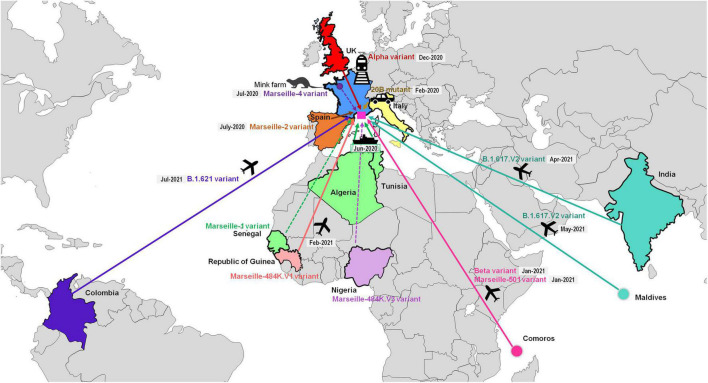
After the end of the first epidemic episode of SARS-CoV-2 infections, as cases began to rise again during the summer of 2020, we at IHU Méditerranée Infection in Marseille, France, intensified the genomic surveillance of SARS-CoV-2, and described the first viral variants. In this study, we compared the incidence curves of SARS-CoV-2-associated deaths in different countries and reported the classification of SARS-CoV-2 variants detected in our institute, as well as the kinetics and sources of the infections. We used mortality collected from a COVID-19 data repository for 221 countries. Viral variants were defined based on ≥5 hallmark mutations along the whole genome shared by ≥30 genomes. SARS-CoV-2 genotype was determined for 24,181 patients using next-generation genome and gene sequencing (in 47 and 11% of cases, respectively) or variant-specific qPCR (in 42% of cases). Sixteen variants were identified by analyzing viral genomes from 9,788 SARS-CoV-2-diagnosed patients. Our data show that since the first SARS-CoV-2 epidemic episode in Marseille, importation through travel from abroad was documented for seven of the new variants. In addition, for the B.1.160 variant of Pangolin classification (a.k.a. Marseille-4), we suspect transmission from farm minks. In conclusion, we observed that the successive epidemic peaks of SARS-CoV-2 infections are not linked to rebounds of viral genotypes that are already present but to newly introduced variants. We thus suggest that border control is the best mean of combating this type of introduction, and that intensive control of mink farms is also necessary to prevent the emergence of new variants generated in this animal reservoir.
Keywords: SARS-CoV-2; classification; epidemics; mutant; pandemics; travel; variant; zoonosis.
Copyright © 2022 Colson, Fournier, Chaudet, Delerce, Giraud-Gatineau, Houhamdi, Andrieu, Brechard, Bedotto, Prudent, Gazin, Beye, Burel, Dudouet, Tissot-Dupont, Gautret, Lagier, Million, Brouqui, Parola, Fenollar, Drancourt, La Scola, Levasseur and Raoult.
Conflict of interest statement
The authors declare that the research was conducted in the absence of any commercial or financial relationships that could be construed as a potential conflict of interest.
Figures
References
-
- Aksamentov I., Roemer C., Hodcroft E. B., Neher R. A. (2021). Nextclade: clade assignment, mutation calling and quality control for viral genomes. J. Open Source Softw. 6:3773. 10.5281/zenodo.5607694 - DOI
-
- Barbieri R., Colson P., Raoult D., Drancourt M. (2021). Two-millennia fighting against port-imported epidemics, Marseille. IHU Preprints [Preprint] 10.35088/84a4-me41 - DOI
LinkOut - more resources
Full Text Sources
Miscellaneous