. 2022 Feb 7:13:795463.
doi: 10.3389/fimmu.2022.795463. eCollection 2022.

Deep Immune Phenotyping and Single-Cell Transcriptomics Allow Identification of Circulating TRM-Like Cells Which Correlate With Liver-Stage Immunity and Vaccine-Induced Protection From Malaria

Affiliations

Deep Immune Phenotyping and Single-Cell Transcriptomics Allow Identification of Circulating TRM-Like Cells Which Correlate With Liver-Stage Immunity and Vaccine-Induced Protection From Malaria

Andrés Noé et al. Front Immunol. .

Abstract

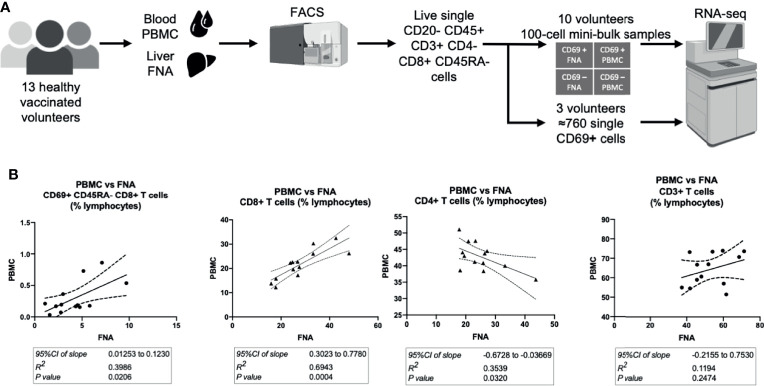
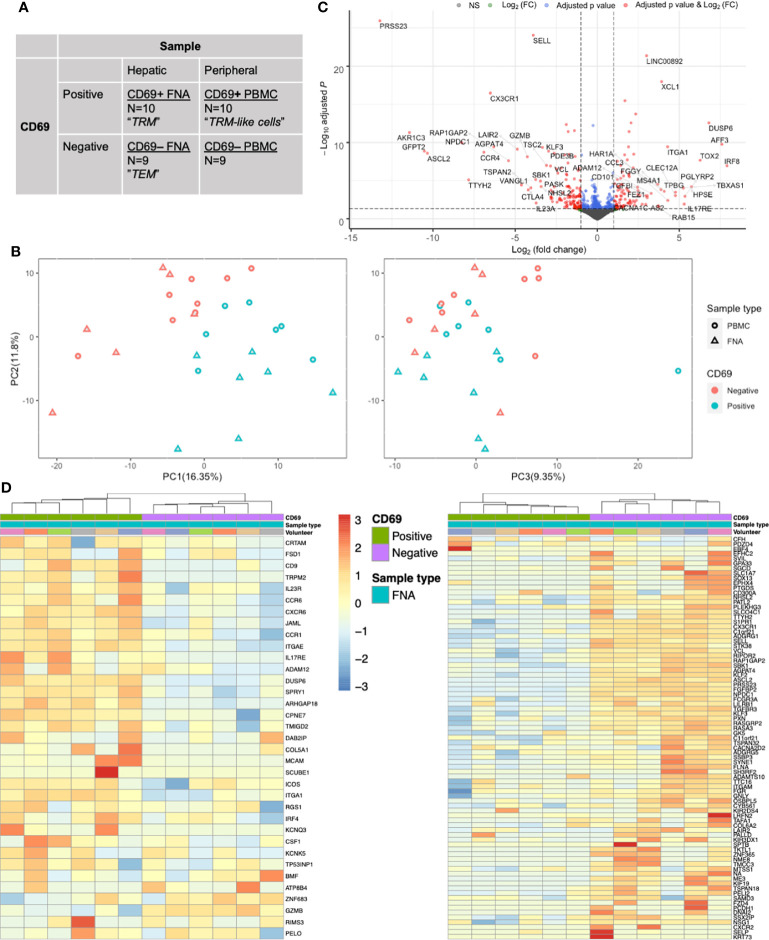
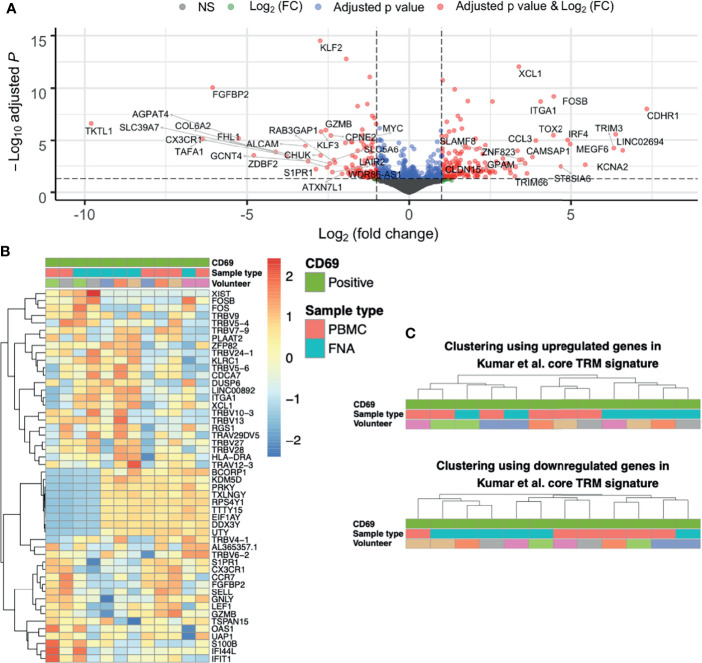
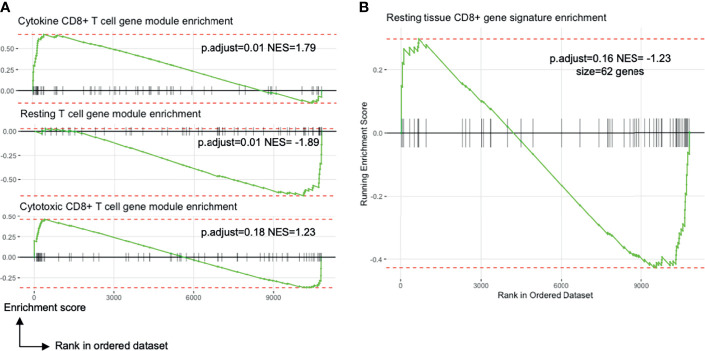
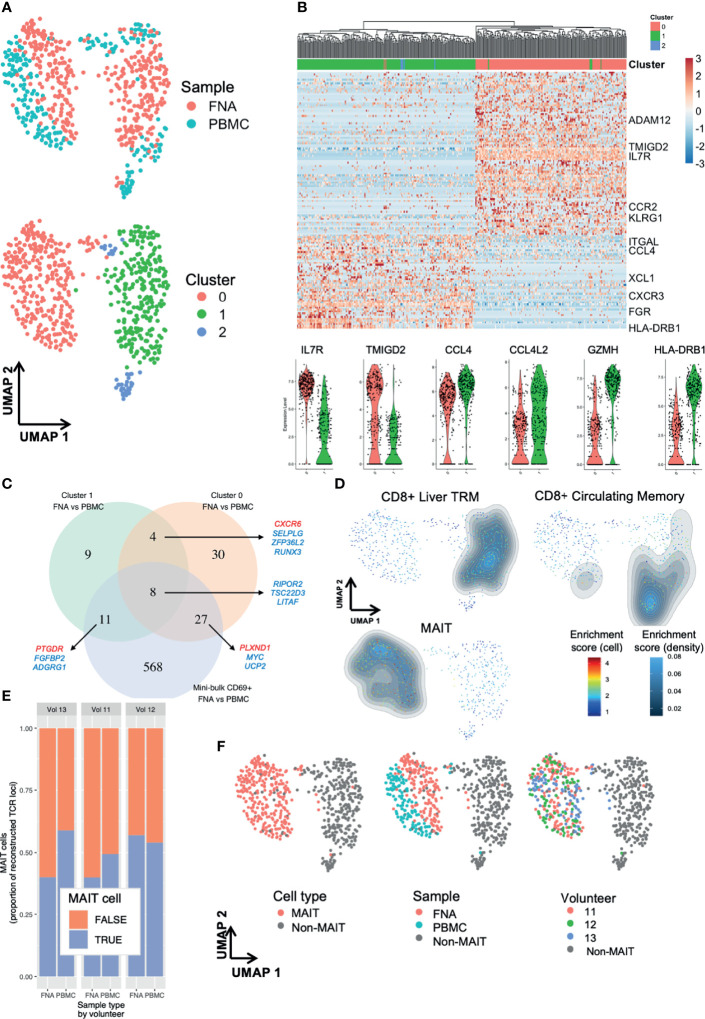
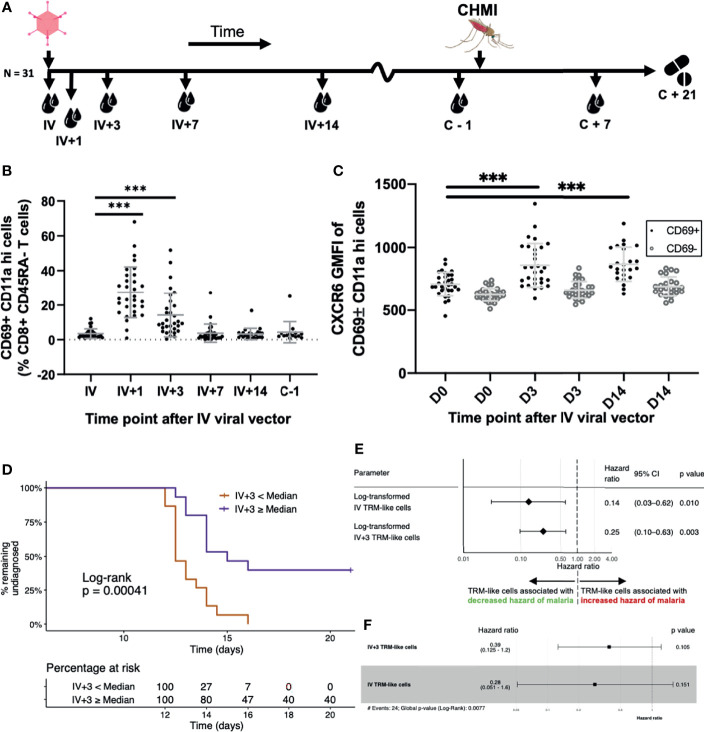
Protection from liver-stage malaria requires high numbers of CD8+ T cells to find and kill Plasmodium-infected cells. A new malaria vaccine strategy, prime-target vaccination, involves sequential viral-vectored vaccination by intramuscular and intravenous routes to target cellular immunity to the liver. Liver tissue-resident memory (TRM) CD8+ T cells have been shown to be necessary and sufficient for protection against rodent malaria by this vaccine regimen. Ultimately, to most faithfully assess immunotherapeutic responses by these local, specialised, hepatic T cells, periodic liver sampling is necessary, however this is not feasible at large scales in human trials. Here, as part of a phase I/II P. falciparum challenge study of prime-target vaccination, we performed deep immune phenotyping, single-cell RNA-sequencing and kinetics of hepatic fine needle aspirates and peripheral blood samples to study liver CD8+ TRM cells and circulating counterparts. We found that while these peripheral 'TRM-like' cells differed to TRM cells in terms of previously described characteristics, they are similar phenotypically and indistinguishable in terms of key T cell residency transcriptional signatures. By exploring the heterogeneity among liver CD8+ TRM cells at single cell resolution we found two main subpopulations that each share expression profiles with blood T cells. Lastly, our work points towards the potential for using TRM-like cells as a correlate of protection by liver-stage malaria vaccines and, in particular, those adopting a prime-target approach. A simple and reproducible correlate of protection would be particularly valuable in trials of liver-stage malaria vaccines as they progress to phase III, large-scale testing in African infants. We provide a blueprint for understanding and monitoring liver TRM cells induced by a prime-target malaria vaccine approach.

Keywords: TRM; correlates of protection (CoP); malaria vaccine; malaria vaccine decelopment; scRNA seq; tissue resident memory CD8+ T cells; tissue resident memory T cell.


Conflict of interest statement

The authors declare that the research was conducted in the absence of any commercial or financial relationships that could be construed as a potential conflict of interest.

Figures

Figure 1
Figure 1
Hepatic and circulating lymphocytes correlate numerically and phenotypically when analysed by flow cytometry. (A) Sampling workflow. 15 volunteers across all vaccination groups were recruited for liver FNA sampling. Two volunteers were unable to provide samples, due to logistical reasons, and withdrew on the sampling days. Hepatic fine needle aspirate and peripheral venesection were performed within one hour. Lymphocytes were isolated, stained for flow cytometry/cell sorting and sorted within three hours of sampling. Ten volunteers’ FNA and PBMC samples were two-way sorted for 100-cell mini-bulk RNA-sequencing and three volunteer samples were sorted for single-cell RNA-sequencing. (B) Quantitative correlations between liver and blood samples. The 95%CI of linear regression slope, R2 value of goodness of fit and the p value that the slope is significantly non-zero are presented below the respective plots. The P values were calculated by F tests. All plots are derived from 13 matched FNA and PBMC samples. All values are presented as a proportion of single CD45+ lymphocytes in each sample. FNA, fine needle aspirate. PBMC, peripheral blood mononuclear cells. tSNE, t-distributed stochastic neighbour embedding. CI, confidence interval. FNA, fine needle aspirate. GMFI, geometric mean fluorescence intensity. PBMC, peripheral blood mononuclear cells. tSNE, t-distributed stochastic neighbour embedding.
Figure 2
Figure 2
CD69 status is a major driver of transcriptional differences in memory CD8+ T cells as assessed by mini-bulk RNA-seq. (A) Mini-bulk RNA-seq experimental design. Each category was composed of N number of 100-cell samples pre-gated on live single CD20- CD45+ CD3+ CD4- CD8+ CD45RA- cells sequenced in bulk by the SmartSeq2 protocol. Two volunteers’ samples and one FNA paired (CD69+ and CD69-) samples were removed during QC. Non-normalised counts were input to DESeq2 and samples were paired according to volunteer and sample type. Differential expression analyses used a generalised linear model where counts were modelled using a negative binomial distribution. The Wald test was the default used for hypothesis testing when comparing gene expression between two sets of paired variables. See Figure 1A for sampling workflow. (B) PCA plots based on the 500 most variable genes by mini-bulk RNA sequencing. Plots of the first three PC, coloured according to CD69 status and sample type of the sequenced cells. Separation of CD69+ and CD69- cells was a composite of PC1 and PC2. PC3 does not distinguish CD69 status. Twenty-eight samples were analysed. (C) Volcano plot of up- and down-regulated genes between paired FNA CD69+ samples and CD69- samples. The top 50 up- and down-regulated genes have been annotated. Positive log(FC) values indicate greater gene expression in CD69+ samples, compared to CD69- samples. Negative log(FC) values indicate greater gene expression in CD69- samples. Differential expression of the 12,515 genes was tested for significance using the Wald test. P values were adjusted using the Benjamini-Hochberg (false discovery rate) correction. (D) Gene heatmap of FNA samples using the core TRM cell transcriptional signature described by Kumar et al. Left, heatmap of genes that are upregulated in the CD8+ Kumar et al. core transcriptional signature. Right, heatmap of genes that are downregulated in the CD8+ Kumar et al. core transcriptional signature. Columns are clustered based on Spearman’s correlation of rlog normalised count values. Rows are clustered according to Pearson correlation of the rlog normalised gene counts. Gene count values are centred and scaled across rows. FACS, fluorescence-assisted cell sorting; FC, fold change; FNA, fine needle aspirate; PBMC, peripheral blood mononuclear cells; PC, principal component; PCA, principal component analysis; QC, quality control; TEM, effector memory T cell; TRM, tissue-resident memory T cell.
Figure 3
Figure 3
The differences between CD69+ CD8+ T cells isolated from liver and blood are unique and not like those when comparing TRM and TEM cells. (A) Volcano plot of up- and down-regulated genes between paired FNA CD69+ and PBMC CD69+ samples. The top 50 up- and down-regulated genes have been annotated. Positive log(FC) values indicate greater gene expression in FNA CD69+ samples, compared to PBMC CD69+ samples. Negative log(FC) values indicate greater gene expression in PBMC CD69+ samples. DGE of 11,933 genes was tested for significance using the Wald test. P values were adjusted using the Benjamini-Hochberg correction (false discovery rate). (B) Heatmap of the most variable genes in the FNA CD69+ vs PBMC CD69+ comparison. Fifty most variable genes between FNA CD69+ and PBMC CD69+ samples. Yellow/red corresponds to increased counts compared to other samples and blue corresponds to decreased counts. Genes selected according to those with the greatest variance across samples. Columns are clustered based on Spearman’s correlation of rlog normalised count values. Rows are clustered according to Pearson correlation of the rlog normalised gene counts. Gene count values are centred and scaled across rows. (C) Clustering of FNA and PBMC CD69+ samples using expression of TRM cell genes. Hierarchical clustering trees based on Spearman’s correlation of sample rlog normalised count values considering up- and down-regulated genes in CD8+ Kumar et al. core TRM cell transcriptional signature. FC, fold change; FNA, fine needle aspirate; PBMC, peripheral blood mononuclear cells; rlog, regularised logarithm; TRM, tissue-resident memory T cell.
Figure 4
Figure 4
Blood TRM-like cells may not be only activated memory T cells. All plots show the comparison of liver TRM and blood TRM-like cells (see Figure 2A ). (A) Enrichment plots of gene expression modules related to T cell transcriptional states identified by Szabo and colleagues. The CD8+ cytokine module includes genes encoding chemokines and cytokines (CCL3, CCL4, CCL20) and inhibitory molecules (LAG3, CD226, HAVCR2). The resting T cell module involves genes important for CD4+ and CD8+ T cell survival in blood and in tissues. The CD8+ cytotoxic module includes genes associated with cytotoxicity (GNLY, GZMK) and transcription factors associated with effector/memory differentiation (ZEB2, EOMES, ZNF683). NES is the enrichment score normalised to the mean enrichment of random samples of the same size. (B) Enrichment plot of a tissue CD8+ T cell signature identified by Szabo and colleagues (23). The complement of genes is derived by differential expression analyses between resting CCL5++ CD8+ memory T cells from several tissues compared to blood. FDR, false discovery rate; FNA, fine needle aspirate; GSEA, gene set enrichment analysis; GTPase, guanosine triphosphate hydrolase; MHC, major histocompatibility complex; ORA, over-representation analysis; p.adjust, Benjamini-Hochberg adjusted p value; PBMC, peripheral blood mononuclear cells.
Figure 5
Figure 5
Single-cell RNA-sequencing reveals subpopulations of liver TRM and blood TRM-like cells. Single cell differences between TRM and TRM-like cells depend on TRM cell cluster. (A) UMAP plots of 629 single cells. Plots according to sample type and Seurat cluster. Seurat FindClusters was run at 0.4 resolution. Each point represents one cell, either a PBMC or FNA live single CD20- CD3+ CD45+ CD8+ CD4- CD45RA- CD69+ lymphocyte FACS sorted and sequenced by the SmartSeq2 protocol. Six hundred and twenty-nine cells are presented in these plots. (B) Gene heatmap of the C1 TRM vs C0 TRM cell comparison. Cell gene count is centred and scaled across all row values. A sample of genes are shown, a full list of the 142 genes differentially expressed between C1 and C0 TRM cells is available in the source data file. All genes shown here were present in at least 50% of cells in each cluster, had |ln(FC)|>0.5 and an adjusted p value (Bonferroni correction)<0.05. The row hierarchical clustering dendrogram is based on Euclidean distances of cell gene count values considering all genes. Violin plots of gene expression of six selected genes are presented below. The violin colour corresponds to FNA cell cluster of origin, as seen in (A, C) Venn diagram of genes differentiating TRM and TRM-like cells. Venn diagram demonstrating the degree of convergence of cluster-level DGE and mini-bulk-level DGE. All included genes from single cell contrasts had a |ln(FC)|>0.25 and an adjusted p value (Bonferroni correction)<0.05 and the genes from mini-bulk contrasts had |log2(FC)|>1 and an FDR < 0.05. DGE, differential gene expression. The mini-bulk contrast refers to that which is presented in Figures 3 , 4 . A sample of the genes that are shared among the datasets is illustrated; blue indicates the gene is down-regulated in FNA CD69+ cells and red indicates the gene is up-regulated in FNA CD69+ cells, compared to blood CD69+ cells. (D) UMAP plots with signature enrichment scores. The enrichment of three signatures was assessed for each of the 629 cells and visualised in the UMAP by Single-Cell Signature Explorer (44). The per-cell signature enrichment was plotted, and density distribution of scores was overlaid. The signature scores represent a qualitative measure for visualisation. The signatures were obtained from Zhao et al. (22). (E) Proportion of recombinants that were derived from MAIT cells. MAIT cells were defined based on TCR α locus: any cell that expressed TRAV1-2 paired with TRAJ33, TRAJ12 or TRAJ20 was defined as a MAIT cell, regardless of the TCR β locus recombinant, if present. Any recombinant derived from a MAIT cell was labelled as such and excluded from non-MAIT cell analyses. (F) UMAP of 629 single cells with plots according to cluster, MAIT cell TCR, sample type and volunteer. In all plots, grey points (“non-MAIT”) represent cells that were either not classified as MAIT cells or cells for which TCR reconstruction could not be performed. Seurat FindClusters was run at 0.4 resolution, using a shared nearest neighbour clustering method. C, cluster; DGE, differential gene expression; FACS, fluorescence-assisted cell sorting; FDR, false discovery rate; FNA, fine needle aspirate; PBMC, peripheral blood mononuclear cells; MAIT, mucosal-associated invariant T cell; TRM, tissue-resident memory T cell; UMAP, uniform manifold approximation and projection.
Figure 6
Figure 6
Blood TRM-like cells can be used to estimate the hazard of malaria diagnosis after CHMI. (A) Sampling workflow. Thirty-one volunteers across all vaccination groups were sampled at several time points following IV viral vector (IV+ timepoints) and around controlled human malaria infection. One volunteer from this cohort was not challenged. Five more control (non-vaccinated) volunteers were challenged and followed up at pre- and post-challenge time points, only. All volunteers were treated with standard anti-malarial therapy at day 21 post-CHMI or, if earlier, when they met our diagnostic criteria for malaria (see methods). (B) TRM-like cells after IV administration of viral vector. Frequency of circulating CD69+CD11ahi cells (as a proportion of CD8+CD45RA- cells) by time point. Comparisons were assessed using ratio paired t tests. Lines represent significant differences between the bound groups; bars show mean and standard deviation. (C) The GMFI of TRM-like cell CXCR6 at three different time points following IV viral vector. Comparisons were assessed using ratio paired t tests. Lines represent significant differences between the bound groups; bars show mean and standard deviation. Matched GMFI values of CD69- cells are also presented for reference. *** represents a p value < 0.0001. (D) Kaplan Meier curve using TRM-like cells 3 days after IV viral vector to stratify volunteers. Volunteers were stratified according to whether their TRM-like cell fraction (as a proportion of CD8+ CD45RA- cells) at day 3 after IV viral vector was above or below the median of all values. A log-rank test was performed to test for difference in survival (delay/lack of malaria diagnosis). The risk table shows the percentage of volunteers, in each stratum, at risk of malaria diagnosis at five representative time points. Right censoring occurred at 21 days as all undiagnosed volunteers received antimalarial therapy at this time. (E) Univariate Cox regression models using TRM−like cells [CD69+ CD11a hi frequency (% CD45RA- CD8+ CD3+ T cells)] measured at two time points. Each regression model estimated the effect that the variable had on an individual’s hazard of being diagnosed with malaria after CHMI. Hazard ratios less than one suggested that an increase in the TRM−like cell frequency decreased the instantaneous risk of malaria diagnosis over the study period. Hazard ratios greater than one suggested that a decrease in TRM−like cell frequency increased the instantaneous risk of malaria diagnosis over the study period. Log transformation was applied to the TRM−like cell frequency, and regression was performed on these values. The p value was calculated using a Wald test, with a null hypothesis that the parameter did not alter the hazard of malaria diagnosis after CHMI. (F) Multivariate Cox regression model using TRM like cells [CD69+ CD11a hi frequency (% CD45RA- CD8+ CD3+ T cells)] measured at two time points: IV and IV+3. Hazard ratios and 95%CI are presented. Log transformation was applied to the TRM−like cell frequency, and regression was performed on these values. The individual variable p values were calculated using a Wald test. The global p value was calculated using a Score (log−rank) test. Events refers to the number of volunteers that were diagnosed with malaria. AIC, Akaike information criterion; C, challenge; CHMI, controlled human malaria infection; D, day; GMFI, geometric mean fluorescence intensity; IV, intravenous viral vector administration; TRM, tissue-resident memory T cell.

References

    1. Romero P, Maryanski JL, Corradin G, Nussenzweig RS, Nussenzweig V, Zavala F. Cloned Cytotoxic T Cells Recognize an Epitope in the Circumsporozoite Protein and Protect Against Malaria. Nature (1989) 341(6240):323–6. doi: 10.1038/341323a0 - DOI - PubMed
    1. Bliss CM, Bowyer G, Anagnostou NA, Havelock T, Snudden CM, Davies H, et al. . Assessment of Novel Vaccination Regimens Using Viral Vectored Liver Stage Malaria Vaccines Encoding ME-TRAP. Sci Rep (2018) 8(1):3390. doi: 10.1038/s41598-018-21630-4 - DOI - PMC - PubMed
    1. Ewer KJ, Lambe T, Rollier CS, Spencer AJ, Hill AV, Dorrell L. Viral Vectors as Vaccine Platforms: From Immunogenicity to Impact. Curr Opin Immunol (2016) 41:47–54. doi: 10.1016/j.coi.2016.05.014 - DOI - PubMed
    1. Ewer KJ, O’Hara GA, Duncan CJ, Collins KA, Sheehy SH, Reyes-Sandoval A, et al. . Protective CD8+ T-Cell Immunity to Human Malaria Induced by Chimpanzee Adenovirus-MVA Immunisation. Nat Commun (2013) 4:2836. doi: 10.1038/ncomms3836 - DOI - PMC - PubMed
    1. Hodgson SH, Ewer KJ, Bliss CM, Edwards NJ, Rampling T, Anagnostou NA, et al. . Evaluation of the Efficacy of ChAd63-MVA Vectored Vaccines Expressing Circumsporozoite Protein and ME-TRAP Against Controlled Human Malaria Infection in Malaria-Naive Individuals. J Infect Dis (2015) 211(7):1076–86. doi: 10.1093/infdis/jiu579 - DOI - PMC - PubMed

Publication types

Substances