. 2022 Feb 7:13:796481.
doi: 10.3389/fimmu.2022.796481. eCollection 2022.

Sustained Antibody-Dependent NK Cell Functions in Mild COVID-19 Outpatients During Convalescence

Affiliations

Sustained Antibody-Dependent NK Cell Functions in Mild COVID-19 Outpatients During Convalescence

Francisco Fuentes-Villalobos et al. Front Immunol. .

Abstract

The coronavirus disease 2019 (COVID19) pandemic has left researchers scrambling to identify the humoral immune correlates of protection from COVID-19. To date, the antibody mediated correlates of virus neutralization have been extensively studied. However, the extent that non-neutralizing functions contribute to anti-viral responses are ill defined. In this study, we profiled the anti-spike antibody subtype/subclass responses, along with neutralization and antibody-dependent natural killer cell functions in 83 blood samples collected between 4 and 201 days post-symptoms onset from a cohort of COVID-19 outpatients. We observed heterogeneous humoral responses against the acute respiratory syndrome coronavirus 2 (SARS-CoV-2) spike protein. Overall, anti-spike profiles were characterized by a rapid rise of IgA and sustained IgG titers. In addition, strong antibody-mediated natural killer effector responses correlated with milder disease and being female. While higher neutralization profiles were observed in males along with increased severity. These results give an insight into the underlying function of antibodies beyond neutralization and suggest that antibody-mediated natural killer cell activity is a key function of the humoral response against the SARS-CoV-2 spike protein.

Keywords: COVID-19; Fc-effector functions; NK cells activity; SARS-CoV-2; outpatients; spike (S) glycoprotein.


Conflict of interest statement

Authors JLG and RA were employed by company Ichor Biologics LLC. JLG and RA were partially supported by Ichor Biologics LLC. The remaining authors declare that the research was conducted in the absence of any commercial or financial relationships that could be construed as a potential conflict of interest.

Figures

Figure 1
Figure 1
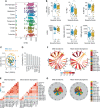
The humoral response mounted against SARS-CoV-2 Spike is heterogeneously represented up to 6 months after the onset of symptoms in COVID-19 outpatients. (A) Heatmap showing the humoral immune response for each patient ordered from the earliest to the latest collected sample (83 COVID-19 samples from 70 donors). The color scale represents the Z-scores calculated independently for each variable. (B) Spike and RBD-specific titers for IgM, IgA, and IgG antibodies measured as AUC (Area Under Curve) are displayed according to their respective sampling day from the onset of symptoms (83 COVID-19 samples from 70 donors and 14 controls). Loess estimation curve for COVID-19 samples is displayed in blue with gray-area indicating standard-error. Dotted line indicates the threshold of mean values from healthy donors plus two standard deviations. (C) Spike-specific IgG1, IgG2, IgG3, and IgG4 sub-class Abs measured as OD490 values are displayed according to their respective sampling day from the onset of symptoms (83 COVID-19 samples from 70 donors and the mean of controls). Loess estimation curve for COVID-19 samples is displayed in blue with gray-area indicating standard-error. Dotted line indicates the threshold of mean values from healthy donors. (D) Spike-specific functions of sera are displayed according to their respective sampling day from the onset of symptoms. Ab-dependent NK degranulation, measured as the frequency of CD107a+ NK cells; Ab-dependent NK activation, measured as the frequency of IFNγ+ and MIP1β+ NK cells; plus their neutralizing ability, measured as NT50 values (83 COVID-19 samples from 70 donors and 14 controls). Loess estimation curve for COVID-19 samples is displayed in blue with gray-area indicating standard-error. Dotted line indicates the threshold of mean values from healthy donors plus two standard deviations. Dotted line in NT50 indicates the reciprocal of the initial sera dilution used in the assay.
Figure 2
Figure 2
Ab-dependent NK effector functions are represented during the early phase and shown to be sustained six months after symptoms onset in COVID-19 outpatients. (A) A scatter plot showing linear regressions for Spike and RBD-specific titers for IgM, IgA, and IgG antibodies shown as AUC (Area Under Curve) values against their respective Ab-dependent functions: Ab-dependent NK degranulation, shown as the frequency of CD107a+ NK cells; Ab-dependent NK activation, shown as the frequency of IFNγ+ and MIP1β+ NK cells; plus neutralizing ability, shown as NT50 values (83 samples from 70 donors). Colored or gray circles display Spike or RBD-specific titers, respectively. (B) Correlation heatmap showing the Spearman’s r values between the complete set of variables analyzed for the entire cohort of COVID-19 outpatients (83 samples from 70 donors). The scale of blue-to-red color indicates a negative-to-positive correlation. Asterisks are shown for statistical significance of Holm-Bonferroni adjusted for multiple hypothesis testing (*p < 0.05). (C) Circos plot showing the significant Spearman correlations between the pairs of variables displayed with asterisks in (B). The color of the links represents the magnitude of Spearman’s r values. (D) Biplot showing the principal component analysis (PCA) depicting the “early” and “late” convalescence samples distinguished based on their sampling from the onset of symptoms (Early ≤ 43 days; Late > 43 days) (83 samples from 70 donors). (E) Contribution of variables for both dimensions (1 and 2) in the PCA analysis. (F) Correlation heatmap showing the Spearman’s r values between the complete set of variables analyzed for early-sampled (42 samples from 42 donors) and late-sampled (41 samples from 31 donors) groups of outpatients. A scale of blue-to-red color indicates a negative-to-positive correlation. Asterisks are shown for statistical significance of Holm-Bonferroni adjusted for multiple hypothesis testing (*p < 0.05). (G) Circos plot showing the significant Spearman correlations between the pairs of variables displayed with an asterisk in (F) for early-sampled and late-sampled groups of outpatients. The color of the links represents the magnitude of Spearman’s r values. (H) Polar plots showing the differential composition of humoral immune responses in different groups. Each bar represents the mean z-scores of variables for early-sampled (42 samples from 42 donors) or late-sampled (41 samples from 31 donors) outpatients.
Figure 3
Figure 3
Ab-dependent NK effector functions are prominently enriched in subjects with mild symptoms compared to subjects with more severe symptoms outpatients. (A) Box plots showing the neutralization function activity grouped according to different symptoms reported by patients at the time of diagnosis (70 donors). (B) Box plots showing differentially enriched functions and Ab titers according to the severity score of symptoms. Statistical differences were evaluated between groups of outpatients classified as 0-2 (33 samples and 33 donors) or 3-5 scores (37 samples and 37 donors), using two-tailed unpaired nonparametric Mann-Whitney test (*p value < 0.05). (C) Biplot showing the principal component analysis (PCA) depicting the “mild” (39 samples and 33 donors) and “more severe” (44 samples and 37 donors) COVID-19 outpatients, distinguished based on their severity scores, between 0 and 2 (mild) or between 3 and 5 (more severe). (D) Contribution of variables for both dimensions (1 and 2) in the PCA analysis. (E) Correlation heatmap showing the Spearman’s r values between the complete set of variables analyzed for mild-scored (33 samples from 33 donors) and more severe-scored (37 samples from 37 donors) groups of outpatients. The scale of blue-to-red color indicates a negative-to-positive correlation. Asterisks are shown for statistical significance of Holm-Bonferroni adjusted for multiple hypothesis testing (*p < 0.05). (F) Circos plot showing significant Spearman correlations between the pairs of variables displayed with an asterisk in (E) for mild-scored and more severe-scored groups of outpatients. The color of the links represents the magnitude of Spearman’s r values. (G) Polar plots showing the differential composition of humoral immune responses at different groups. Each bar represents the mean z-scores of variables for mild-scored (33 samples from 33 donors) or more severe-scored (37 samples from 37 donors) outpatients.
Figure 4
Figure 4
Ab-dependent NK effector functions are prominently enriched in mild compared to more severe outpatients up to 6 months from the onset of symptoms. (A, B) Biplot showing the principal component analysis (PCA) depicting the early-mild (21 samples from 21 donors) and early-more severe (21 samples from 21 donors) sub-groups of COVID-19 outpatients (A); the late-mild (18 samples from 12 donors) and late-more severe (23 samples from 18 donors) sub-groups of COVID-19 outpatients (B). The bar graph shows the contribution of variables for both dimensions (1 and 2) in the PCA analysis. (C, D) Correlation heatmap showing the Spearman’s r values between the complete set of variables analyzed for early-mild (21 samples from 21 donors) and early-more severe (21 samples from 21 donors) sub-groups of outpatients (C); or for late-mild (18 samples from 12 donors) and late-more severe (23 samples from 18 donors) sub-groups of outpatients (D). The scale of blue-to-red color indicates a negative-to-positive correlation. (E, F) Circos plot showing significant Spearman correlations without adjustment between the pairs of variables displayed in (C) or (D) for early-mild and early-more severe sub-groups of outpatients (E); or for late-mild and late-more severe sub-groups of outpatients (F). The color of the links represents the magnitude of Spearman’s r values. (G, H) Polar plots showing the differential composition of humoral immune responses at different sub-groups. Each bar represents the mean z-scores of variables for early-mild (21 samples from 21 donors) or more early-more severe outpatients (21 samples from 21 donors) (G); and for late-mild (18 samples from 12 donors) or more late-more severe outpatients (23 samples from 18 donors) (H).
Figure 5
Figure 5
Ab-dependent NK effector functions but not neutralization, are better sustained in females compared to males up to 6 months from the onset of symptoms. (A, B) Biplot showing the principal component analysis (PCA) depicting the early-female (20 samples from 19 donors) and early-male (22 samples from 21 donors) sub-groups of COVID-19 outpatients (A); the late-female (12 samples from 10 donors) and late-male (29 samples from 21 donors) sub-groups of COVID-19 outpatients (B). The bar graphs show the contribution of variables for both dimensions (1 and 2) in the PCA analyses. (C, D) Correlation heatmap shows the Spearman’s r values between the complete set of variables analyzed for early-female (20 samples from 19 donors) and early-male severe (22 samples from 21 donors) sub-groups of outpatients (C); or for late-female (12 samples from 10 donors) and late-male (29 samples from 21 donors) sub-groups of outpatients (D). A scale of blue-to-red color indicates a negative-to-positive correlation. (E, F) Circos plot shows significant Spearman correlations without adjustment between the pairs of variables displayed in (C) or (D) for early-female and early-male sub-groups of outpatients (E); or for late-female and late-male sub-groups of outpatients (F). The color of the links represents the magnitude of Spearman’s r values. (G, H) Polar plots showing the differential composition of humoral immune responses at different sub-groups. Each bar represents the mean z-scores of variables for early-female (20 samples from 19 donors) or early-male outpatients (22 samples from 21 donors) (G); and late-female (12 samples from 10 donors) or late-male outpatients (29 samples from 21 donors) (H).

References

    1. Hu B, Guo H, Zhou P, Shi ZL. Characteristics of SARS-Cov-2 and COVID-19. Nat Rev Microbiol (2021) 19(3):141–54. doi: 10.1038/s41579-020-00459-7 - DOI - PMC - PubMed
    1. He X, Lau EHY, Wu P, Deng X, Wang J, Hao X, et al. . Temporal Dynamics in Viral Shedding and Transmissibility of COVID-19. Nat Med (2020) 26(5):672–5. doi: 10.1038/s41591-020-0869-5 - DOI - PubMed
    1. Wu Z, McGoogan JM. Characteristics of and Important Lessons From the Coronavirus Disease 2019 (COVID-19) Outbreak in China: Summary of a Report of 72314 Cases From the Chinese Center for Disease Control and Prevention. JAMA (2020) 323(13):1239–42. doi: 10.1001/jama.2020.2648 - DOI - PubMed
    1. Yang R, Gui X, Xiong Y. Comparison of Clinical Characteristics of Patients With Asymptomatic vs Symptomatic Coronavirus Disease 2019 in Wuhan, China. JAMA Netw Open (2020) 3(5):e2010182. doi: 10.1001/jamanetworkopen.2020.10182 - DOI - PMC - PubMed
    1. Guan WJ, Ni ZY, Hu Y, Liang WH, Ou CQ, He JX, et al. . Clinical Characteristics of Coronavirus Disease 2019 in China. N Engl J Med (2020) 382(18):1708–20. doi: 10.1056/NEJMoa2002032 - DOI - PMC - PubMed

Publication types