Clinical Trial
. 2022 Feb 7:13:817876.
doi: 10.3389/fimmu.2022.817876. eCollection 2022.

Children and Adults With Mild COVID-19: Dynamics of the Memory T Cell Response up to 10 Months

Affiliations
Clinical Trial

Children and Adults With Mild COVID-19: Dynamics of the Memory T Cell Response up to 10 Months

Patricia Kaaijk et al. Front Immunol. .

Erratum in

Abstract

Background: Severe acute respiratory syndrome coronavirus-2 (SARS-CoV-2) has led to considerable morbidity/mortality worldwide, but most infections, especially among children, have a mild course. However, it remains largely unknown whether infected children develop cellular immune memory.

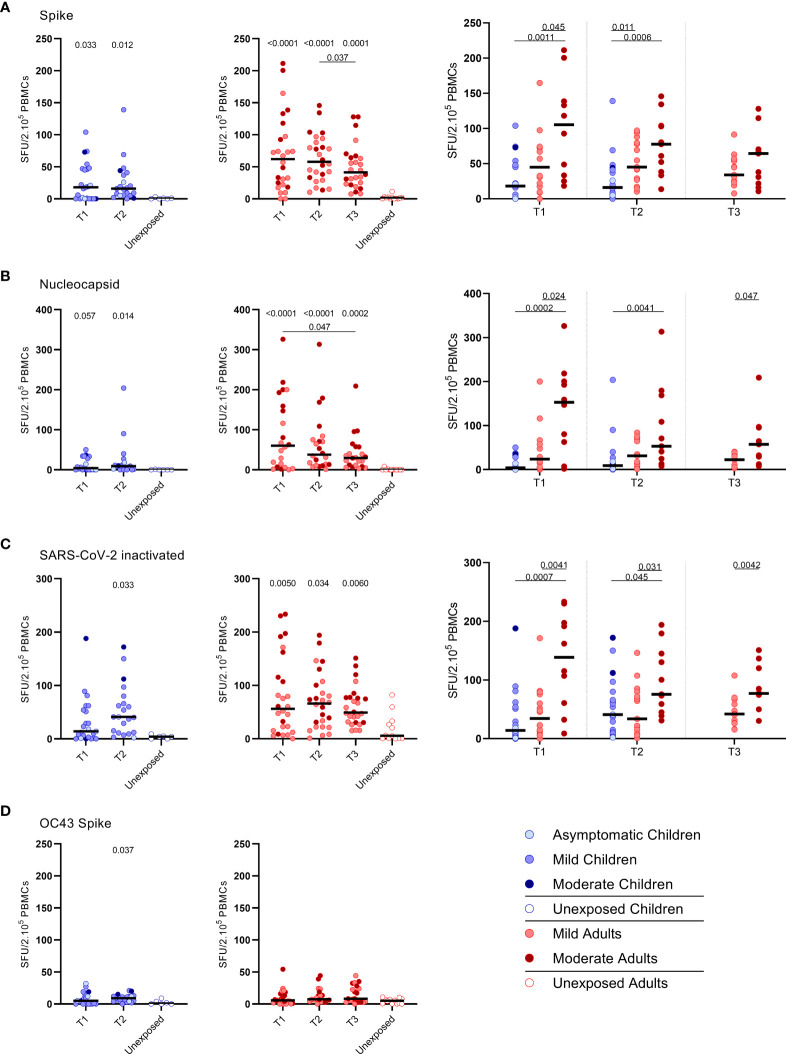
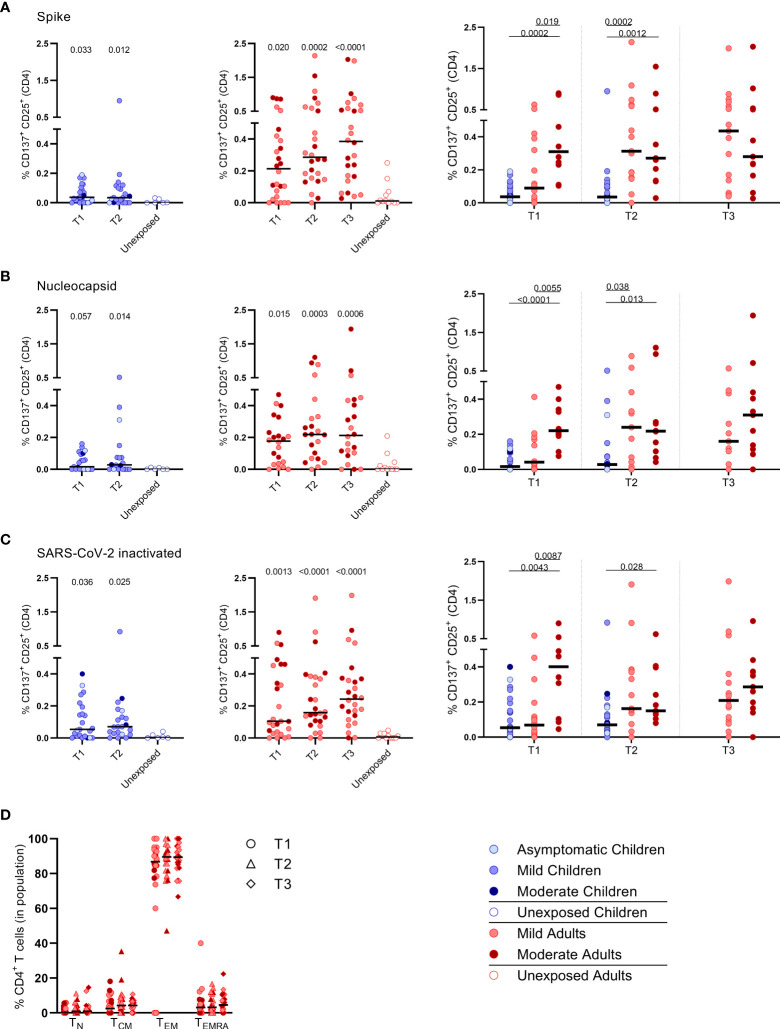
Methods: To determine whether a memory T cell response is being developed, we performed a longitudinal assessment of the SARS-CoV-2-specific T cell response by IFN-γ ELISPOT and activation marker analyses of peripheral blood samples from unvaccinated children and adults with mild-to-moderate COVID-19.

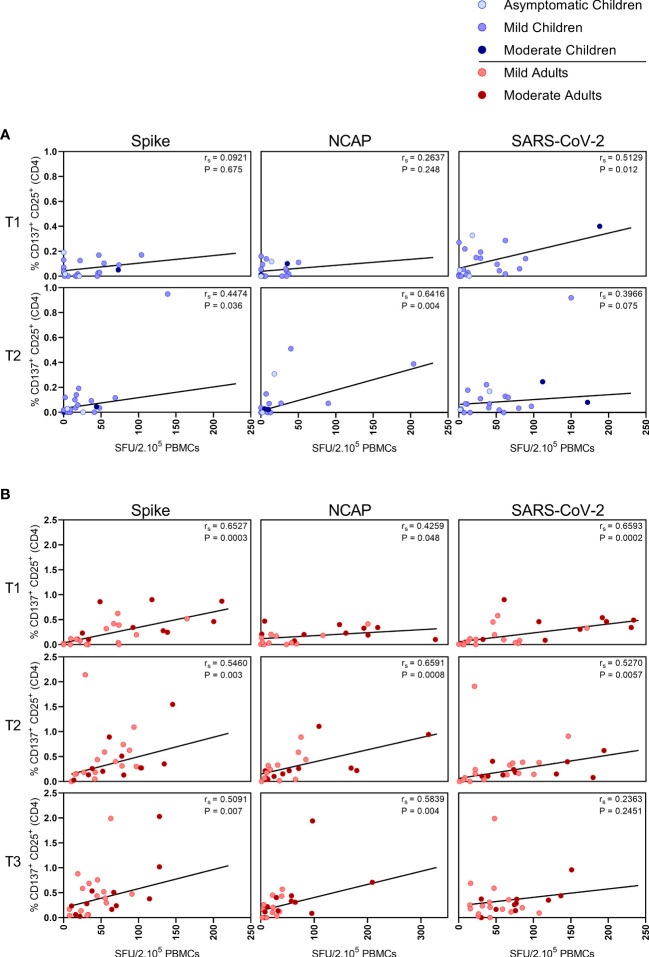
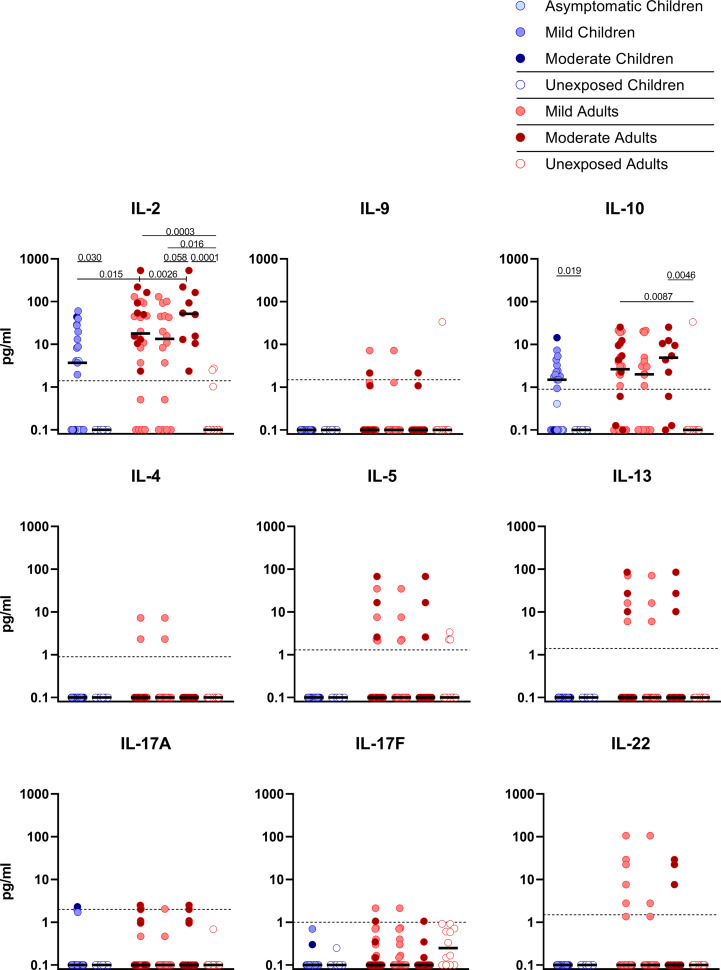
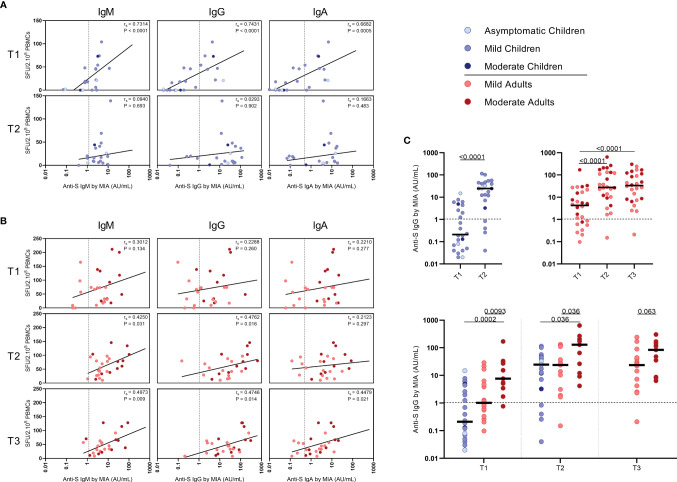
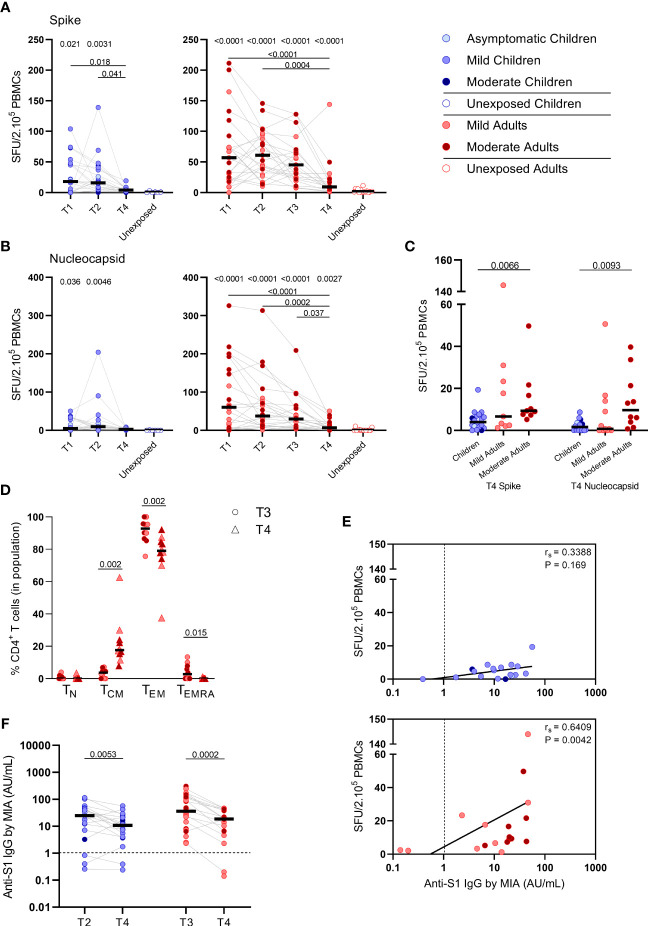
Results: Upon stimulation of PBMCs with heat-inactivated SARS-CoV-2 or overlapping peptides of spike (S-SARS-CoV-2) and nucleocapsid proteins, we found S-SARS-CoV-2-specific IFN-γ T cell responses in infected children (83%) and adults (100%) that were absent in unexposed controls. Frequencies of SARS-CoV-2-specific T cells were higher in infected adults, especially several cases with moderate symptoms, compared to infected children. The S-SARS-CoV-2 IFN-γ T cell response correlated with S1-SARS-CoV-2-specific serum antibody concentrations. Predominantly, effector memory CD4+ T cells of a Th1 phenotype were activated upon exposure to SARS-CoV-2 antigens. Frequencies of SARS-CoV-2-specific T cells were significantly reduced at 10 months after symptom onset, while S1-SARS-CoV-2-specific IgG concentrations were still detectable in 90% of all children and adults.

Conclusions: Our data indicate that an antigen-specific T cell and antibody response is developed after mild SARS-CoV-2 infection in children and adults. It remains to be elucidated to what extent this SARS-CoV-2-specific response can contribute to an effective recall response after reinfection.

Keywords: COVID-19; SARS-CoV-2; T cell immunity; adaptive immunity; antibody response; children; cytokines; mild symptoms.


Conflict of interest statement

The authors declare that the research was conducted in the absence of any commercial or financial relationships that could be construed as a potential conflict of interest.

Figures

Figure 1
Figure 1
SARS-CoV-2-specific IFN-γ+ T cell response in infected children and infected adults (mild and moderate cases) versus unexposed healthy controls over time after infection. Dot plots summarizing the frequencies of IFN-γ-producing cells responding to SARS-CoV-2 and HCoV-OC43 antigens for (A–D) children (left panel, blue), adults (middle panel, red), and children versus mild and moderate adult cases separately (right panel), over time after infection, and compared to unexposed adults/children (ELISPOT assay). Frequencies of IFN-γ-producing cells responding to (A) set of overlapping peptides of SARS-CoV-2 spike protein, (B) set of overlapping peptides of SARS-CoV-2 nucleocapsid protein, (C) inactivated SARS-CoV-2, and (D) set of overlapping peptides of HCoV-OC43 spike protein. Each dot represents one subject. Bars indicate the median of spot-forming units per 200,000 PBMCs. SFU, spot-forming unit. (A–D) P values related to comparisons with the unexposed controls are listed at the top of the graph, above the corresponding group for comparison. For unpaired comparisons, Mann-Whitney U test (two-group comparisons) (mild adults versus moderate adults) or Kruskal-Wallis rank-sum test with Dunn’s post hoc test for multiple comparisons were used (children versus mild adults versus moderate adults; unexposed versus infected children or adults at T1 versus T2 versus T3). Differences between paired data were compared using the Wilcoxon signed-rank test (for comparison of two paired groups) (infected children at T1 versus T2) or the Friedman test with Dunn’s multiple comparison tests (infected adults at T1 versus T2 versus T3). Statistically significant comparisons are indicated, with P values < 0.05 considered significant. T1, first timepoint of sampling for adults median 12.5 days and children median 8 days post-symptom onset; T2, 10-14 days after T1; T3, 4-6 weeks after T1.
Figure 2
Figure 2
Frequencies of activated CD4+ T cells of infected children and infected adults (mild and moderate cases) versus unexposed healthy controls over time after infection. Dot plots summarizing the percentages of CD25+/CD137+ activated CD4+ T cells responding to SARS-CoV-2 antigens for (A–D) children (left panel, blue), adults (middle panel, red), and children versus mild and moderate adult cases separately (right panel). Percentages of CD25+/CD137+ activated CD4+ T cells responding to (A) set of overlapping peptides of SARS-CoV-2 spike protein, (B) set of overlapping peptides of SARS-CoV-2 nucleocapsid, (C) inactivated SARS-CoV-2. (D) Immunophenotyping at the single-cell level showing the different memory subsets within the SARS-CoV-2-specific activated CD4+ T cells from infected adults. Each dot represents one subject. Bars indicate the median percentage of total CD4+ T cells. (A–C) P values related to comparisons with the unexposed controls are listed at the top of the graph, above the corresponding group for comparison. For unpaired comparisons, Mann-Whitney U test (two-group comparisons) (mild adults versus moderate adults) or Kruskal-Wallis rank-sum test with Dunn’s post hoc test for multiple comparisons were used (children versus mild adults versus moderate adults; unexposed versus infected children or adults at T1 versus T2 versus T3). Differences between paired data were compared using the Wilcoxon signed-rank test (for comparison of two paired groups) (infected children at T1 versus T2) or the Friedman test with Dunn’s multiple comparison tests (infected adults at T1 versus T2 versus T3). Statistically significant comparisons are indicated, with P values < 0.05 considered significant. T1, first timepoint of sampling for adults median 12.5 days and children median 8 days post-symptom onset; T2, 10-14 days after T1; T3, 4-6 weeks after T1.
Figure 3
Figure 3
Correlation between IFN-γ+ T cell frequency and activated CD4+ T cells. Spearman correlation between frequency of IFN-γ+ responder cells and percentages of CD25+/CD137+ activated CD4+ T cells of (A) children and (B) adults responding to a set of overlapping peptides of SARS-CoV-2 spike protein (left panel), or a set of overlapping peptides of SARS-CoV-2 nucleocapsid protein (middle panel) or inactivated SARS-CoV-2 (right panel) at different time points after infection. Each dot represents one subject. Correlation coefficients (rs) were determined with Spearman’s rank correlation. P values < 0.05 were considered significant. T1, first timepoint of sampling for adults median 12.5 days and children median 8 days post-symptom onset; T2, 10-14 days after T1; T3, 4-6 weeks after T1.
Figure 4
Figure 4
Cytokine release in infected children and mild versus moderate symptomatic adults over time after infection. Cell-free culture supernatants were harvested from IFN-γ ELISPOT plates and the release of the following cytokines was measured in T1 samples: IL-2, IL-4, IL-5, IL-9, IL-10, IL-13, IL-17A, IL-17F, IL-22. Dot plots show the concentration of cytokines (pg/ml) after stimulation of PBMCs with a set of overlapping peptides of SARS-CoV-2 spike protein. Infected children and unexposed children versus infected adults with mild or moderate disease and unexposed adults are depicted. Minimum detection threshold (MDT) concentrations for each cytokine, as calculated by the manufacturer and mentioned in the Material and Methods section, are indicated with horizontal dotted lines. Each dot represents one subject. Bars indicate the median cytokine concentration (pg/ml). For two-group comparisons (infected children versus unexposed children), Mann-Whitney U test was used. Kruskal-Wallis rank-sum test with Dunn’s post hoc test for multiple comparisons was used (all adults versus mild adults versus moderate adults versus unexposed adults; all adults versus mild adults versus moderate adults versus infected children). P-values ≤ 0.05 are presented.
Figure 5
Figure 5
Correlation between frequencies of SARS-CoV-2-specific IFN-γ+ T cells and antibody concentrations to S1-SARS-CoV-2. Spearman correlation between frequency of SARS-CoV-2-specific IFN-γ+ responder cells and concentrations of spike-S1 IgM, IgG, or IgA serum antibodies measured by multiplex immunoassay (MIA) at different time points after infection in (A) children and (B) adults. Concentrations of spike-S1 IgG serum antibodies at the various time points after SARS-CoV-2 infection in the whole group of children and adults (C, upper panel) and in the whole group of children versus the mild and moderate adult cases (C, lower panel). Cut-off values for seroprevalence are indicated with vertical or horizontal dotted lines. Each dot represents one subject. Correlation coefficients (rs) were determined with Spearman’s rank correlation. P values < 0.05 were considered significant. Differences in IgG concentrations for paired data were compared using the Wilcoxon signed-rank test (for comparison of two paired groups) (infected children at T1 versus T2) or the Friedman test with Dunn’s multiple comparison tests (infected adults at T1 versus T2 versus T3). For unpaired comparisons, Mann-Whitney U test (two-group comparisons) (mild adults versus moderate adults) or Kruskal-Wallis rank-sum test with Dunn’s post hoc test for multiple comparisons were used (children versus mild adults versus moderate adults; at T1 versus T2 versus T3). Statistically significant comparisons are indicated, with P values < 0.05 considered significant. T1, first timepoint of sampling for adults median 12.5 days and children median 8 days post-symptom onset; T2, 10-14 days after T1; T3, 4-6 weeks after T1.
Figure 6
Figure 6
SARS-CoV-2-specific immune response up to 10 months after infection. Dot plots summarizing the frequencies of IFN-γ-producing cells by ELISPOT assay responding to (A) a set of overlapping peptides of SARS-CoV-2 spike protein and (B) a set of overlapping peptides of SARS-CoV-2 nucleocapsid protein in children (left panel, blue) and adults (right panel, red), at different time points after infection, and compared to unexposed children/adults. (C) Dot plots showing the frequencies of IFN-γ-producing cells responding to SARS-CoV-2 spike and nucleocapsid proteins, at 10 months after symptom onset (T4) comparison of groups of children versus total, mild, and moderate adult cases separately. (D) Immunophenotyping at the single-cell level comparing the frequencies of different memory subsets from T3 versus T4 within the SARS-CoV-2-specific activated CD4+ T cells from infected adults. (E) Spearman correlation between frequency of IFN-γ+ responder cells and concentrations of anti-spike-S1 IgG serum antibodies measured by multiplex immunoassay (MIA) at T4 in children (upper panel, blue) and adults (lower panel, red). (F) Dot plots comparing the concentrations of anti-spike-S1 IgG serum antibodies at T2 or T3 versus T4 in children and adults. Each dot represents one subject. Bars indicate the median. SFU, spot-forming unit. (A, B) P values related to comparisons with the unexposed controls are listed at the top of the graph, above the corresponding group for comparison. For unpaired comparisons, Mann-Whitney U test (two-group comparisons) (mild adults versus moderate adults, infected children or adults at T4 versus unexposed children or adults) or Kruskal-Wallis rank-sum test with Dunn’s post hoc test for multiple comparisons were used (children versus total adults versus mild adults versus moderate adults; unexposed versus infected children or adults at T1 versus T2 versus T3). Differences between paired data were compared using the Wilcoxon signed-rank test (for comparison of two paired groups) (memory T cell subsets at T3 versus T4; concentrations of anti-spike-S1 IgG serum antibodies at T2 or T3 versus T4) or the Friedman test with Dunn’s multiple comparison tests (infected children or adults at T1 versus T2 versus T3 versus T4). Statistically significant comparisons are indicated, with P values < 0.05 considered significant. Cut-off values for seroprevalence are indicated with vertical dotted lines in (E, F). Correlation coefficients (rs) were determined with Spearman’s rank correlation. Statistically significant comparisons are indicated. P values < 0.05 were considered significant. T1, first timepoint of sampling for adults median 12.5 days and children median 8 days post-symptom onset; T2, 10-14 days after T1; T3, 4-6 weeks after T1; T4, 10 months ± 13 days after symptom onset.

References

    1. Lucas C, Wong P, Klein J, Castro TBR, Silva J, Sundaram M, et al. . Longitudinal Analyses Reveal Immunological Misfiring in Severe COVID-19. Nature (2020) 584(7821):463–9. doi: 10.1038/s41586-020-2588-y - DOI - PMC - PubMed
    1. Mathew D, Giles JR, Baxter AE, Oldridge DA, Greenplate AR, Wu JE, et al. . Deep Immune Profiling of COVID-19 Patients Reveals Distinct Immunotypes With Therapeutic Implications. Science (2020) 369(6508):eabc8511. doi: 10.1126/science.abc8511 - DOI - PMC - PubMed
    1. Giamarellos-Bourboulis EJ, Netea MG, Rovina N, Akinosoglou K, Antoniadou A, Antonakos N, et al. . Complex Immune Dysregulation in COVID-19 Patients With Severe Respiratory Failure. Cell Host Microbe (2020) 27(6):992–1000.e3. doi: 10.1016/j.chom.2020.04.009 - DOI - PMC - PubMed
    1. Kuri-Cervantes L, Pampena MB, Meng W, Rosenfeld AM, Ittner CAG, Weisman AR, et al. . Comprehensive Mapping of Immune Perturbations Associated With Severe COVID-19. Sci Immunol (2020) 5(49):1–15. doi: 10.1126/sciimmunol.abd7114 - DOI - PMC - PubMed
    1. Wu Z, McGoogan JM. Characteristics of and Important Lessons From the Coronavirus Disease 2019 (COVID-19) Outbreak in China: Summary of a Report of 72314 Cases From the Chinese Center for Disease Control and Prevention. JAMA (2020) 323(13):1239–42. doi: 10.1001/jama.2020.2648 - DOI - PubMed

Publication types

LinkOut - more resources