

Integrase Strand Transfer Inhibitor Use and Cancer Incidence in a Large Cohort Setting
- PMID: 35198646
- PMCID: PMC8860165
- DOI: 10.1093/ofid/ofac029
Integrase Strand Transfer Inhibitor Use and Cancer Incidence in a Large Cohort Setting
Abstract
Background: Limited data exist examining the association between incident cancer and cumulative integrase inhibitor (INSTI) exposure.
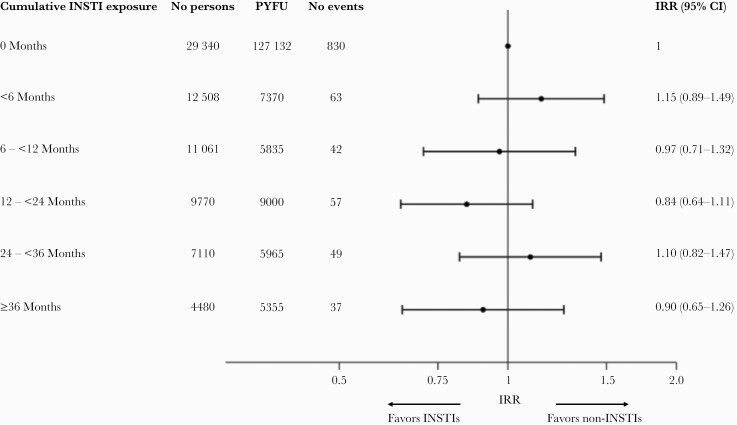
Methods: Participants were followed from baseline (latest of local cohort enrollment or January 1, 2012) until the earliest of first cancer, final follow-up, or December 31, 2019. Negative binomial regression was used to assess associations between cancer incidence and time-updated cumulative INSTI exposure, lagged by 6 months.
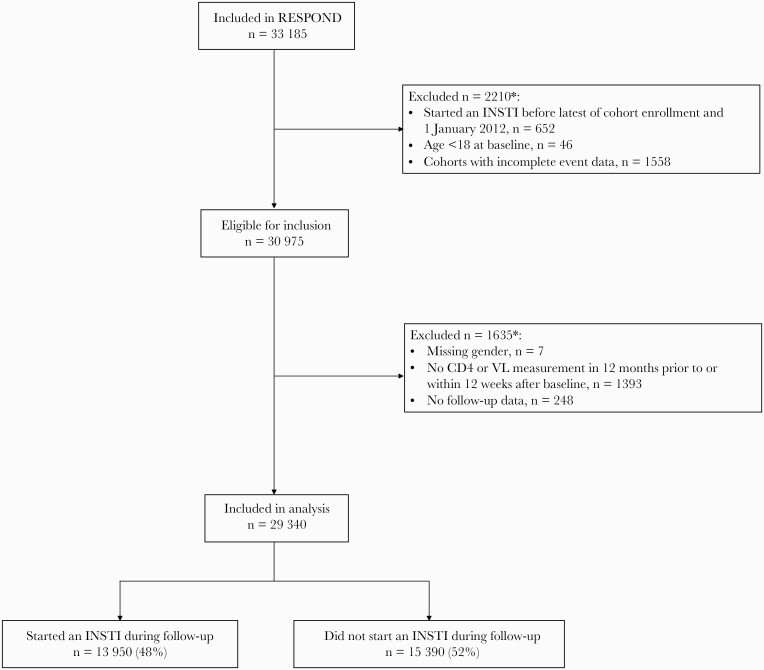
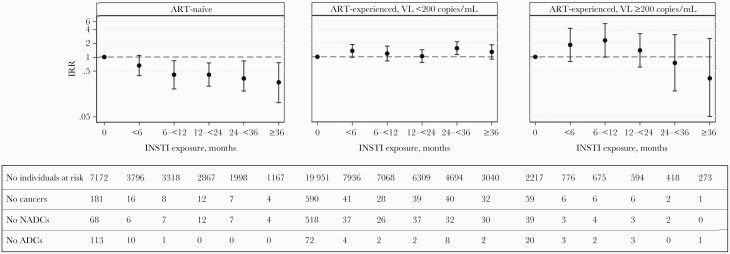
Results: Of 29 340 individuals, 74% were male, 24% were antiretroviral treatment (ART)-naive, and median baseline age was 44 years (interquartile range [IQR], 36-51). Overall, 13 950 (48%) individuals started an INSTI during follow-up. During 160 657 person-years of follow-up ([PYFU] median 6.2; IQR, 3.9-7.5), there were 1078 cancers (incidence rate [IR] 6.7/1000 PYFU; 95% confidence interval [CI], 6.3-7.1). The commonest cancers were non-Hodgkin lymphoma (n = 113), lung cancer (112), Kaposi's sarcoma (106), and anal cancer (103). After adjusting for potential confounders, there was no association between cancer risk and INSTI exposure (≤6 months vs no exposure IR ratio: 1.15 [95% CI, 0.89-1.49], >6-12 months; 0.97 [95% CI, 0.71-1.32], >12-24 months; 0.84 [95% CI, 0.64-1.11], >24-36 months; 1.10 [95% CI, 0.82-1.47], >36 months; 0.90 [95% CI, 0.65-1.26] [P = .60]). In ART-naive participants, cancer incidence decreased with increasing INSTI exposure, mainly driven by a decreasing incidence of acquired immune deficiency syndrome cancers; however, there was no association between INSTI exposure and cancer for those ART-experienced (interaction P < .0001).
Conclusions: Cancer incidence in each INSTI exposure group was similar, despite relatively wide CIs, providing reassuring early findings that increasing INSTI exposure is unlikely to be associated with an increased cancer risk, although longer follow-up is needed to confirm this finding.
Keywords: HIV; antiretroviral treatment; cancer; cohort; integrase inhibitors.
© The Author(s) 2022. Published by Oxford University Press on behalf of Infectious Diseases Society of America.
Figures
References
-
- Wada N, Jacobson LP, Cohen M, et al. . Cause-specific life expectancies after 35 years of age for human immunodeficiency syndrome-infected and human immunodeficiency syndrome-negative individuals followed simultaneously in long-term cohort studies, 1984 – 2008. Am J Epidemiol 2013; 177:116–25. - PMC - PubMed
