. 2022 Jan 25;25(2):103814.
doi: 10.1016/j.isci.2022.103814. eCollection 2022 Feb 18.

p53-mediated neurodegeneration in the absence of the nuclear protein Akirin2

Affiliations

p53-mediated neurodegeneration in the absence of the nuclear protein Akirin2

Stacey L Peek et al. iScience. .

Abstract

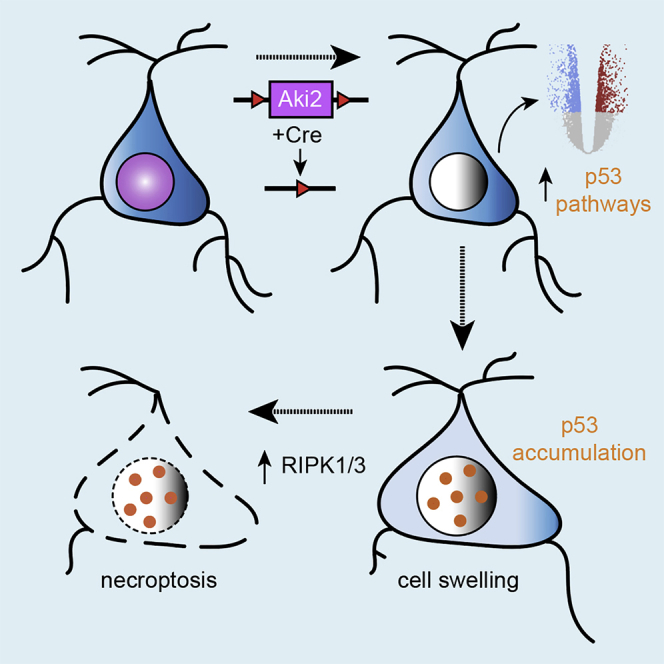
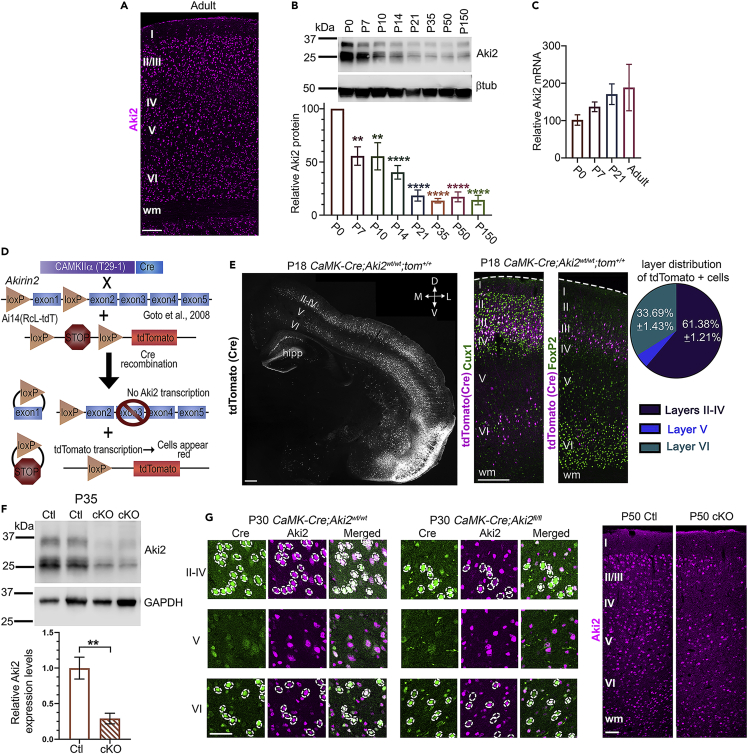
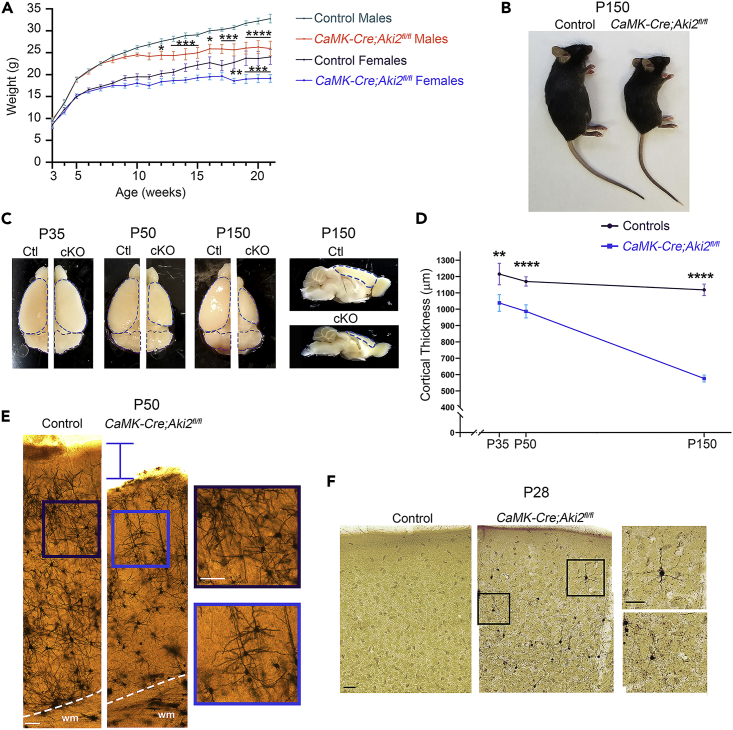
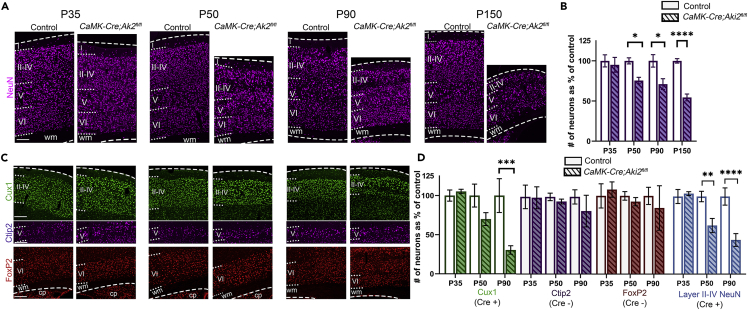
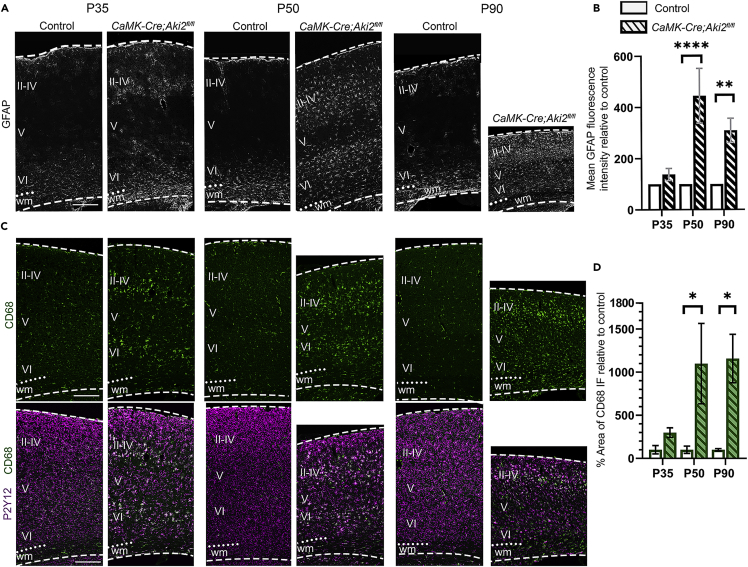
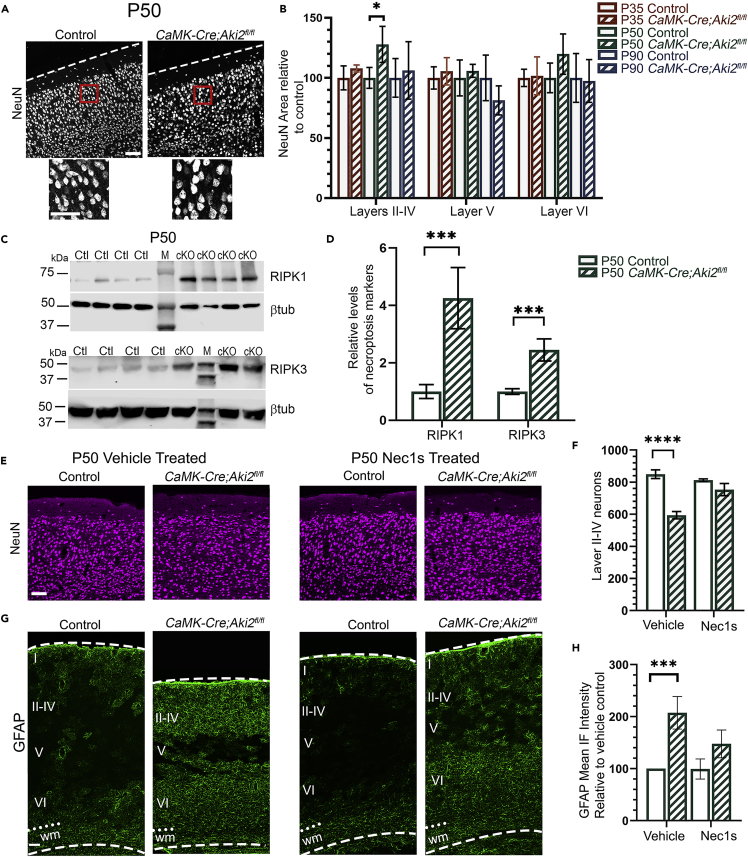
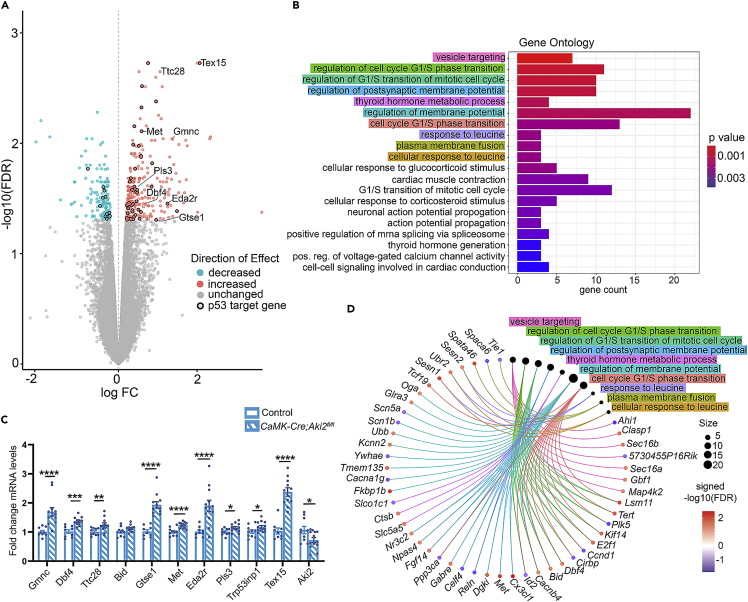
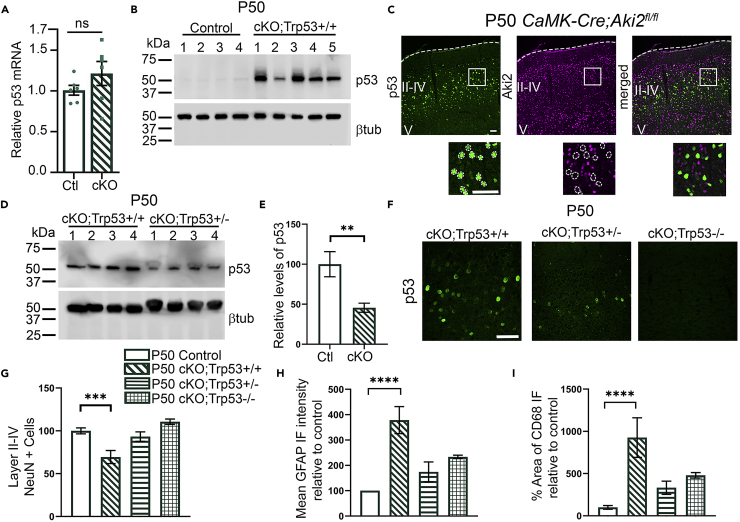
Proper gene regulation is critical for both neuronal development and maintenance as the brain matures. We previously demonstrated that Akirin2, an essential nuclear protein that interacts with transcription factors and chromatin remodeling complexes, is required for the embryonic formation of the cerebral cortex. Here we show that Akirin2 plays a mechanistically distinct role in maintaining healthy neurons during cortical maturation. Restricting Akirin2 loss to excitatory cortical neurons resulted in progressive neurodegeneration via necroptosis and severe cortical atrophy with age. Comparing transcriptomes from Akirin2-null postnatal neurons and cortical progenitors revealed that targets of the tumor suppressor p53, a regulator of both proliferation and cell death encoded by Trp53, were consistently upregulated. Reduction of Trp53 rescued neurodegeneration in Akirin2-null neurons. These data: (1) implicate Akirin2 as a critical neuronal maintenance protein, (2) identify p53 pathways as mediators of Akirin2 functions, and (3) suggest Akirin2 dysfunction may be relevant to neurodegenerative diseases.

Keywords: biological sciences; cell biology; molecular biology; neuroscience.


Conflict of interest statement

The authors declare no competing interests

Figures

None
Graphical abstract
Figure 1
Figure 1
Generation of an Akirin2 cortical-restricted knockout mouse model (A) IF demonstrates widespread Aki2 protein expression across all cortical layers (I–VI) in the adult. (B) Cortical lysates western blotted with anti-Aki2 antibody show multiple-specific bands around the expected molecular weight of 22 kDa, as well as two larger bands. Protein expression peaks ∼ P0 and slowly declines to a stable level of ∼20% relative to P0 (3 samples/age, normalized to β−tubulin signal within the same lane). (C) Consistent Aki2 transcript levels across cortical maturation suggest that Aki2 protein is posttranscriptionally regulated (qPCR of 3 samples/age, with GAPDH as a reference gene and plotted as percent of P0 level). One-way ANOVA with Dunnet’s multiple comparisons test comparing every age to P0. (D) Schematic of alleles and breeding strategy. (E) Shortly after Cre expression onset, tdTomato labels many cells in cortical layers II–IV (Cux1-demarcated) and VI (FoxP2-demarcated), as well as hippocampal (hipp) dentate gyrus and CA1. Around 2/3 of Cre-positive cells reside in layers II–IV and ∼1/3 are FoxP2-negative layer VI neurons; few reside in layer V. (F) Immunoblots of control and mutant (cKO) cortical lysates with anti-Aki2 indicate a significant reduction of protein levels (and confirm the specificity of all band sizes observed) at P35, with some expression remaining from Cre (−) cells. Values from 5 to 6 samples/genotype normalized to GAPDH signal and compared using an unpaired t-test. (G) At P30 Anti-Cre and anti-Aki2 antibody staining on cortical sections confirm Aki2 loss in most Cre-expressing mutant cells but not control neurons. By P50, loss of Aki2 IF is apparent in layers with significant Cre expression (II–IV, VI). D, dorsal; V, ventral; M, medial; L, lateral; wm, white matter; Scale bar: 300 μm in A, 500 μm in E, 100 μm in (G) Data are shown as mean ± SEM, ∗∗p< 0.01, ∗∗∗∗p< 0.0001. See also Figure S1.
Figure 2
Figure 2
Progressive cortical atrophy in the absence of neuronal Akirin2 (A) Comparison of control mouse (n = 6–17/age) and gender-matched mutant weights (n = 4–13/age) indicates that mutants stop gaining weight at ∼8 weeks. (B) By 21 weeks CaMK-Cre;Aki2fl/fl (cKO) mutants are clearly smaller and exhibit kyphosis. (C) Control (Ctl) and cKO brains were collected at the indicated time points. There is clear progressive atrophy of cKO cortex (outlined in blue) but not Cre-negative cerebellum (outlined in purple). (D) Cortical thickness measurements on coronal cryosections (4 mice/genotype) indicate significant cortical atrophy in the mutant by P35. See Figures 3A and 2E for representative images. (E) Golgi and (F) NeuroSilver staining reveal a thinner cortex (E; P50) with degenerating neurons (F; P28). Insets, magnified areas of main image. Scale bar: 100 μm. Data are shown as mean ± SEM, ∗p< 0.05, ∗∗p< 0.01, ∗∗∗p< 0.001, ∗∗∗∗p< 0.0001, multiple t-tests with Holm–Sidak method corrections.
Figure 3
Figure 3
Neuronal loss in the absence of Akirin2 (A and B) Quantification of neurons labeled by NeuN or (C,D) the number belonging to each immunostained population (n = 3–4 mice/genotype/age) show significant neuronal loss begins at P50 and progress with age (B). Cre-positive (mutant) neuronal populations are lost first (D, Cux1, Layer II–IV), while Cre-negative populations (D, Ctip2, FoxP2) remain normal. ∗∗p< 0.01, ∗∗∗p< 0.001, ∗∗∗∗p< 0.0001 by two-way ANOVA with Sidak’s multiple comparison tests comparing control to age-matched cKO. Data are shown as mean ± SEM. cp, caudoputamen; wm, white matter; dashed lines delineate cortical edges. Scale bar: 200 μm. See also Figure S2.
Figure 4
Figure 4
Glial activation accompanies cortical neuron loss in Akirin2 mutants. Quantification of cryosections immunostained for GFAP (A) or CD68 (C) show remarkable increases in astrocyte (B) and microglia (D) activation at the ages indicated. Initial signal was most prevalent in the layers containing significant numbers of Aki2-null neurons (II–IV and VI). Colocalization of CD68 with the microglial marker P2Y12 confirms the activation of microglia (C). ∗∗∗∗p< 0.0001 by two-way ANOVA with Sidak’s multiple comparisons test comparing control to age-matched mutants. Data are shown as mean ± SEM n = , 3–4 mice/genotype/age. wm, white matter; dashed lines delineate cortical edges. Scale bar: 300 μm.
Figure 5
Figure 5
Cortical neurons undergo necroptosis in the absence of Akirin2 (A) NeuN IF indicates mutant neurons appear larger than control neurons at P50. (B) Neuronal size was estimated using NeuN area (nucleus + somatic cytoplasm) on 10 neurons//layer (II–IV, V, VI)/cryosection and average size per mouse plotted as % control (n = 4 mice/genotype/age) at each age indicated. Two-way ANOVA with Sidak’s multiple comparisons tests comparing control to age-matched mutant. (C) Cortical lysates (n = 8–10) were immunoprobed for necroptosis-regulating kinases RIPK1 and RIPK3 at P50; M = molecular weight marker. (D) Levels of the indicated protein were normalized to β-tubulin within the same lane, graphed as % of control, and significance determined using the Holm–Sidak method for 2 unpaired t-tests. (E–H) Mice were injected daily for 30 days with vehicle (DMSO) or necroptosis inhibitor, Nec-1s, from ages P21–P50. The ability of Nec1s to rescue neuronal death was assessed via quantification of layer II–IV neurons (E,F) at P50. Glial activation was assessed by measuring GFAP fluorescence intensity (G,H) at P50. Statistical significance was determined using two-way ANOVA with Sidak’s multiple comparison test comparing control and cKO of the same treatment. Daily Nec-1s treatment significantly rescued neuronal number and degree of glial activation in the Aki2 mutant cortex. n = 4–5 mice/genotype/treatment. Data are shown as mean ± SEM ∗p< 0.05; ∗∗p< 0.01; ∗∗∗p< 0.001; ∗∗∗∗p< 0.0001. Scale bar: 150 μm. See also Figure S3.
Figure 6
Figure 6
Akirin2 loss disrupts gene expression patterns in the postnatal cortex (A) A volcano plot shows differentially expressed genes (DEGs) in the CaMK-Cre;Aki2fl/fl cortex (n = 3) compared to the control cortex (n = 4) at P35 with an FDR cutoff of 0.05. Genes in the p53 pathway are highlighted with black circles. (B) Gene ontology (GO) analysis bar plot showing biological processes associated with DEGs identified in (A). (C) qPCR confirmation of upregulated cell-cycle and p53 target genes in P35 Aki2 mutant biological and technical replicates (n = 10–13 mice) compared to P35 controls (n = 8–10 mice). Note the confirmation of significant (but not complete) Aki2 downregulation as expected. Data are shown as +/- SEM ∗∗p<0.01, ∗∗∗p<0.001, ∗∗∗∗p<0.001. (D) Gene-concept network showing the relationship between the GO terms highlighted in B and the individual genes comprising each group. FC, fold change; FDR, false discovery rate. See also Figure S4 and Tables S3–S7
Figure 7
Figure 7
Neurodegeneration in Akirin2 mutant cortex is mediated by p53 (A) qPCR identifies no significant upregulation of p53 transcript in the Aki2 mutant cortex compared to control (n = 6 mice/genotype). Significance determined using unpaired t-test (B and C) In contrast, western blots (B) and IF of cortical cryosections (C) using an anti-p53 antibody reveal a massive increase in protein levels restricted to Aki2-null neurons (dashed circles, layers II–IV) in P50 mutants. (D–F) Western blots (D) quantified in E, and IF of cortical cryosections (F) confirm decreased p53 protein levels in cKO; p53+/− mice (n = 4–5 mice) and loss of p53 protein in cKO;p53-/- cortices. Significance determined using unpaired t-test. (G–I) p53 heterozygosity and KO rescue signs of neurodegeneration in P50 Aki2 mutant cortex. Data for control and cKO; Trp53+/+ were replotted from Figure 3 with the addition of 5–6 newly analyzed littermates of cKO; Trp53+/− (n = 4) and cKO; Trp53−/− (n = 3) mice. Reduction in p53 levels completely rescues neuronal numbers in layers II–IV (G) and aberrant glial activation (H,I) at P50. Data are shown as mean ± SEM ∗∗∗∗p< 0.0001. Statistical significance was determined using one-way ANOVA with Dunnet’s multiple comparison test comparing all genotypes to control. Scale bar: 100 μm.

References

    1. Ak P., Levine A.J. p53 and NF-κB: different strategies for responding to stress lead to a functional antagonism. FASEB. J. 2010;24:3643–3652. doi: 10.1096/fj.10-160549. - DOI - PubMed
    1. Aloyz R.S., Bamji S.X., Pozniak C.D., Toma J.G., Atwal J., Kaplan D.R., Miller F.D. P53 is essential for developmental neuron death as regulated by the TrkA and p75 Neurotrophin receptors. J. Cell Biol. 1998;143:1691–1703. doi: 10.1083/jcb.143.6.1691. - DOI - PMC - PubMed
    1. Arber S., Ladle D.R., Lin J.H., Frank E., Jessell T.M. ETS gene Er81 controls the formation of functional connections between group ia sensory afferents and motor neurons. Cell. 2000;101:485–498. doi: 10.1016/S0092-8674(00)80859-4. - DOI - PubMed
    1. Armesilla-Diaz A., Bragado P., del Valle I., Cuevas E., Lazaro I., Martin C., Cigudosa J.C., Silva A. p53 regulates the self-renewal and differentiation of neural precursors. Neuroscience. 2009;158:1378–1389. doi: 10.1016/j.neuroscience.2008.10.052. - DOI - PubMed
    1. Bae B.I., Xu H., Igarashi S., Fujimuro M., Agrawal N., Taya Y., Hayward S.D., Moran T.H., Montell C., Ross C.A., et al. p53 mediates cellular dysfunction and behavioral abnormalities in Huntington's disease. Neuron. 2005;47:29–41. doi: 10.1016/j.neuron.2005.06.005. - DOI - PubMed