

Stability of polygenic scores across discovery genome-wide association studies
- PMID: 35199043
- PMCID: PMC8841810
- DOI: 10.1016/j.xhgg.2022.100091
Stability of polygenic scores across discovery genome-wide association studies
Abstract
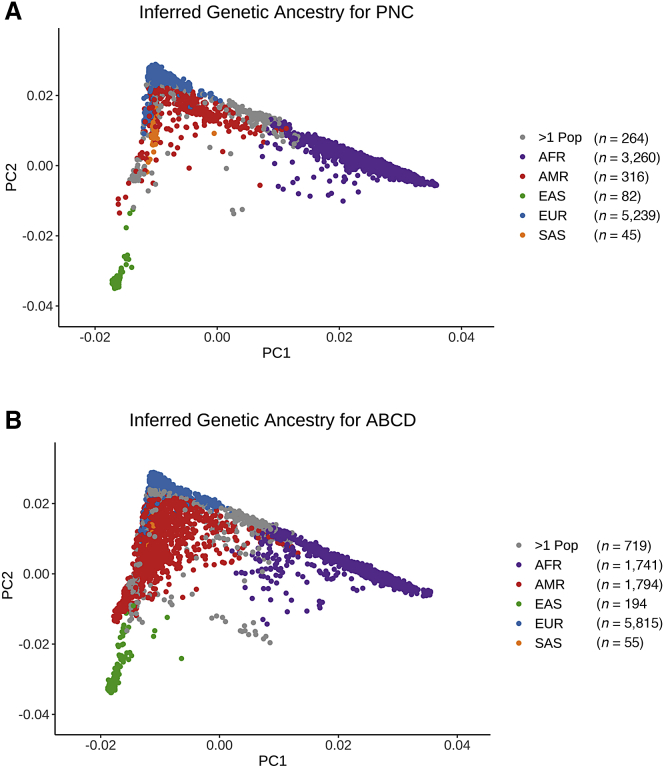
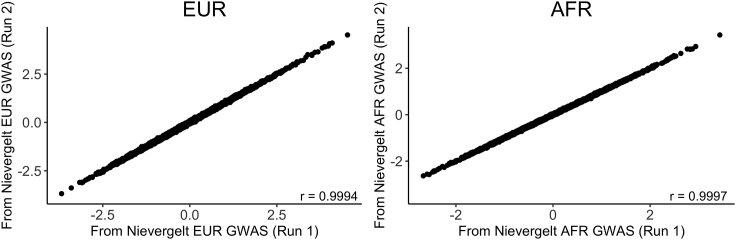
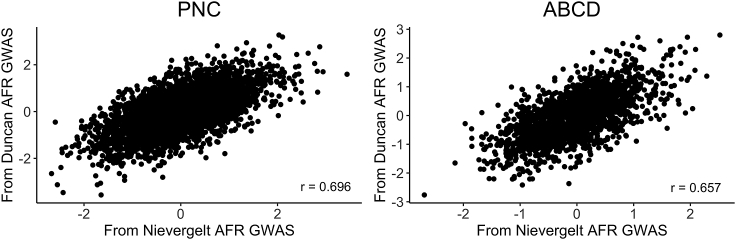
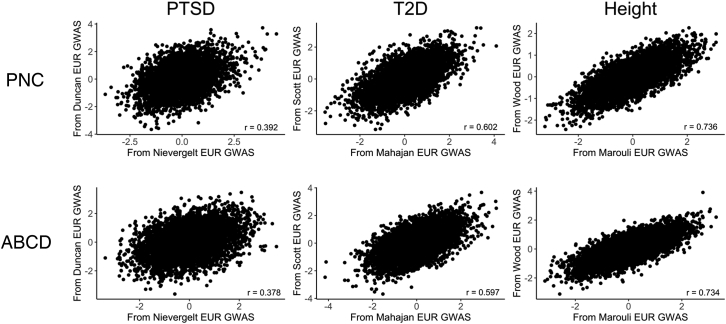
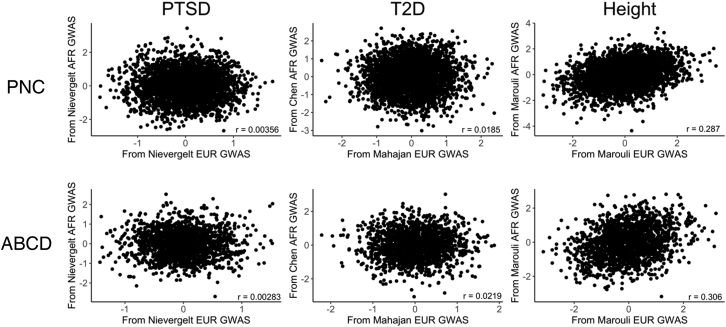
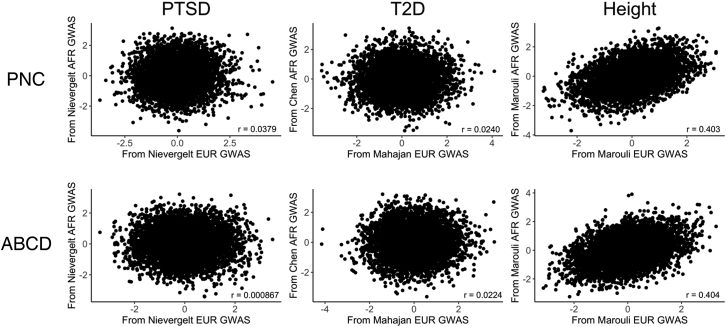
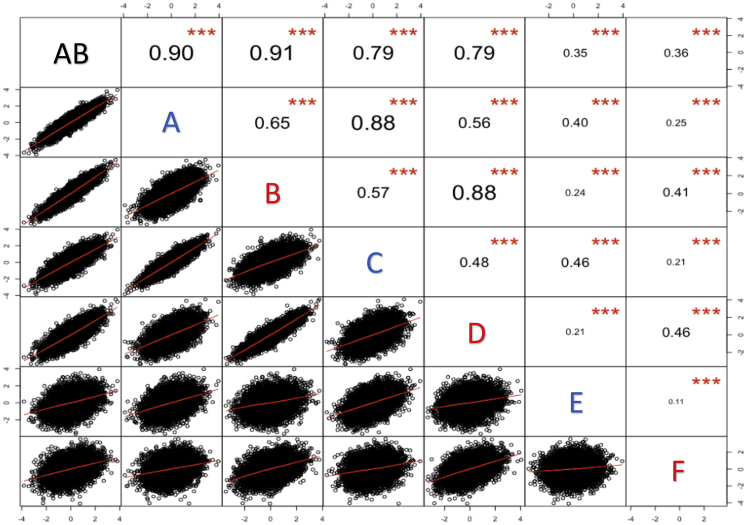
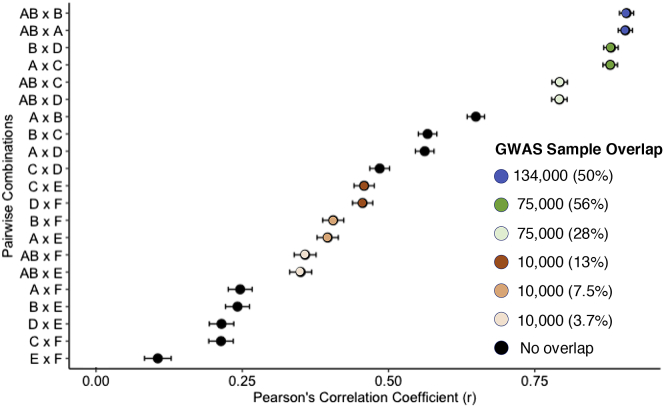
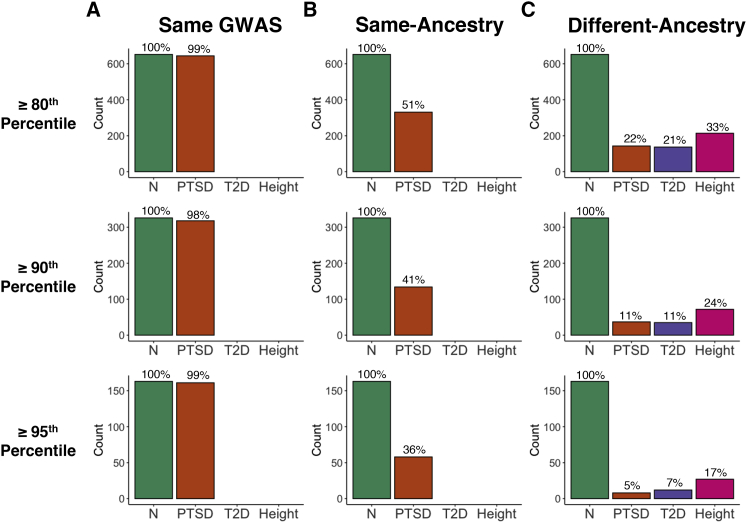
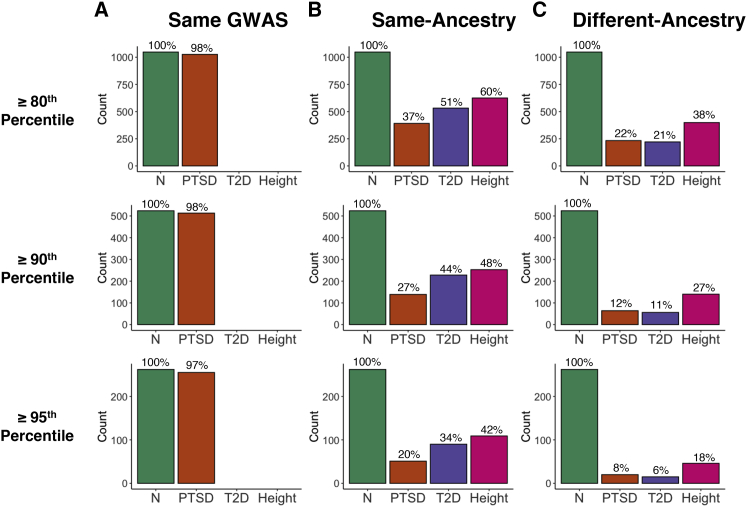
Polygenic scores (PGS) are commonly evaluated in terms of their predictive accuracy at the population level by the proportion of phenotypic variance they explain. To be useful for precision medicine applications, they also need to be evaluated at the individual level when phenotypes are not necessarily already known. We investigated the stability of PGS in European American (EUR) and African American (AFR)-ancestry individuals from the Philadelphia Neurodevelopmental Cohort and the Adolescent Brain Cognitive Development study using different discovery genome-wide association study (GWAS) results for post-traumatic stress disorder (PTSD), type 2 diabetes (T2D), and height. We found that pairs of EUR-ancestry GWAS for the same trait had genetic correlations >0.92. However, PGS calculated from pairs of same-ancestry and different-ancestry GWAS had correlations that ranged from <0.01 to 0.74. PGS stability was greater for height than for PTSD or T2D. A series of height GWAS in the UK Biobank suggested that correlation between PGS is strongly dependent on the extent of sample overlap between the discovery GWAS. Focusing on the upper end of the PGS distribution, different discovery GWAS do not consistently identify the same individuals in the upper quantiles, with the best case being 60% of individuals above the 80th percentile of PGS overlapping from one height GWAS to another. The degree of overlap decreases sharply as higher quantiles, less heritable traits, and different-ancestry GWAS are considered. PGS computed from different discovery GWAS have only modest correlation at the individual level, underscoring the need to proceed cautiously with integrating PGS into precision medicine applications.
Keywords: Adolescent Brain Cognitive Development study; African American; PRS-CS; PTSD; Philadelphia Neurodevelopmental Cohort; UK Biobank; ancestry; height; methods development; type 2 diabetes.
© 2022 The Authors.
Conflict of interest statement
R.B. reports serving on the scientific board and owning stock in Taliaz Health, with no conflict of interest relevant to this work. The other authors declare no competing interests.
Figures
Similar articles
-
Polygenic risk scores for cardiometabolic traits demonstrate importance of ancestry for predictive precision medicine.Pac Symp Biocomput. 2024;29:611-626. Pac Symp Biocomput. 2024. PMID: 38160310 Free PMC article.
-
Polygenic risk scores for cardiometabolic traits demonstrate importance of ancestry for predictive precision medicine.Pac Symp Biocomput. 2025;30:748-765. doi: 10.1142/9789819807024_0056. Pac Symp Biocomput. 2025. PMID: 39670412
-
Genetic Association and Transferability for Urinary Albumin-Creatinine Ratio as a Marker of Kidney Disease in four Sub-Saharan African Populations and non-continental Individuals of African Ancestry.medRxiv [Preprint]. 2024 Apr 12:2024.01.17.24301398. doi: 10.1101/2024.01.17.24301398. medRxiv. 2024. Update in: Front Genet. 2024 May 15;15:1372042. doi: 10.3389/fgene.2024.1372042. PMID: 38293229 Free PMC article. Updated. Preprint.
-
Polygenic Scores for ADHD: A Meta-Analysis.Res Child Adolesc Psychopathol. 2021 Mar;49(3):297-310. doi: 10.1007/s10802-021-00774-4. Epub 2021 Jan 25. Res Child Adolesc Psychopathol. 2021. PMID: 33492530 Review.
-
Perspectives on genetic studies of type 2 diabetes from the genome-wide association studies era to precision medicine.J Diabetes Investig. 2024 Apr;15(4):410-422. doi: 10.1111/jdi.14149. Epub 2024 Jan 23. J Diabetes Investig. 2024. PMID: 38259175 Free PMC article. Review.
Cited by
-
Genetic predisposition for negative affect predicts mental health burden during the COVID-19 pandemic.Eur Arch Psychiatry Clin Neurosci. 2025 Feb;275(1):61-73. doi: 10.1007/s00406-024-01795-y. Epub 2024 Apr 8. Eur Arch Psychiatry Clin Neurosci. 2025. PMID: 38587666 Free PMC article.
-
Considerations for the application of polygenic scores to clinical care of individuals with substance use disorders.J Clin Invest. 2024 Oct 15;134(20):e172882. doi: 10.1172/JCI172882. J Clin Invest. 2024. PMID: 39403926 Free PMC article. Review.
-
Impact of Copy Number Variants and Polygenic Risk Scores on Psychopathology in the UK Biobank.Biol Psychiatry. 2023 Oct 1;94(7):591-600. doi: 10.1016/j.biopsych.2023.01.028. Epub 2023 Feb 9. Biol Psychiatry. 2023. PMID: 36764568 Free PMC article.
-
Gene-based polygenic risk scores analysis of alcohol use disorder in African Americans.Transl Psychiatry. 2022 Jul 5;12(1):266. doi: 10.1038/s41398-022-02029-2. Transl Psychiatry. 2022. PMID: 35790736 Free PMC article.
-
Impact of individual level uncertainty of lung cancer polygenic risk score (PRS) on risk stratification.Genome Med. 2024 Feb 5;16(1):22. doi: 10.1186/s13073-024-01298-4. Genome Med. 2024. PMID: 38317189 Free PMC article.
References
Grants and funding
- U24 DA041147/DA/NIDA NIH HHS/United States
- U01 DA051039/DA/NIDA NIH HHS/United States
- U01 DA041120/DA/NIDA NIH HHS/United States
- U01 DA051018/DA/NIDA NIH HHS/United States
- K23 MH120437/MH/NIMH NIH HHS/United States
- U24 DA041123/DA/NIDA NIH HHS/United States
- U01 DA051038/DA/NIDA NIH HHS/United States
- RC2 MH089924/MH/NIMH NIH HHS/United States
- U01 DA051037/DA/NIDA NIH HHS/United States
- U01 DA051016/DA/NIDA NIH HHS/United States
- U01 DA041117/DA/NIDA NIH HHS/United States
- RC2 MH089983/MH/NIMH NIH HHS/United States
- U01 DA041174/DA/NIDA NIH HHS/United States
- P50 HD105351/HD/NICHD NIH HHS/United States
- U01 DA041093/DA/NIDA NIH HHS/United States
- U01 DA041134/DA/NIDA NIH HHS/United States
- U01 DA041022/DA/NIDA NIH HHS/United States
- U01 DA041156/DA/NIDA NIH HHS/United States
- U01 DA050987/DA/NIDA NIH HHS/United States
- U01 DA041025/DA/NIDA NIH HHS/United States
- U01 DA050989/DA/NIDA NIH HHS/United States
- U01 MH119690/MH/NIMH NIH HHS/United States
- U01 DA041089/DA/NIDA NIH HHS/United States
- U01 DA050988/DA/NIDA NIH HHS/United States
- U01 MH119739/MH/NIMH NIH HHS/United States
- U01 DA041106/DA/NIDA NIH HHS/United States
- U01 DA041028/DA/NIDA NIH HHS/United States
- U01 DA041048/DA/NIDA NIH HHS/United States
- U01 DA041148/DA/NIDA NIH HHS/United States
- R01 MH119219/MH/NIMH NIH HHS/United States
LinkOut - more resources
Full Text Sources
