

Sample size estimation using a latent variable model for mixed outcome co-primary, multiple primary and composite endpoints
- PMID: 35199380
- PMCID: PMC7612654
- DOI: 10.1002/sim.9356
Sample size estimation using a latent variable model for mixed outcome co-primary, multiple primary and composite endpoints
Abstract
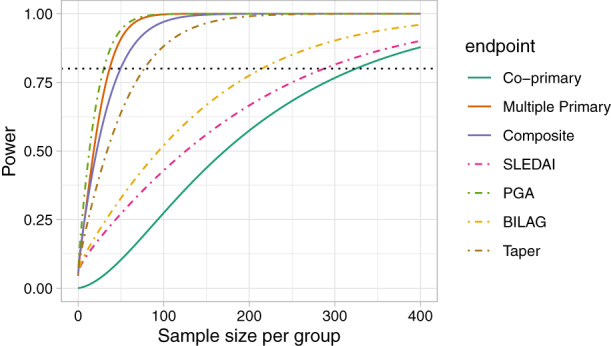
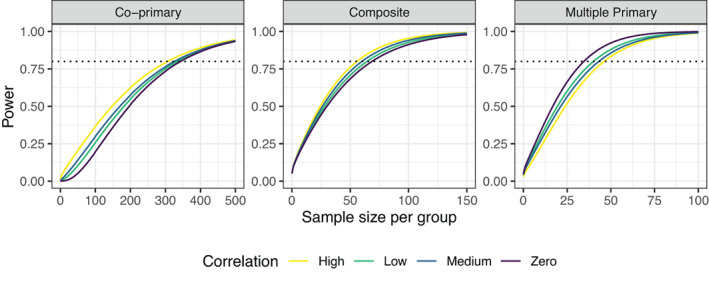
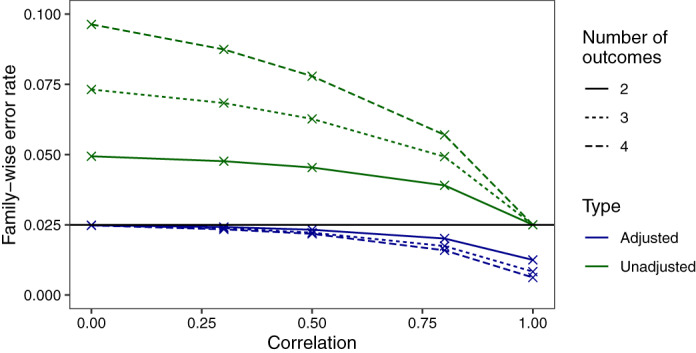
Mixed outcome endpoints that combine multiple continuous and discrete components are often employed as primary outcome measures in clinical trials. These may be in the form of co-primary endpoints, which conclude effectiveness overall if an effect occurs in all of the components, or multiple primary endpoints, which require an effect in at least one of the components. Alternatively, they may be combined to form composite endpoints, which reduce the outcomes to a one-dimensional endpoint. There are many advantages to joint modeling the individual outcomes, however in order to do this in practice we require techniques for sample size estimation. In this article we show how the latent variable model can be used to estimate the joint endpoints and propose hypotheses, power calculations and sample size estimation methods for each. We illustrate the techniques using a numerical example based on a four-dimensional endpoint and find that the sample size required for the co-primary endpoint is larger than that required for the individual endpoint with the smallest effect size. Conversely, the sample size required in the multiple primary case is similar to that needed for the outcome with the largest effect size. We show that the empirical power is achieved for each endpoint and that the FWER can be sufficiently controlled using a Bonferroni correction if the correlations between endpoints are less than 0.5. Otherwise, less conservative adjustments may be needed. We further illustrate empirically the efficiency gains that may be achieved in the composite endpoint setting.
Keywords: latent variable modeling; mixed outcome endpoints; sample size estimation.
© 2022 The Authors. Statistics in Medicine published by John Wiley & Sons Ltd.
Figures
References
-
- Moher D, Dulberg C, Wells G. Statistical power, sample size, and their reporting in randomized controlled trials. JAMA. 1994;272:122‐124. - PubMed
-
- Wittes J. Sample size calculations for randomized controlled trials. Epidemiol Rev. 2002;24:39‐53. - PubMed
-
- Pocock SJ, Ariti CA, Collier TJ, Wang D. The win ratio: a new approach to the analysis of composite endpoints in clinical trials based on clinical priorities. Eur Heart J. 2012;33(2):176‐182. - PubMed
Publication types
MeSH terms
Grants and funding
LinkOut - more resources
Full Text Sources