. 2022 Apr 15;132(8):e149258.
doi: 10.1172/JCI149258.

Tumor Treating Fields dually activate STING and AIM2 inflammasomes to induce adjuvant immunity in glioblastoma

Affiliations

Tumor Treating Fields dually activate STING and AIM2 inflammasomes to induce adjuvant immunity in glioblastoma

Dongjiang Chen et al. J Clin Invest. .

Abstract

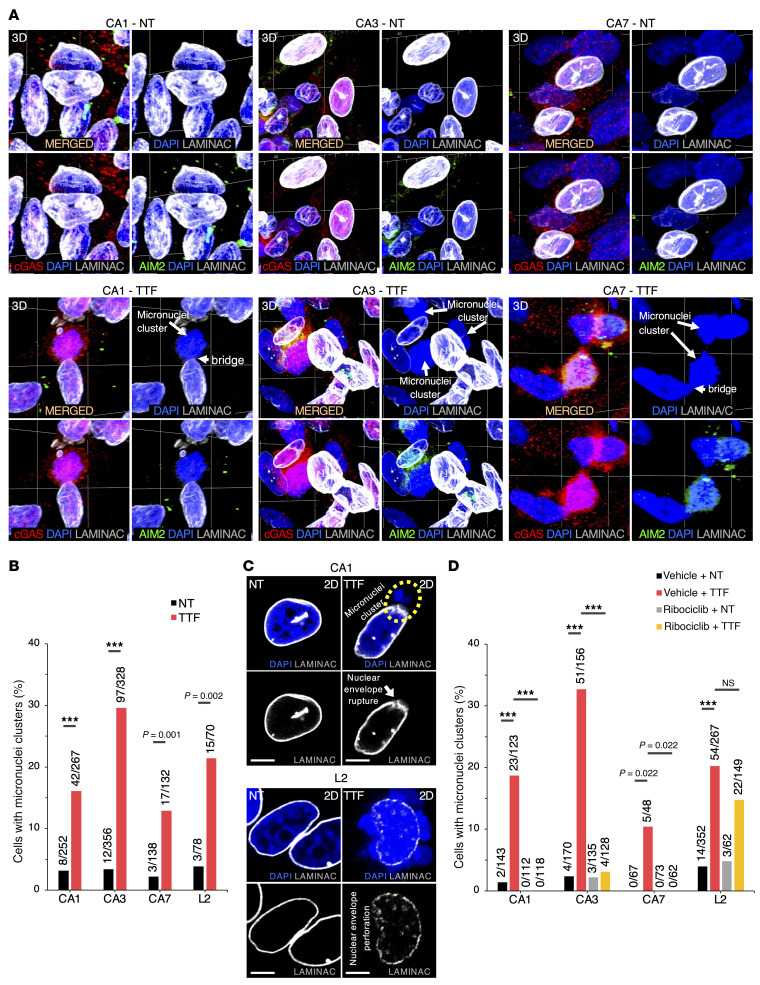
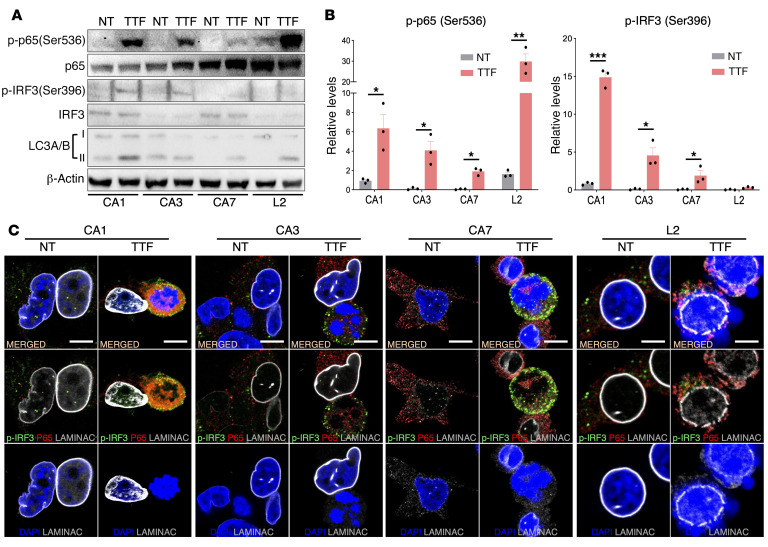
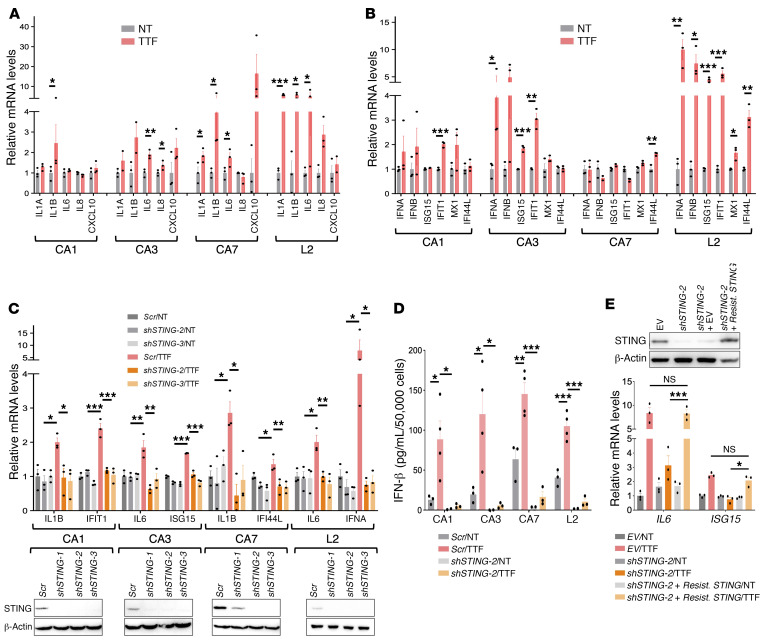
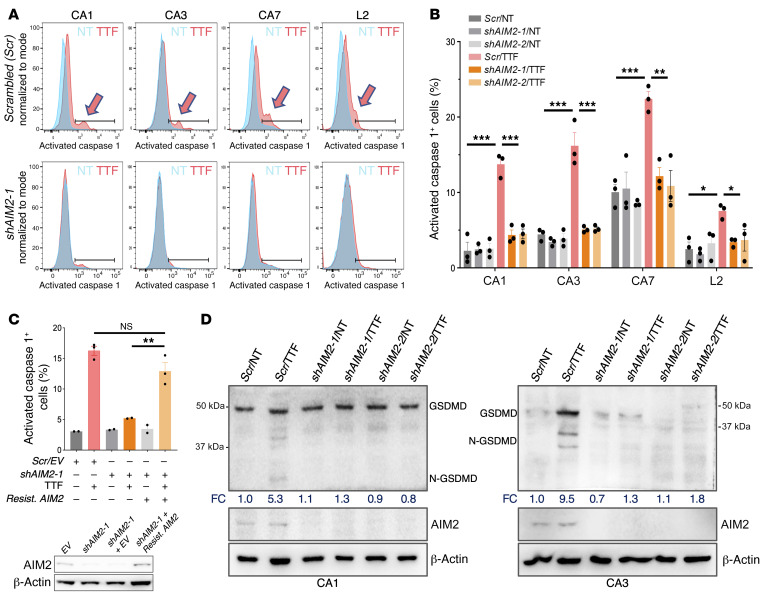
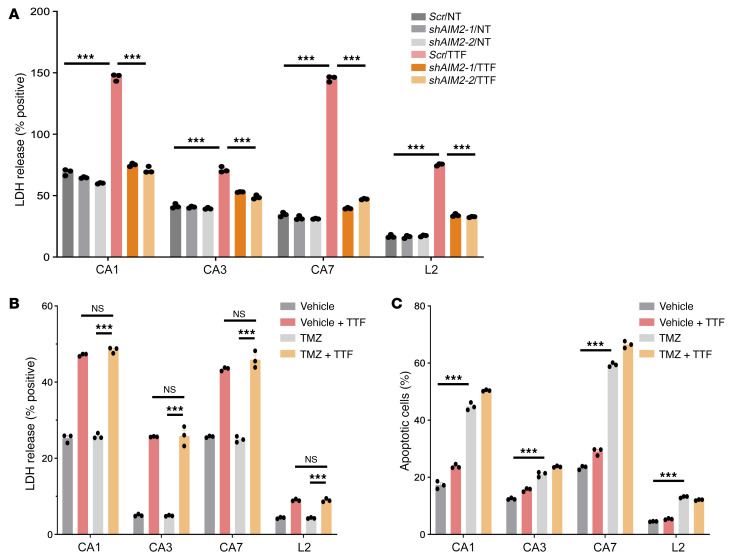
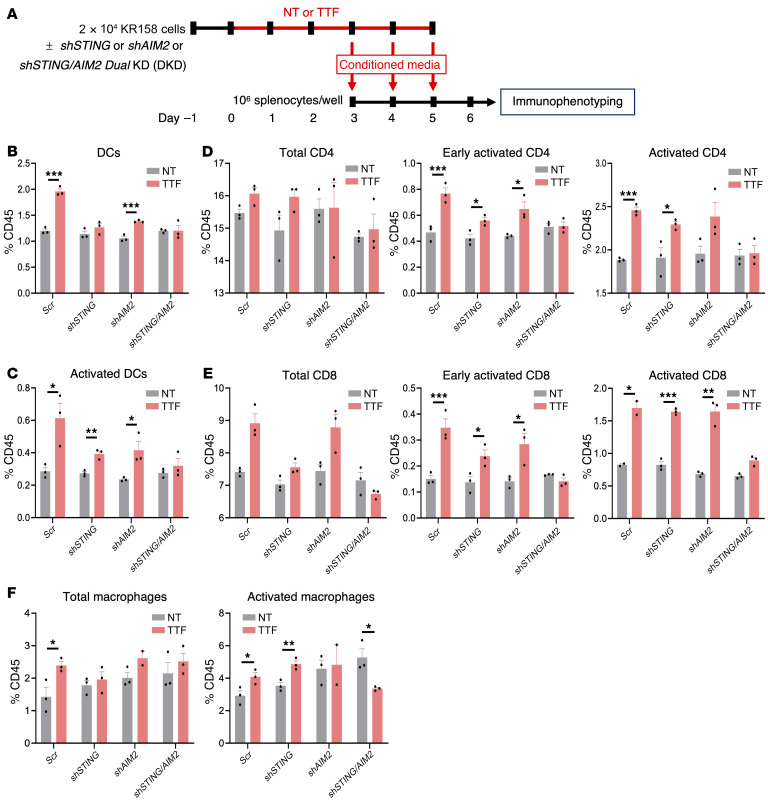
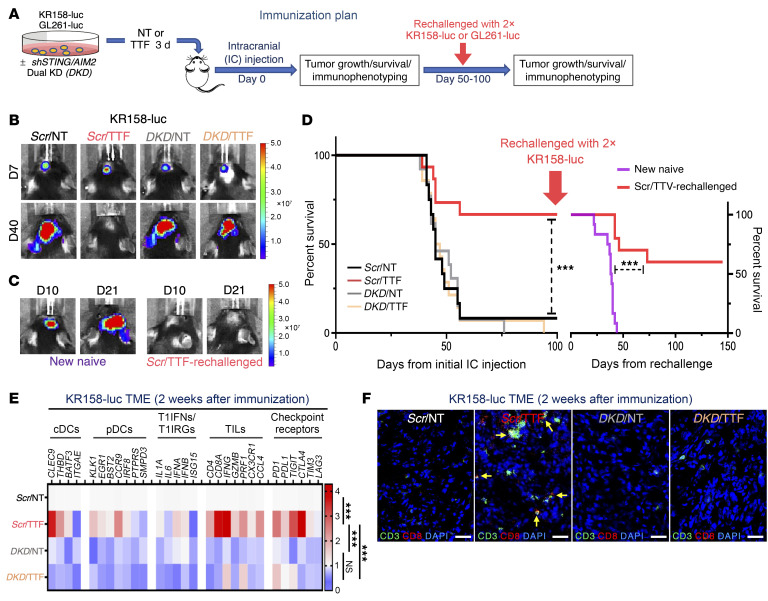
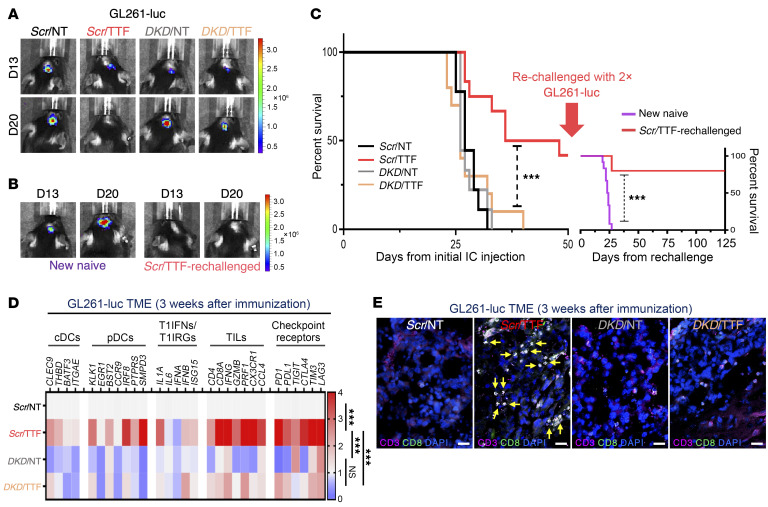
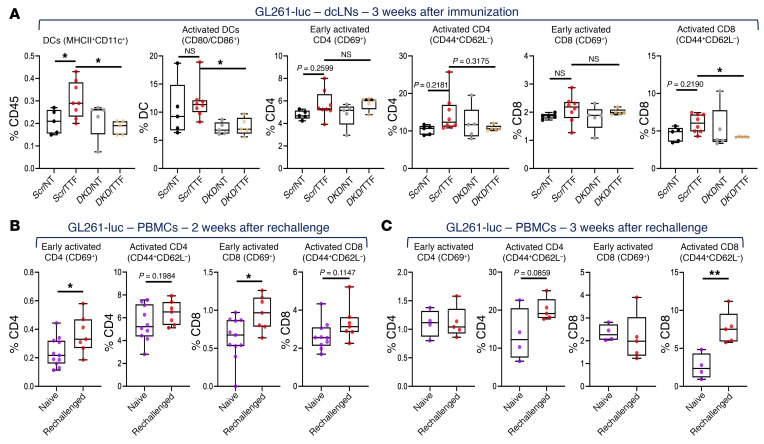
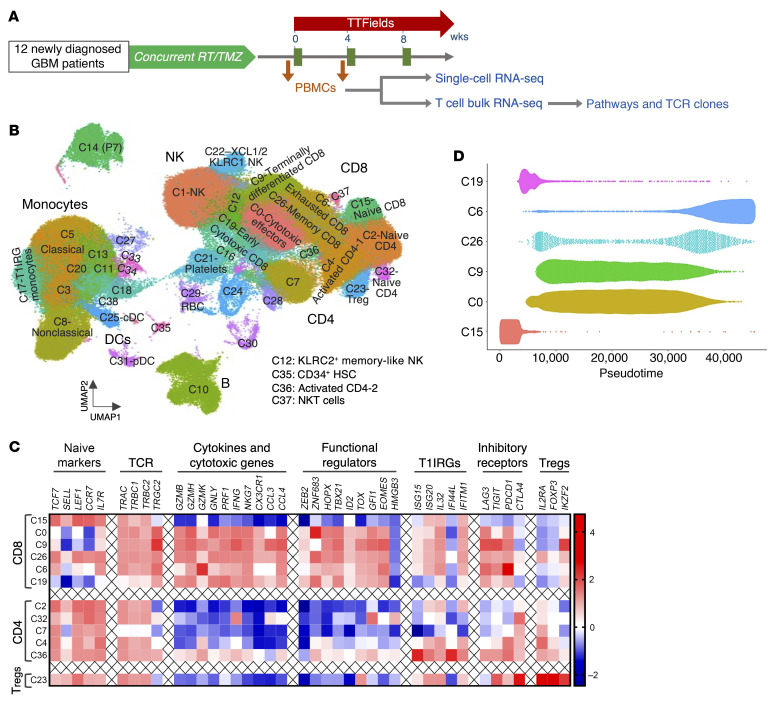
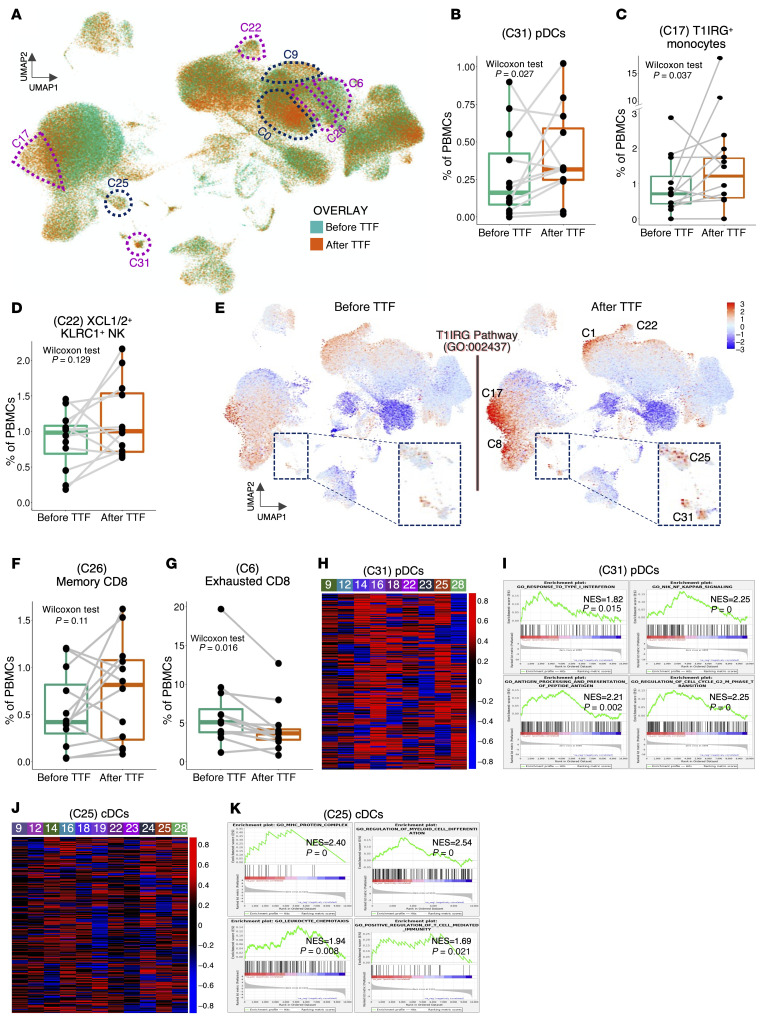
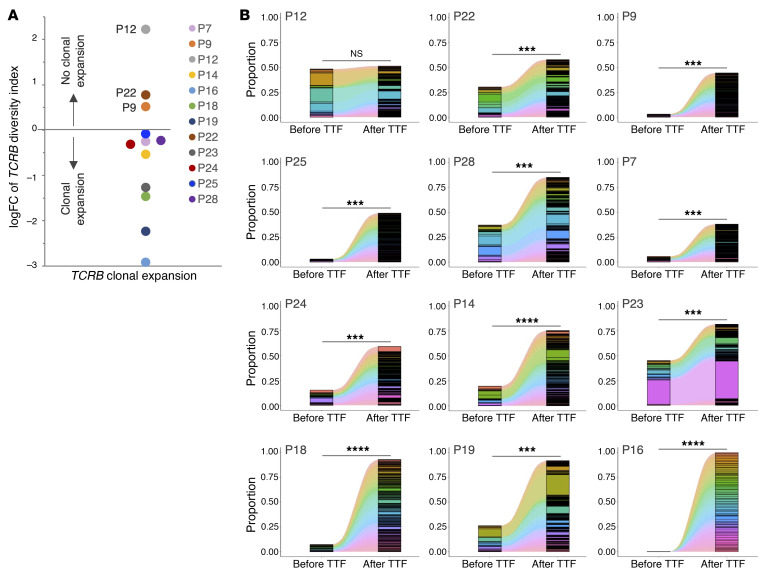
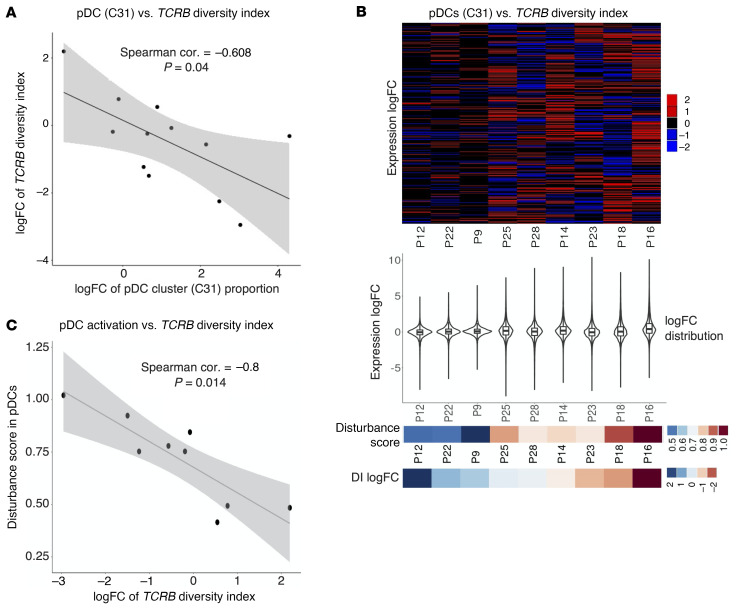
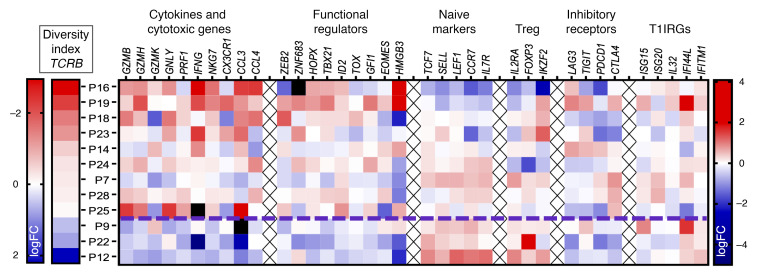
Tumor Treating Fields (TTFields), an approved therapy for glioblastoma (GBM) and malignant mesothelioma, employ noninvasive application of low-intensity, intermediate-frequency, alternating electric fields to disrupt the mitotic spindle, leading to chromosome missegregation and apoptosis. Emerging evidence suggests that TTFields may also induce inflammation. However, the mechanism underlying this property and whether it can be harnessed therapeutically are unclear. Here, we report that TTFields induced focal disruption of the nuclear envelope, leading to cytosolic release of large micronuclei clusters that intensely recruited and activated 2 major DNA sensors - cyclic GMP-AMP synthase (cGAS) and absent in melanoma 2 (AIM2) - and their cognate cGAS/stimulator of interferon genes (STING) and AIM2/caspase 1 inflammasomes to produce proinflammatory cytokines, type 1 interferons (T1IFNs), and T1IFN-responsive genes. In syngeneic murine GBM models, TTFields-treated GBM cells induced antitumor memory immunity and a cure rate of 42% to 66% in a STING- and AIM2-dependent manner. Using single-cell and bulk RNA sequencing of peripheral blood mononuclear cells, we detected robust post-TTFields activation of adaptive immunity in patients with GBM via a T1IFN-based trajectory and identified a gene panel signature of TTFields effects on T cell activation and clonal expansion. Collectively, these studies defined a therapeutic strategy using TTFields as cancer immunotherapy in GBM and potentially other solid tumors.

Keywords: Brain cancer; Cancer immunotherapy; Innate immunity; Oncology.


Conflict of interest statement

Conflict of interest: DDT has received research grants, personal honoraria (<$10,000 annually), and the Inovitro system from Novocure to support parts of the work reported here. The conceptualization, design, data collection, analysis, interpretation, decision to publish, and manuscript preparation were performed by the authors independently of Novocure. DC and DDT are inventors of 2 patent applications (nos. 63172862 and 63015093) based on the data. All rights were transferred to Novocure. DDT has received research funding in the last 12 months from Merck, Sarepta, and Lacerta.

Figures

Figure 1
Figure 1. TTFields-induced cytosolic micronuclei clusters recruit cGAS and AIM2 in patient-derived GSCs.
(See Supplemental Figures 1–7). (A) 3D confocal images showing immunofluorescence staining (IF) for cGAS and AIM2 and counterstained with DAPI for DNA in CA1, CA3, and CA7 GSCs either nontreated (NT) (top) or treated with TTFields at 200 kHz (TTF) (bottom) for 24 hours. Large micronuclei clusters extend directly from the true nuclei through a narrow bridge. Each square is 30 μm2; z height is 15 μm. (B) A bar plot showing percentages of GSCs with cGAS and AIM2-recruited cytosolic large micronuclei clusters and nuclear protrusions over the total cells counted in the experiments in A. Fisher’s exact test was used to compare 2 groups within each cell line. ***P < 0.001. (C) Representative confocal images showing IF of LAMINAC and DAPI counterstain in CA1 and L2 GSCs either NT or TTF for 24 hours, showing a focal rupture (CA1) and scattered perforations (L2) of the nuclear envelope leading to a large micronuclei cluster (broken yellow oval) and several nuclear protrusions, respectively. Scale bars: 10 μm. (D) A bar plot showing percentages of GSCs with cGAS and AIM2-recruited cytosolic large micronuclei clusters over the total cells counted, following pretreatment with either the vehicle or ribociclib (4.5 μM) to induce G1 arrest, followed by TTFields treatment for 24 hours, demonstrating that S-phase entry is required for TTFields-induced cytosolic micronuclei clusters. L2 cells are relatively resistant to ribociclib. Fisher’s exact test with adjustments for multiple comparisons was used. ***P < 0.001. NS, not significant. All data are representative of at least 3 independent experiments.
Figure 2
Figure 2. TTFields activate the cGAS/STING inflammasome in GSCs.
(See Supplemental Figure 8). (A and B) The cGAS/STING inflammasome’s components IRF3 and p65 were activated following 24 hours of TTFields, as determined by immunoblotting for p-IRF3 and p-p65 in total lysate (A) and quantified by densitometry relative to total IRF3 and p65 levels and normalized to β-actin, with values for the nontreated set to 1 (B) in the 4 GSC lines. LC3A/B-I and -II were used to confirm the general TTFields effects. (C) Confocal images of IF demonstrating increased concentration and recruitment of p-IRF3 and p65 within cytosolic micronuclei clusters and protrusions after 24-hour treatment with TTFields with DAPI counterstain in the 4 GSC lines. Scale bars: 10 μm. All experiments used triplicate samples and were repeated at least 3 times. Data are represented as mean ± SEM. Analyses were performed using Student’s t test with a 2-tailed distribution. *P < 0.05, **P < 0.01, ***P < 0.001.
Figure 3
Figure 3. TTFields-activated cGAS/STING inflammasome induces PICs, T1IFNs, and T1IRGs in GSCs.
(See Supplemental Figures 9 and 10). (A and B) Combination bar and dot plots demonstrating relative mRNA upregulation of indicated PICs (A) and T1IFNs/T1IRGs (B) after 24-hour treatment with TTFields in the 4 GSC lines. (C and D) Combination bar and dot plots showing that TTFields-induced upregulation of PICs and T1IFNs/T1IRGs was dependent on STING as measured in mRNA expression at 24 hours (C) and in IFN-β protein level in total lysate by ELISA at 72 hours (D) after TTFields treatment in the presence of scrambled (Scr) or 1 of the 2 independent shSTING-1 and shSTING-2 shRNAs. (E) A shSTING-2–resistant STING construct (Resist. STING) rescued shSTING-2–dependent suppression of TTFields-induced PICs and T1IFNs in CA3 GSCs, thus ruling out off-target effects of shSTING-2. All experiments used triplicate samples and were repeated at least 3 times. Data are represented as mean ± SEM. Analyses were performed using Student’s t test with a 2-tailed distribution for A and B, and 1-way ANOVA for CE. *P < 0.05, **P < 0.01, ***P < 0.001.
Figure 4
Figure 4. TTFields activate the AIM2/caspase 1 inflammasome in GSCs.
(See Supplemental Figure 11). (A and B) Caspase 1 activation level following 24 hours of TTFields treatment, as measured by FAM-YVAD-FMK in the 4 GSC lines that expressed scrambled (Scr) or 1 of 2 independent shAIM2-1 and shAIM2-2 shRNAs (A) and summarized in a bar and dot graph (B). (C) A shAIM2-1–resistant AIM2 construct (Resist. AIM2) rescued shAIM2-1–dependent suppression of TTFields-induced caspase 1 activation in CA1 GSCs, thus ruling out off-target effects of shAIM2-1. (D) Radiographs of immunoblotting for GSDMD showing the caspase 1–cleaved product (N-GSDMD) in total lysates from nontreated or TTFields-treated CA1 and CA3 GSCs expressing Scr or 1 of the 2 AIM2 shRNAs. Shown is also fold change (FC) in density of the N-GSDMD relative to the full-length GSDMD and normalized to β-actin, with values for the nontreated Scr set to 1. All experiments used triplicate samples and were repeated at least 3 times. Data are represented as mean ± SEM. Analyses were performed using 1-way ANOVA. *P < 0.05; **P < 0.01; ***P < 0.001.
Figure 5
Figure 5. TTFields-activated AIM2/caspase 1 inflammasome induces membrane-damaged cell death in GSCs.
(See Supplemental Figure 11). (A) A combination bar and dot plot of an LDH release assay showing TTFields-induced plasma membrane disruption in an AIM2-dependent manner following 24 hours of TTFields treatment in the presence of scrambled (Scr) or 1 of 2 independent AIM2 shRNAs. (B and C) Combination bar and dot plots of an LDH release assay showing that TTFields-induced membrane-damaged cell death following 24 hours of TTFields treatment is distinct from apoptotic cell death caused by TMZ (150 μM for 24 hours) (B) as measured by annexin V membrane binding (C). All experiments used triplicate samples and were repeated at least 3 times. Data are represented as mean ± SEM. Analyses were performed using 1-way ANOVA. ***P < 0.001.
Figure 6
Figure 6. TTFields-induced PICs and T1IFNs stimulate DCs and lymphocytes.
(See Supplemental Figure 12). (A) Schema of the coculture experiment. (BF) Combination bar and dot plots showing immunophenotyping of all CD45+ cells in syngeneic splenocytes from C57BL/6J mice (n = 3) cocultured with conditioned supernatants obtained from KR158 cells with or without scrambled (Scr), individual shSTING or shAIM2, or dual shSTING/AIM2 shRNAs that were either nontreated or treated with TTFields for 24 hours for the fractions of total DCs (MHCII+CD11C+) (B), activated DCs (CD80+CD86+) (C), total, early activated (CD69+) and fully activated (CD44+CD62L) CD4+ (D) and CD8+ (E) T cells, and total (MHCII+CD11B+) and activated (F4/80+) macrophages (F). All experiments used triplicate samples and were repeated at least 3 times. Data are represented as mean ± SEM. Analyses were performed using Student’s t test with a 2-tailed distribution. *P < 0.05; **P < 0.01; ***P < 0.001.
Figure 7
Figure 7. Induction of antitumor immunity in the KR158 syngeneic GBM model by TTFields requires STING and AIM2.
(See Supplemental Figures 12–15). (A) Schema detailing the immunization and rechallenge protocol testing TTFields-treated murine GBM cells as a complete tumor cell–intrinsic immunizing platform. (BF) Antitumor immunity in C57BL/6J mice induced by TTFields-treated KR158-luc cells. Representative photographs showing orthotopic GBM growth by BLI after immunization with Scr/NT (n = 12), Scr/TTF (n = 15), DKD/NT (n = 13), or DKD/TTF (n = 14) cells (B) and after rechallenge with twice the number of parental cells in the surviving Scr/TTF cohort (n = 10) and a new naive cohort (n = 12) (C). (D) Kaplan-Meier estimates showing survival rates after initial immunization and rechallenge and the immune TME summarized with a heatmap of a 29-immune-gene expression profile by qRT-PCR (n = 5 per cohort) (E) and representative images of IF for CD8, CD3, and DAPI counterstain (F). Scale bars: 50 μm. Log-rank test was used to compare survival rates and 2-way ANOVA to compare immune TME profile differences. ***P < 0.001. NS, not significant.
Figure 8
Figure 8. Induction of antitumor immunity in the GL261 syngeneic GBM model by TTFields requires STING and AIM2.
(See Supplemental Figures 12–15). Antitumor immunity in C57BL/6J mice induced by TTFields-treated GL261-luc GBM cells. Representative photographs showing orthotopic GBM tumor growth by BLI after immunization with Scr/NT (n = 9), Scr/TTF (n = 12), DKD/NT (n = 9), or DKD/TTF (n = 10) cells (A) and after rechallenge with twice the number of parental cells in the surviving Scr/TTF cohort (n = 5) and a new naive cohort (n = 12) (B). (C) Kaplan-Meier estimates showing survival rates after initial immunization and rechallenge and the immune TME summarized with a heatmap of a 29-immune gene expression profile by qRT-PCR (n = 5 per cohort) (D) and representative images of IF for CD8, CD3, and DAPI counterstain (E). Scale bar: 50 μm. Log-rank test was used to compare survival rates and 2-way ANOVA to compare immune TME profile differences. ***P < 0.001. NS, not significant.
Figure 9
Figure 9. Immunophenotyping of TTFields-induced antitumor immunity in the KR158 GBM model.
(See Supplemental Figure 13). (A) Combination box-and-whisker and dot plots showing immunophenotyping of C57BL/6J mice immunized with KR158-luc in various conditions in Figure 7 for total DCs and the fractions of activated DCs, early and fully activated CD4+ and CD8+ T cells in dcLNs 2 weeks after immunization (n = 7–12 mice for each cohort). (B and C) Combination box-and-whisker and dot plots showing immunophenotyping for the fractions of total DCs and early and fully activated CD4+ and CD8+ T cells in PBMCs of surviving Scr/TTF KR158-luc–immunized animals 1 (B) and 2 (C) weeks after rechallenge with twice the number of parental KR158 cells as compared with a new naive cohort implanted with the same cells (n = 5 for naive and n = 4 for Scr/TTF-rechallenged). (D and E) Combination box-and-whisker and dot plots showing the fractions of central memory (CM) CD4+ and CD8+ T cells and their activated (effector) counterparts in dcLNs (D) and splenocytes (E) in long-term-surviving Scr/TTF KR158-luc–immunized animals 20 weeks after rechallenge as compared with age-matched, sex-matched naive mice implanted with the same KR158-luc cells for 2 weeks (n = 6 each for naive and Scr/TTF-rechallenged). Data are represented as mean ± SEM. The whiskers are the minimum and maximum values, the lower and upper box edges the 25th and 75th percentage values, respectively, and the lines within the boxes the median. Comparisons were performed using 1-way ANOVA for A and Student’s t test with a 2-tailed distribution for BE. *P < 0.05; **P < 0.01; ***P < 0.001.
Figure 10
Figure 10. Immunophenotyping of TTFields-induced antitumor immunity in the GL261 GBM model.
(See Supplemental Figure 14). (A) Combination box-and-whisker and dot plots showing immunophenotyping of C57BL/6J mice immunized with GL261-luc in various conditions in Figure 8 for total DCs and the fractions of activated DCs, early and fully activated CD4+ and CD8+ T cells in dcLNs 3 weeks after immunization (n = 8 for Scr/TTF and n = 5 for the other 3 cohorts). (B and C) Combination box-and-whisker and dot plots showing immunophenotyping for the fractions of early and fully activated CD4+ and CD8+ T cells in PBMCs of surviving Scr/TTF GL261-luc–immunized animals 2 (B) and 3 (C) weeks after rechallenge with twice the number of parental GL261 cells as compared with a new naive cohort implanted with the same cells (for 2 weeks, n = 11 for naive and n = 7 for Scr/TTF-rechallenged; for 3 weeks, n = 4 for naive and n = 5 for Scr/TTF-rechallenged). Data are represented as mean ± SEM. The whiskers are the minimum and maximum values, the lower and upper box edges the 25th and 75th percentage values, respectively, and the lines within the boxes the median. Comparisons were performed using 1-way ANOVA for A and Student’s t test with a 2-tailed distribution for B and C. *P < 0.05; **P < 0.01.
Figure 11
Figure 11. Single-cell and bulk RNA-seq of PBMCs in patients with newly diagnosed GBM treated with TTFields.
(A) A diagram detailing adjuvant TTFields treatment in 12 patients with newly diagnosed GBM and the 2 analytical plans for PBMCs. (See Supplemental Tables 1–4 and Supplemental Figures 16 and 17). (B) A colored cell cluster map at resolution 1 using UMAP with 38 major immune cell types and subtypes of 193,760 PBMCs in 12 GBM patients. (See Supplemental Figures 18 and 19). (C) A heatmap of expression levels of the indicated gene set implicated in various T cell differentiation and functions providing the basis for annotations of the indicated major T cell clusters. (D) A graph showing pseudotime reconstruction of CD8+ T cell differentiation progression based on clusters in B.
Figure 12
Figure 12. TTFields treatment correlates with immune activation via a T1IRG-based trajectory in GBM patients.
(A) An overlay of pre-TTFields (pre-TTF, green) and post-TTF (orange) UMAP plots showing post-TTF changes. The purple broken lines denote clusters with both proportional and expression changes and the blue broken lines denote some of the clusters with expression changes only. (BD, F, and G) Combination box-and-whisker and paired dot plots showing the proportions of the indicated clusters as percentages of total PBMCs in pre-TTF and post-TTF PBMCs in all 12 patients. Analysis was performed using Wilcoxon’s test. The whiskers are the minimum and maximum values, the lower and upper box edges the 25th and 75th percentage values, respectively, and the lines within the boxes the median. (See Supplemental Figure 22). (E) A heatmap of mean expression levels of the T1IRG pathway GO:0034340 at the single-cell, cluster-agnostic level in pre-TTF and post-TTF PBMCs in all 12 patients. (See Supplemental Figure S20A). (H and J) Heatmaps of gene expression showing logFC of expression of all genes in post-TTF compared with pre-TTF pDCs (n = 9) (H) and cDCs (n = 11) (J) in patients with detectable pre- and post-TTF counts. (See Supplemental Table 5 and Supplemental Figure 21). (I and K) GSEA of the indicated GO pathways in pDCs (I) and cDCs (K) in the same pre- and post-TTFields samples in H and J, respectively. NES, normalized enrichment score.
Figure 13
Figure 13. TTFields treatment correlates with TCRB clonal expansion in GBM patients.
(See Supplemental Table 6 and Figure 23). (A) A dot plot of logFC of the Simpson diversity index (DI) of TCRB showing TCRB clonal expansion after TTFields treatment (negative DI logFC) in 9 of 12 patients. (B) 2D area charts of the 200 most abundant TCRB clones in post-TTFields T cells as compared with their proportions in pre-TTFields T cells showing clonal expansion in 11 of 12 patients. Student’s t test with a 2-tailed distribution was used for comparison. ***P < 0.001, ****P < 0.0001. NS, not significant.
Figure 14
Figure 14. TTFields-induced TCRB clonal expansion correlates with pDC activation.
(A) A scatter plot of logFC of DI versus logFC of proportion of cluster 31 (C31, pDCs) in all 12 patients showing a moderate negative correlation (Spearman’s correlation coefficient r = –0.608, P = 0.04). (B and C) Global gene expression disturbance after TTFields in pDCs (C31) strongly correlated with TCRB DI logFC in 9 patients who had detectable pre- and post-TTFields pDC counts. (B) Top: A heatmap of gene expression logFC between pre- and post-TTFields treatment. Middle: A violin plot of gene expression logFC distribution. Bottom: A heatmap of disturbance score, defined as mean of absolute gene expression logFC versus a heatmap of TCRB DI logFC ordered in decreasing DI logFC. (C) A scatter plot of TCRB DI logFC versus disturbance score showing a strong negative correlation (Spearman’s correlation coefficient r = –0.8, P = 0.014).
Figure 15
Figure 15. A gene panel signature of adaptive immune induction by TTFields in patients with GBM.
A heatmap of gene expression of the same gene set used for T cell cluster annotations in the 12 patients ordered in increasing TCRB DI logFC showing a signature of adaptive immune induction by TTFields in patients with GBM.

Comment in

References

    1. Stupp R, et al. Effects of radiotherapy with concomitant and adjuvant temozolomide versus radiotherapy alone on survival in glioblastoma in a randomised phase III study: 5-year analysis of the EORTC-NCIC trial. Lancet Oncol. 2009;10(5):459–466. doi: 10.1016/S1470-2045(09)70025-7. - DOI - PubMed
    1. Sampson JH, et al. Brain immunology and immunotherapy in brain tumours. Nat Rev Cancer. 2020;20(1):12–25. doi: 10.1038/s41568-019-0224-7. - DOI - PMC - PubMed
    1. Tomaszewski W, et al. Brain tumor microenvironment and host state: implications for immunotherapy. Clin Cancer Res. 2019;25(14):4202–4210. doi: 10.1158/1078-0432.CCR-18-1627. - DOI - PMC - PubMed
    1. Ochoa de Olza M, et al. Turning up the heat on non-immunoreactive tumours: opportunities for clinical development. Lancet Oncol. 2020;21(9):419–430. - PubMed
    1. Kirson ED, et al. Alternating electric fields arrest cell proliferation in animal tumor models and human brain tumors. Proc Natl Acad Sci U S A. 2007;104(24):10152–10157. doi: 10.1073/pnas.0702916104. - DOI - PMC - PubMed

Publication types