. 2022 May;110(4):946-960.
doi: 10.1111/tpj.15712. Epub 2022 Mar 9.

A revised view on the evolution of glutamine synthetase isoenzymes in plants

Affiliations

A revised view on the evolution of glutamine synthetase isoenzymes in plants

José Miguel Valderrama-Martín et al. Plant J. 2022 May.

Abstract

Glutamine synthetase (GS) is a key enzyme responsible for the incorporation of inorganic nitrogen in the form of ammonium into the amino acid glutamine. In plants, two groups of functional GS enzymes are found: eubacterial GSIIb (GLN2) and eukaryotic GSIIe (GLN1/GS). Only GLN1/GS genes are found in vascular plants, which suggests that they are involved in the final adaptation of plants to terrestrial life. The present phylogenetic study reclassifies the different GS genes of seed plants into three clusters: GS1a, GS1b and GS2. The presence of genes encoding GS2 has been expanded to Cycadopsida gymnosperms, which suggests the origin of this gene in a common ancestor of Cycadopsida, Ginkgoopsida and angiosperms. GS1a genes have been identified in all gymnosperms, basal angiosperms and some Magnoliidae species. Previous studies in conifers and the gene expression profiles obtained in ginkgo and magnolia in the present work could explain the absence of GS1a in more recent angiosperm species (e.g. monocots and eudicots) as a result of the redundant roles of GS1a and GS2 in photosynthetic cells. Altogether, the results provide a better understanding of the evolution of plant GS isoenzymes and their physiological roles, which is valuable for improving crop nitrogen use efficiency and productivity. This new view of GS evolution in plants, including a new cytosolic GS group (GS1a), has important functional implications in the context of plant metabolism adaptation to global changes.

Keywords: adaptation; glutamine synthetase; new gene classification; nitrogen metabolism; phylogeny; plant evolution.


Conflict of interest statement

The authors declare that they have no conflicts of interest associated with this work.

Figures
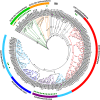
Figure 1
Figure 1
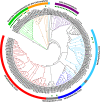
Phylogenetic tree of plant glutamine synthetase (GS) nucleotide sequences obtained following a Bayesian analysis. The first two letters of the sequence names correspond to the genera and species listed in Table S1. Green circles highlight the sequences exhibiting a predicted plastidic localization. Orange circles highlight the sequences exhibiting a predicted mitochondrial localization. Branch lengths are not presented. [Colour figure can be viewed at wileyonlinelibrary.com]
Figure 2
Figure 2
Protein phylogenetic tree of plant glutamine synthetase (GS) protein sequences following a maximum‐likelihood analysis. The first two letters of the sequence names correspond to the genera and species listed in Table S1. Green circles highlight the sequences with a predicted chloroplastic localization. Orange circles highlight the sequences with a predicted mitochondrial localization. Branch lengths are not presented. [Colour figure can be viewed at wileyonlinelibrary.com]
Figure 3
Figure 3
PpGS1a and PpGS1b gene expression in Pinus pinaster seedlings grown under different light regimes. L/D cycle (16‐h light /8‐h dark photoperiod, red bars), transition from light photoperiod to continuous darkness (orange bars), continuous darkness (yellow bars) and transition from complete darkness to light photoperiod (blue bars). Significant differences were determined using two‐way analysis of variance (ANOVA) that compares the mean for each condition with the mean of the other condition in the same organ. Letters above the columns indicate significant differences on a Tukey’s post hoc test (P < 0.05). [Colour figure can be viewed at wileyonlinelibrary.com]
Figure 4
Figure 4
Glutamine synthetase (GS) gene expression in Ginkgo biloba seedlings grown under different light regimes. (a) One‐month‐old seedlings grown under the L/D cycle (16‐h light/8‐h dark photoperiod, red bars) and under continuous darkness (yellow bars). A Pearson correlation test was applied to the expression level of the different GS genes to quantify their relationship, indicated in the red squares. The significant P values (<0.05) for the Pearson coefficient are indicated in brackets. (b) One‐year‐old seedlings grown under the L/D cycle (16‐h light/8‐h dark photoperiod, red bars), under transition from the light photoperiod to continuous darkness (orange bars) and under transition from complete darkness to light photoperiod (blue bars). Significant differences were determined using a two‐way analysis of variance (anova) to compare the mean for each growth condition with the mean of the other conditions in the same organ. Letters above the columns indicate significant differences based on a Tukey’s post hoc test (P < 0.05); nd, not detected; ms, missing sample. [Colour figure can be viewed at wileyonlinelibrary.com]
Figure 5
Figure 5
Glutamine synthetase (GS) gene expression in Magnolia grandiflora seedlings grown under different light regimes: L/D cycle (16‐h light/8‐h dark photoperiod, red bars); transition from light photoperiod to continuous darkness (orange bars); continuous darkness (yellow bars); and transition from complete darkness to light photoperiod (blue bars). Significant differences were determined using a two‐way analysis of variance (anova) that compares the mean for each condition with the mean of the other condition for the same organ. Letters above the columns indicate significant differences on a Tukey’s post hoc test (P < 0.05). Pearson’s correlation test was used to test for correlations between the expression levels of the different genes expressed in M. grandiflora. The significant P values (<0.05) are indicated in brackets. [Colour figure can be viewed at wileyonlinelibrary.com]
Figure 6
Figure 6
Schematic representation of GS2 emergence hypotheses: (a) two‐event hypothesis; (b) single‐event hypothesis. (c) Simplified metabolic pathways in a photosynthetic cell in which ammonium assimilation is catalyzed by GS1a. (d) Metabolic pathway of a photosynthetic cell in which ammonium assimilation is catalyzed by GS2. GS, glutamine synthetase; Fd‐GOGAT, ferredoxin‐dependent glutamate synthase; NR, nitrate reductase; NiR, nitrite reductase. [Colour figure can be viewed at wileyonlinelibrary.com]

Similar articles

Cited by

References

    1. Afgan, E. , Baker, D. , Batut, B. , van den Beek, M. , Bouvier, D. , Čech, M. et al. (2018) The galaxy platform for accessible, reproducible and collaborative biomedical analyses: 2018 update. Nucleic Acids Research, 46, W537–W544. - PMC - PubMed
    1. Almagro Armenteros, J.J. , Salvatore, M. , Emanuelsson, O. , Winther, O. , von Heijne, G. et al. (2019) Detecting sequence signals in targeting peptides using deep learning. Life Science Alliance, 2, e201900429. - PMC - PubMed
    1. Altschul, S.F. , Gish, W. , Miller, W. , Myers, E.W. & Lipman, D.J. (1990) Basic local alignment search tool. Journal of Molecular Biology, 215, 403–410. - PubMed
    1. Amiour, N. , Décousset, L. , Rouster, J. , Quenard, N. , Buet, C. , Dubreuil, P. et al. (2021) Impacts of environmental conditions, and allelic variation of cytosolic glutamine synthetase on maize hybrid kernel production. Communications Biology, 4, 1095. - PMC - PubMed
    1. Ávila, C. , Suárez, M.F. , Gómez‐Maldonado, J. & Cánovas, F.M. (2001) Spatial and temporal expression of two cytosolic glutamine synthetase genes in scots pine: functional implications on nitrogen metabolism during early stages of conifer development. The Plant Journal, 25, 93–102. - PubMed

Publication types