. 2022 Jun 13;61(24):e202117724.
doi: 10.1002/anie.202117724. Epub 2022 Apr 12.

Tailored Pyridoxal Probes Unravel Novel Cofactor-Dependent Targets and Antibiotic Hits in Critical Bacterial Pathogens

Affiliations

Tailored Pyridoxal Probes Unravel Novel Cofactor-Dependent Targets and Antibiotic Hits in Critical Bacterial Pathogens

Martin Pfanzelt et al. Angew Chem Int Ed Engl. .

Abstract

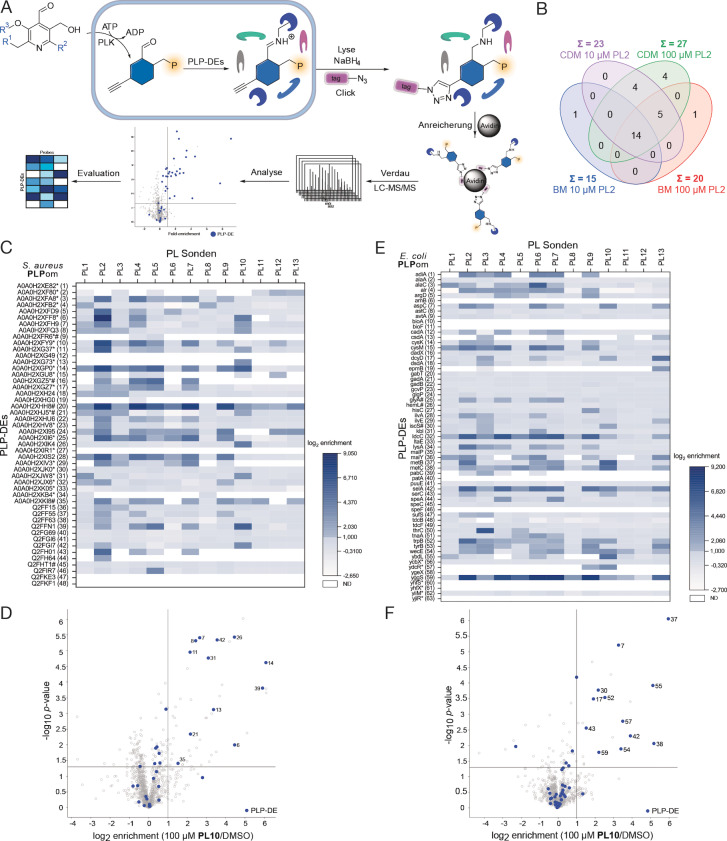
Unprecedented bacterial targets are urgently needed to overcome the resistance crisis. Herein we systematically mine pyridoxal phosphate-dependent enzymes (PLP-DEs) in bacteria to focus on a target class which is involved in crucial metabolic processes. For this, we tailored eight pyridoxal (PL) probes bearing modifications at various positions. Overall, the probes exceeded the performance of a previous generation and provided a detailed map of PLP-DEs in clinically relevant pathogens including challenging Gram-negative strains. Putative PLP-DEs with unknown function were exemplarily characterized via in-depth enzymatic assays. Finally, we screened a panel of PLP binders for antibiotic activity and unravelled the targets of hit molecules. Here, an uncharacterized enzyme, essential for bacterial growth, was assigned as PLP-dependent cysteine desulfurase and confirmed to be inhibited by the marketed drug phenelzine. Our approach provides a basis for deciphering novel PLP-DEs as essential antibiotic targets along with corresponding ways to decipher small molecule inhibitors.

Keywords: Antibiotic Compound Screening; Cofactors; Enzyme Characterisation; Proteomics; Pyridoxal Phosphate-Dependent Enzymes.


Conflict of interest statement

The authors declare no conflict of interest.

Figures

Figure 1
Figure 1
PL probe library and activation by pyridoxal kinase. A) Activation of PL occurs by phosphorylation with pyridoxal kinase (PLK) to form PLP, which can bind PLP‐DEs via an internal aldimine to an active site lysine residue. Reaction with substrate amines leads to the formation of external aldimines, which can undergo various reactions via quinonoid structures. B) Structures of first and second generation PL probes applied in this study. Type A probes are derivatised at the C2′, type B probes at the C6 and one type C probe is modified at the C3′. C) Activation of PL probes by pyridoxal kinases (E. coli pdxK or S. aureus SaPLK) were monitored by measuring UV/Vis absorbance over time (every 40 min, 20 cycles, n=3, mean±SEM). Phosphorylated species absorb at around 395 nm, unphosphorylated around 320 nm. Phosphorylation efficiency is depicted by comparing the absorbance [a.u.] from phosphorylated species (PLX, X=1–13) at the beginning (PLXPinit ) and at the end (PLXPend ). For PL6 SaPLK phosphorylation, the difference of initial and final absorbance at wavelengths of the unphosphorylated compound is depicted. For PL13, phosphorylated compound absorbed at 320 nm. Raw data of all compounds are shown in Figure SI1, 2.
Scheme 1
Scheme 1
Synthesis scheme for derivatisation of PL to type A, B and C ABPP probes. (Type A) PL hydrochloride is protected with a methoxymethyl (MOM) group and as a methyl acetal, which is then alkylated at the C2′ position as described previously.[ 13 , 20 ] The compound is further modified with an azide linker. Final deprotection leads to type A probes. (Type B) PL hydrochloride is protected to the pivaloyl (Piv) ester, oxidized to the N‐oxide with meta‐chloroperbenzoic acid (m‐CPBA), activated by iso‐butyl chloroformate (IBCF) and then reacted with an alkyne‐Grignard reagent to form C6 modified PL scaffolds. Final, basic deprotection leads to type B derivatives. (Type C) Deprotonation of PL hydrochloride at the C3 alcohol and substitution with propargyl bromide yields type C probe PL13.
Figure 2
Figure 2
S. aureus and E. coli PLPome profiling. A) PL probes are taken up by the cells, get phosphorylated by PLK and subsequently function as PLP surrogates. After cell lysis, internal aldimines are reduced by sodium borohydride for downstream processing. Copper‐assisted azide‐alkyne click chemistry or Staudinger ligation to enrichment tags allows proteomic analysis and PLPome profiling. B) Comparison of enriched PLP‐DEs in S. aureus using different media (B medium, BM or chemically defined medium, CDM) and different PL2 concentrations (10 and 100 μM). C) Heatmap representing log2 enrichment values of all known or putative PLP‐DEs in S. aureus for all 13 PL probes (n=3). Enriched proteins have log2 enrichment values higher or equal 1. Proteins not detected (ND) at all are coloured white. PLP‐DEs with a putative function or which are poorly characterised are marked with an asterisk. Essential enzymes are marked with a #. D) Volcano plot of PL10 enrichment at 100 μM in S. aureus USA300 TnpdxS compared to DMSO representing the t‐test results (criteria: log2 enrichment>1 and p‐value<0.05, n=3). Blue colours depict PLP‐DEs. Assigned numbers refer to Table SI1. Remaining plots are shown in Figure SI4. E) Heatmap representing log2 enrichment values of all known or putative PLP‐DEs in E. coli for all 13 PL probes (n=3). Enriched proteins have log2 enrichment values higher or equal 1. Proteins not detected (ND) at all are coloured white. PLP‐DEs with a putative function or which are poorly characterised are marked with an asterisk. Essential enzymes are marked with a #. F) Volcano plot of PL10 enrichment at 100 μM in E. coli K12 ΔpdxJ compared to DMSO representing the t‐test results (criteria: log2 enrichment>1 and p‐value<0.05, n=3). Blue colours depict PLP‐DEs. Assigned numbers refer to Table SI2. Remaining plots are shown in Figure SI6.
Figure 3
Figure 3
P. aeruginosa PLPome profiling. A) Heatmap representing log2 enrichment values of all known or putative PLP‐DEs in P. aeruginosa PAO1 for selected 6 PL probes (n=3). Enriched proteins have log2 enrichment values higher or equal 1. Proteins not detected (ND) at all are coloured white. PLP‐DEs with a putative function or which are poorly characterised are marked with an asterisk. Essential enzymes are marked with a #. Remaining plots are shown in Figure SI7. Assigned numbers refer to Table SI3. B) Volcano plot of PL10 enrichment at 100 μM in P. aeruginosa compared to DMSO representing the t‐test results (criteria: log2 enrichment>1 and p‐value<0.05, n=3).
Figure 4
Figure 4
Characterization of enzymes with unknown function. A) PLP loading states of overexpressed proteins were determined by IP‐MS as described previously. B) EMSA gel under UV‐illumination. Concentrations are given in nM. The interaction of ydcR with the ydcR promoter region fragment PRydcR is clearly visible starting at 50 nM ydcR. The two lines (*) represent shifted DNA‐protein complexes. As negative controls, we included samples w/o ydcR (lane 1), w/o PRydcR (lane 2), w/ PRydcR‐ydcS instead of PRydcR (lane 5) and one sample with yjiR instead of ydcR (lane 6). To exclude unspecific DNA binding, we added 2 μg μL−1 salmon sperm DNA (SSDNA) to each sample (except lane 7). Samples containing PLP (lane 3, 10 eq) and PLP and putrescine (lane 4, 10 eq PLP, 400 eq) were included (see also Figure SI8). C) LC‐MS/MS analysis of products after incubation of PA2683 with l‐Ser, d‐Ser, l‐Thr or d‐Thr and additional AMP and PLP at 37 °C. The MS2 signals of products (pyruvate or oxobutanoate) were integrated and plotted as individual values (n=3). Heat control (HC) samples were treated equally except for incubating the protein for 5 min at 95 °C prior to addition of substrates. D) Michaelis–Menten kinetics of PA2683 (n=3, mean±SEM) were calculated in Graphpad Prism (see also Figure SI9). E) Spectroscopic properties of PLP species during transamination.[ 39 , 40 ] F) UV/Vis screening from 300 to 600 nm of aminotransferases PA3659 and PA3798 with 20 l‐amino acids (AA) and a mixture of 11 d‐amino acids (each 10 equivalents). Changes in absorbance at 390 or 430 nm (external aldimine) were calculated and normalised. G) LC‐MS/MS analysis of transaminated products after incubation of PA3659 with l‐Trp and PA3798 with l‐Gln (n=3). Heat control (HC) samples were treated equally except for incubating the protein for 5 min at 95 °C prior to addition of substrates.
Figure 5
Figure 5
MIC screen and target validation. A) Compound MIC‐screen against S. aureus, E. coli and P. aeruginosa. Structures of hit‐compounds and their corresponding MIC values are shown. B) LFQ intensities of selected PLP‐DEs in DMSO, PL2 treated and phenelzine treated S. aureus samples (n=3). For competitive labelling samples, cells were incubated with phenelzine for 30 min prior to 2 h PL2 labelling. Essential proteins are marked with a #. Raw data are given in Table SI7–9 and Figure SI12A. C) Activity of A0A0H2XII6 after incubation with different concentrations of phenelzine (n=3). Quantification of cadaverine was conducted by LC‐MS/MS (MS2 signal, parallel reaction monitoring PRM). IC50 values were calculated in Graphpad Prism 5.03 using the log(inhibitor) vs. response‐Variable slope function (four parameters). Heat control (HC) samples were treated equally except for incubating the protein for 5 min at 95 °C prior to addition of substrates. D) LC‐MS analysis of alanine after incubation of A0A0H2XHJ5 with l‐Cys (n=3). Heat control (HC) samples were treated equally except for incubating the protein for 5 min at 95 °C prior to addition of substrates. E) Activity of A0A0H2XHJ5 (sufS) after incubation with different concentrations of phenelzine (n=3). Quantification of alanine was conducted by LC/MS (MS1 signal, single ion monitoring SIM). IC50 values were calculated in Graphpad Prism 5.03 using the log(inhibitor) vs. response‐variable slope function (four parameters).

Similar articles

Cited by

References

    1. Perez-Riverol Y., Csordas A., Bai J., Bernal-Llinares M., Hewapathirana S., Kundu D. J., Inuganti A., Griss J., Mayer G., Eisenacher M. et al., Nucleic Acids Res. 2019, 47, D442–D450. - PMC - PubMed
    1. None
    1. Lakemeyer M., Zhao W., Mandl F. A., Hammann P., Sieber S. A., Angew. Chem. Int. Ed. 2018, 57, 14440–14475; - PubMed
    2. Angew. Chem. 2018, 130, 14642–14682;
    1. Lewis K., Cell 2020, 181, 29–45; - PubMed
    1. Barra A. L. C., Dantas L. D. O. C., Morão L. G., Gutierrez R. F., Polikarpov I., Wrenger C., Nascimento A. S., Front. Public Health 2020, 8, 26. - PMC - PubMed

Publication types

MeSH terms