. 2022 Apr;11(4):512-523.
doi: 10.1002/psp4.12779. Epub 2022 Mar 11.

Efficient simulation of clinical target response surfaces

Affiliations

Efficient simulation of clinical target response surfaces

Daniel Lill et al. CPT Pharmacometrics Syst Pharmacol. 2022 Apr.

Abstract

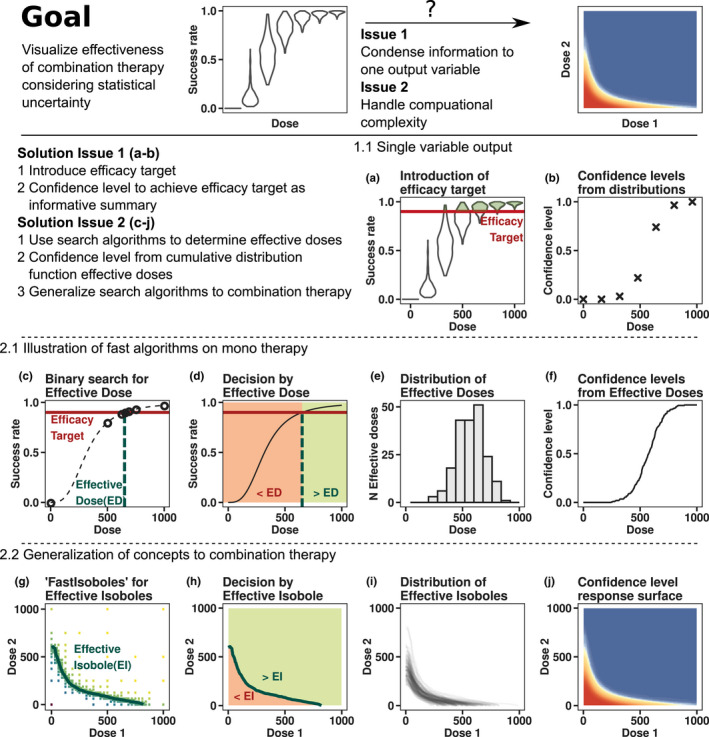
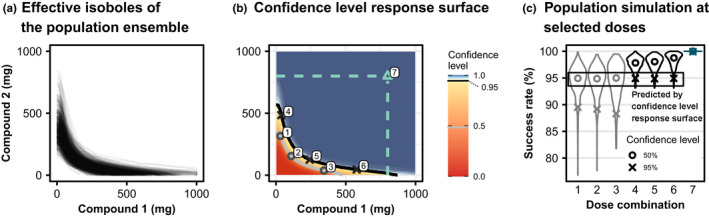
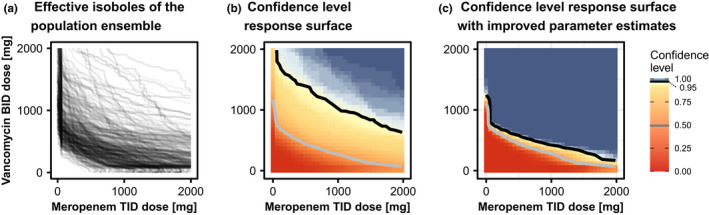
Simulation of combination therapies is challenging due to computational complexity. Either a simple model is used to simulate the response for many combinations of concentration to generate a response surface but parameter variability and uncertainty are neglected and the concentrations are constant-the link to the doses to be administered is difficult to make-or a population pharmacokinetic/pharmacodynamic model is used to predict the response to combination therapy in a clinical trial taking into account the time-varying concentration profile, interindividual variability (IIV), and parameter uncertainty but simulations are limited to only a few selected doses. We devised new algorithms to efficiently search for the combination doses that achieve a predefined efficacy target while taking into account the IIV and parameter uncertainty. The result of this method is a response surface of confidence levels, indicating for all dose combinations the likelihood of reaching the specified efficacy target. We highlight the importance to simulate across a population rather than focus on an individual. Finally, we provide examples of potential applications, such as informing experimental design.


Conflict of interest statement

The authors declared no competing interests for this work.

Figures

FIGURE 1
FIGURE 1
Overview of methods. (a) Success rate distributions resulting from parameter uncertainty, simulated at different doses. The efficacy target, a success rate of 90%, is highlighted as the red horizontal line. Shaded green areas of violin plots correspond to the fraction of populations meeting the efficacy target criterion. (b) Confidence level of reaching the efficacy target at a given dose. The confidence level corresponds to the green shaded areas in panel a. The confidence level is known exactly at only seven doses. (c) The dose‐success rate relationship for one population is shown as the dashed black line. The effective dose (dashed green line) indicates where success rates achieve the efficacy target (red horizontal line). Circles denote the iterations of a binary search algorithm which, in this case, finds the effective dose within five iterations, amounting to seven function evaluations. (d) The effective dose allows to classify any dose into non‐efficacious (red area) or efficacious (green area) via a simple “less than” operation. (e) Distribution of effective doses resulting from parameter uncertainty. (f) Confidence levels as cumulative distribution function of effective doses. The confidence level is known exactly at a much higher resolution but the computations took as many function evaluations as in panel b. (g) Newly developed algorithm “fastIsoboles,” which extends one‐dimensional binary search to finding arbitrary curves in two dimensions. The effective isobole (i.e., all dose combinations achieving the efficacy target), is shown as the green curve. (h) Classification of dose combinations into efficacious or nonefficacious solely based on the information contained in the effective isobole. (i) Distribution of effective isoboles resulting from parameter uncertainty. (j) Confidence level response surface resulting from aggregating the distribution of effective isoboles with the “aggregateIsoboles” algorithm. The highly resolved confidence level response surface was obtained at a fraction of the computational cost of the brute force approach
FIGURE 2
FIGURE 2
The fastIsoboles algorithm. (a) The algorithm is initialized at nine evenly spaced doses where the objective function is evaluated. The black curve represents the current approximation of the effective isobole of the 95% success rate efficacy target via 2D‐linear interpolation. Dose combinations to be evaluated in the next iteration are indicated by the crosses enclosed by the ribbon. (b) The algorithm at iteration two, with the updated dose combinations and updated approximation of the isobole. (c) The terminated algorithm at iteration six with highly resolved isobole
FIGURE 3
FIGURE 3
Confidence level response surface. (a) For each population, the effective isobole (EI; black curve) and the segments from the origin up to the intersect of the axes with the isobole (grey) are connected to form a polygon enclosing the dose combinations at which the treatment goal was not achieved. (b) Translation into binary values across all dose combinations. All dose combinations enclosed by the isobole and coordinate axes are shown in red and are coded as zero (for failure: efficacy target is not achieved), all other dose combinations are colored in green and are coded as one (for success: efficacy target is achieved or exceeded). (c) Averaging the binary values from the previous step over all populations for each dose combination results in the confidence level response surface. The 95% confidence level isobole is indicated as black curve
FIGURE 4
FIGURE 4
Malaria 1. Individual and population responses of the malaria model. (a) Response surface for one individual and its corresponding isobole (black line). In this case, success corresponds to cure. The black isobole divides the dosing space into unsuccessful and successful doses. At low levels of compound one, the isobole is concave: an increase of compound one dose only slightly decreases the required dose of compound two. (b) All individual cure isoboles for one population: interindividual variability leads to different individual cure isoboles each separating the dosing space into unsuccessful and successful regions differently. In color, are two different patient phenotypes in terms of drug sensitivity to either of the drugs. The blue subject responds well to drug one but poorly to drug two, the red subject vice versa. (c) Success rate response surface for one population and effective isobole (black line) at the target efficacy of 95% success rate. The effective isobole shows all dose combinations that achieve a 95% success rate in that population. The effective isobole is convex: at low doses of compound one, an increase of compound one dose reduces the required compound two dose to maintain the success rate. This beneficial property of the combination therapy is a population level effect
FIGURE 5
FIGURE 5
Malaria 2. Effective isoboles and confidence level response surfaces of the malaria model. (a) Different effective isoboles for different realizations of population parameters from the parameter uncertainty distribution. The isoboles of 750 populations, each including 1500 subjects are shown, the efficacy target is a success rate of 95%. (b) The confidence level response surface of achieving at least 95% success rate in the population. The grey isobole corresponds to a 50% confidence level, the black isobole to 95% confidence. Cyan dashed lines indicate the (hypothetical) maximum feasible dose. Numbers indicate the locations at which the exemplary population simulations in panel (c) were performed. (c) Traditional outcome of population simulations with the distribution of success rates across the populations simulated: distributions obtained from population simulations at the doses indicated in panel b. Simulations were performed independently from the calculations of the response surface to validate the results. The circles indicate the median of the distributions, while crosses indicate the lower end of the 95% left‐open confidence interval ranging between the 5% and 100% quantiles. The confidence level response surface indicates at which quantile the target success rate is located, but does not make any other statement about the rest of the distribution of success rates
FIGURE 6
FIGURE 6
Antibiotics. Effective isoboles and confidence level response surfaces of the antibiotics model. (a) Effective isoboles for antibiotics combination therapy treatment. The target efficacy is a 95% success rate of reaching the bactericidal endpoint. The given parameter uncertainty imposes a large variation between the population realizations. (b) The confidence level response surface of achieving the efficacy target of at least 95% success rate in the population. The grey isobole corresponds to a 50% confidence level, the black isobole to 95% confidence. The two confidence levels’ isoboles are rather distant, indicating the large influence of parameter uncertainty. (c) The standard deviations of the nine most influential parameters were reduced 20‐fold after a hypothetical experiment informing those parameters. The confidence level response surface changed dramatically, allowing for lower doses to be selected with high confidence: With improved parameter estimates, the confidence level of reaching 95% success rates at a dose combination of 1000 mg MER +500 mg VAN is about 99% whereas with poor parameter estimates (panel b), the confidence level at this dose combination is only about 75%. MER, meropenem; VAN, vancomycin

References

    1. World Health Organization . Guidelines for the Treatment of Malaria. 3rd ed. World Health Organization; 2015. ISBN 978 92 4 154912 7.
    1. Wicha SG, Kees MG, Kuss J, Kloft C. Pharmacodynamic and response surface analysis of linezolid or vancomycin combined with meropenem against Staphylococcus aureus. Pharm Res. 2015;32(7):2410‐2418. - PubMed
    1. Yadav R, Landersdorfer CB, Nation RL, Boyce JD, Bulitta JB. Novel approach to optimize synergistic carbapenem‐aminoglycoside combinations against carbapenem‐resistant Acinetobacter baumannii. Antimicrob Agents Chemother. 2015;59(4):2286‐2298. doi:10.1128/AAC.04379-14 - DOI - PMC - PubMed
    1. Bottino DC, Patel M, Kadakia E, et al. Dose optimization for anticancer drug combinations: maximizing therapeutic index via clinical exposure‐toxicity/preclinical exposure‐efficacy modeling. Clin Cancer Res. 2019;25(22):6633‐6643. - PubMed
    1. Pierrillas PB, Fouliard S, Chenel M, Hooker AC, Friberg LE, Karlsson MO. Model‐based adaptive optimal design (MBAOD) improves combination dose finding designs: an example in oncology. AAPS J. 2018;20(2):39. - PubMed

Publication types

LinkOut - more resources