. 2022 Feb;130(2):27013.
doi: 10.1289/EHP9808. Epub 2022 Feb 24.

Detection of Azoxystrobin Fungicide and Metabolite Azoxystrobin-Acid in Pregnant Women and Children, Estimation of Daily Intake, and Evaluation of Placental and Lactational Transfer in Mice

Affiliations

Detection of Azoxystrobin Fungicide and Metabolite Azoxystrobin-Acid in Pregnant Women and Children, Estimation of Daily Intake, and Evaluation of Placental and Lactational Transfer in Mice

Wenxin Hu et al. Environ Health Perspect. 2022 Feb.

Abstract

Background: Azoxystrobin (AZ) is a broad-spectrum strobilurin fungicide that is used in agriculture and was recently added to mold- and mildew-resistant wallboards. AZ was found to have toxic effects in animals at embryonic stages and was listed as a frontline target for biomonitoring in children.

Objectives: This study investigated exposure to AZ in pregnant women and young children, whether AZ could be transferred from an exposed mother to offspring, and whether AZ or one of its primary metabolites, AZ-acid, was neurotoxic in vitro.

Methods: We quantified AZ-acid, a sensitive indicator of AZ exposure, in urine samples collected from 8 pregnant women (12 urine samples) and 67 children (40-84 months old; 96 urine samples) with high-resolution mass spectrometry. Gestational and lactational transfer was assessed in C57Bl/6 mice. Neurotoxicity of AZ and AZ-acid was investigated in vitro with mouse cortical neuron cultures.

Results: AZ-acid was present above the limit of quantification (0.01 ng/mL) in 100% of the urine samples from pregnant women and in 70% of the urine samples from children, with median concentration of 0.10 and 0.07 ng/mL, and maximal concentration of 2.70 and 6.32 ng/mL, respectively. Studies in mice revealed that AZ transferred from the mother to offspring during gestation by crossing the placenta and entered the developing brain. AZ was also transferred to offspring via lactation. High levels of cytotoxicity were observed in embryonic mouse cortical neurons at concentrations that modeled environmentally relevant exposures.

Discussion: Our study suggested that pregnant women and children were exposed to AZ, and at least 10% of the children (2 out of 20 that were evaluated at two ages) showed evidence of chronic exposure. Future studies are warranted to evaluate whether chronic AZ exposure affects human health and development. https://doi.org/10.1289/EHP9808.


Figures

Figure 1A is a Chromatogram graph, plotting mass spectra, ranging from 0 to 100 in increments of 99 (y-axis) across time (minute), ranging from 10.0 to 17.0 in increments of 0.9 (x-axis). Figure 1B displays three chemical structures of azoxystrobin-acid in a graph, plotting biotransformation, ranging from 0 to 100 in increments of 99 (y-axis) across mass-to-charge ratio, ranging from 160 to 500 in increments of 20 (x-axis).
Figure 1.
Chromatogram (A) and mass spectra (B) of azoxystrobin biotransformation product azoxystrobin-acid.
Figures 2A to 2D are line graphs, plotting nanogram per milliliter, ranging from 0.0 to 1.5 in increments of 0.5; 0 to 15 in increments of 5 and 50 to 250 in increments of 50; 0.0 to 1.5 in increments of 0.5; and 0 to 15 in increments of 5 and 50 to 250 in increments of 50 (y-axis) across time (hours), ranging from 0 to 3 in unit increments and 3 to 24 in increments of 21 (x-axis) for control, 0.002 milligram per kilogram, 0.02 milligram per kilogram, and 2 milligrams per kilogram.
Figure 2.
Concentration of (A) azoxystrobin and (B) azoxystrobin-acid in mouse urine after oral administration of azoxystrobin at the indicated concentrations (n=12 per group, with 6 male and 6 female). Concentration of (C) azoxystrobin and (D) azoxystrobin-acid after treating urine samples with β-glucuronidase (n=12 per group, with 6 male and 6 female). Values were shown in Table S8 and S9. Results are expressed as means±SEM. *(p<0.05), **(p<0.01) indicate values significantly different from vehicle-treated controls. Analysis of variance followed by post hoc Dunnett’s test was performed to determine the statistical significance of the results. Note: SEM, standard error of the mean.
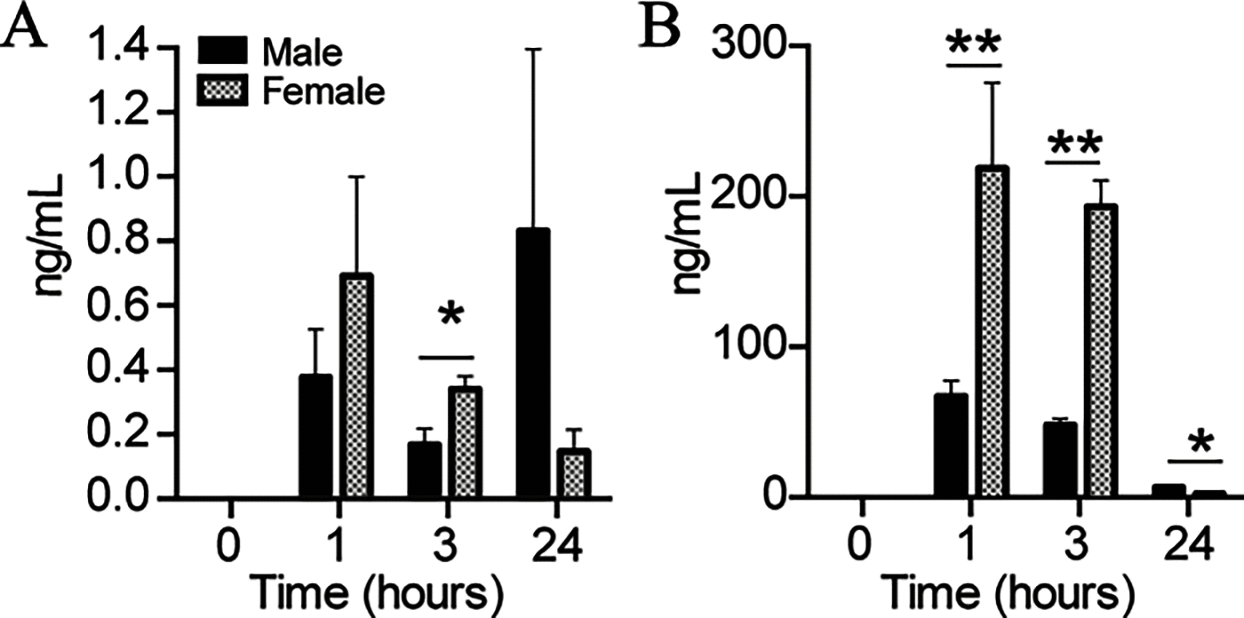
Figures 3A and 3B are bar graphs, plotting nanogram per milliliter, 0.0 to 1.4 in increments of 0.2 and 0 to 300 in increments of 100 (y-axis) across time (hours), ranging from 0 to 3 in unit increments and 3 to 24 in increments of 21 (x-axis) for male and female.
Figure 3.
Urine (A) azoxystrobin and (B) azoxystrobin-acid concentration separated by sex. Male (n=6) and female (n=6) mice were orally gavaged with 2mg/kg azoxystrobin and urine samples were treated with β-glucuronidase prior to analysis. Results are expressed as means±SEM. Data can be found in the “Results” section. * (p<0.05), ** (p<0.01) indicate values significantly different from vehicle-treated controls. Analysis of variance followed by post hoc Dunnett’s test was performed to determine the statistical significance of the results. Note: SEM, standard error of the mean.
Figure 4 is a line graph, plotting nanogram per milliliter, ranging from 0.0 to 1.0 in increments of 0.5 and 4.0 to 6.0 in increments of 0.5 (y-axis) across First and Second (x-axis).
Figure 4.
Urine azoxystrobin-acid concentration in children sampled twice (n=20). The second urine samples were collected 9–12 months after the first samples. Data can be found in Table S6.
Figures 5A to 5D are bar graphs, plotting Dam cortex (nanogram per gram), Embryo cortex (nanogram per gram), Placenta (nanogram per gram), and Cortex (nanogram per gram), ranging from 0 to 4 in unit increments (y-axis) across Control, Azoxystrobin, Control, and Azoxystrobin-acid; Control, Azoxystrobin, Control, and Azoxystrobin-acid; Control, Azoxystrobin, Control, and Azoxystrobin-acid; and Control, Azoxystrobin, Control, and Azoxystrobin (x-axis) for Dam and Pup.
Figure 5.
Concentration of azoxystrobin and azoxystrobin-acid in (A) dam (n=3/group) and (B) embryo’s brain (n=2123/group), and (C) placenta (n=2123/group) after dams were treated with 2mg/kg azoxystrobin from E0.5-E14.5 relative to vehicle-treated control group. (D) Concentration of azoxystrobin in pup’s brain via lactational exposure (n=1819/group) compared with the concentration of azoxystrobin in dam’s brain (n=4/group); dotted line represents the level of azoxystrobin in embryo’s brain shown in (B). Results are expressed as means±SEM. *(p<0.05), **(p<0.01) indicate values significantly different from vehicle-treated controls. Analysis of variance followed by post hoc Dunnett’s test was performed to determine the statistical significance of the results. Note: SEM, standard error of the mean.
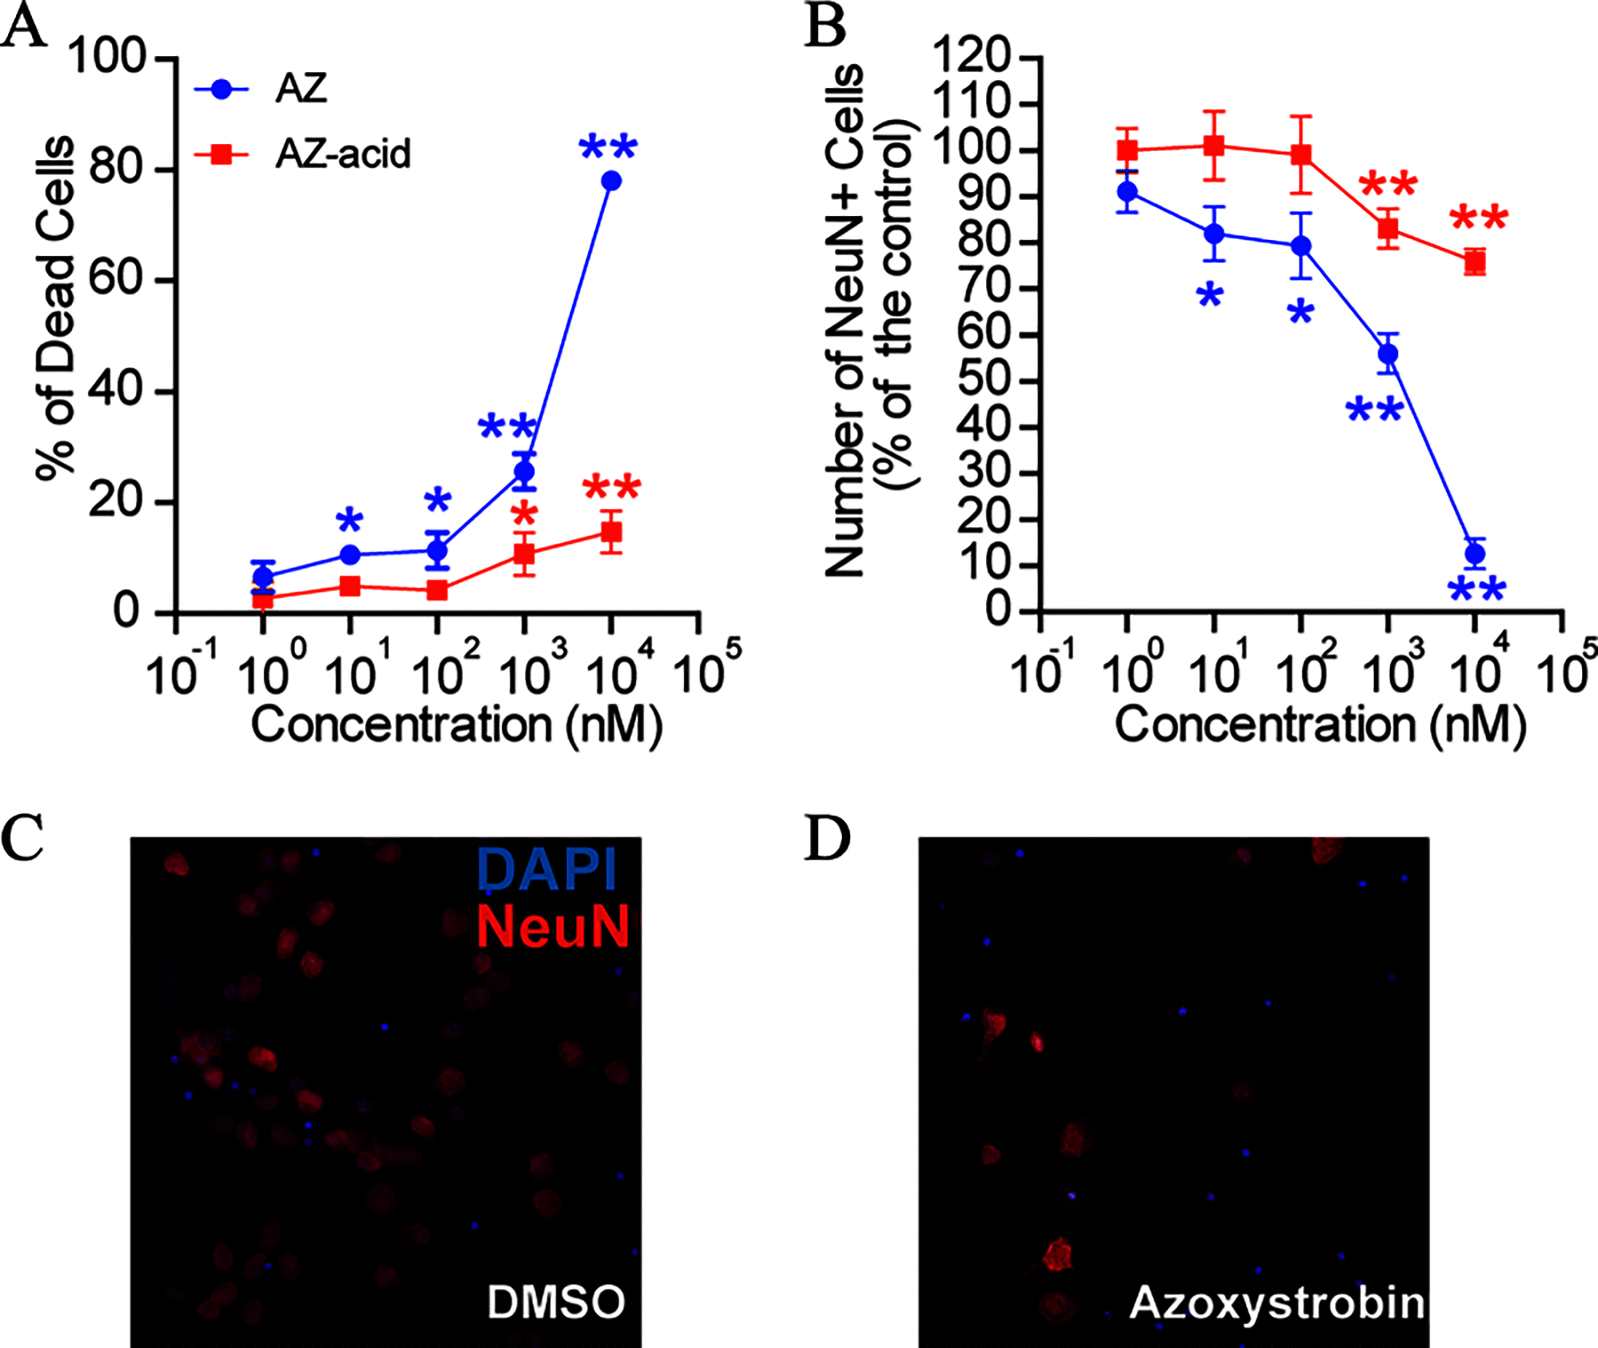
Figures 6A and 6B are line graphs, plotting percentage of dead cells, ranging from 0 to 100 in increments of 20 and Number of neuronal nuclear protein positive cells (percentage of the control), ranging from 0 to 120 in increments of 10 (y-axis) across concentration (nanomolar), ranging as 10 begin superscript negative 1 end superscript, 10 begin superscript 0 end superscript, 10 begin superscript 1 end superscript, 10 begin superscript 2 end superscript, 10 begin superscript 3 end superscript, 10 begin superscript 4 end superscript, and 10 begin superscript 5 end superscript (x-axis) for Azoxystrobin and Azoxystrobin-acid. Figures 6C and 6D are stained tissues of a mouse cortical neuron cultures treated by Dimethyl sulfoxide and Azoxystrobin depicting 4’,6-diamidino-2-phenylindole and neuronal nuclear protein, respectively.
Figure 6.
Cell death of cultured mouse cortical neurons following treatment with azoxystrobin and azoxystrobin-acid at the concentration of 1, 10, 100, 1,000, and 10,000 nM. (A) Percentage of dead cells based on SYTOX green labeling and (B) NeuN positive cells after treatment (for 7 d) with azoxystrobin or azoxystrobin-acid (vehicle-subtracted; the percentage of cell death in vehicle control group was 7.3%). (C, D) NeuN staining of mouse cortical neuron cultures treated with DMSO or 1,000 nM azoxystrobin. Values are means±SEM (n=4). Data can be found in “Results” section. *(p<0.05), **(p<0.01) indicate values significantly different from vehicle-treated controls. Analysis of variance followed by post hoc Dunnett’s test was performed to determine the statistical significance of the results. Note: SEM, standard error of the mean.

Similar articles

Cited by

References

    1. Antweiler RC, Taylor HE. 2008. Evaluation of statistical treatments of left-censored environmental data using coincident uncensored data sets: I. Summary statistics. Environ Sci Technol 42(10):3732–3738, PMID: , 10.1021/es071301c. - DOI - PubMed
    1. Ashrap P, Zheng G, Wan Y, Li T, Hu W, Li W, et al. . 2017. Discovery of a widespread metabolic pathway within and among phenolic xenobiotics. Proc Natl Acad Sci USA 114(23):6062–6067, PMID: , 10.1073/pnas.1700558114. - DOI - PMC - PubMed
    1. Bartlett DW, Clough JM, Godwin JR, Hall AA, Hamer M, Parr‐Dobrzanski B. 2002. The strobilurin fungicides. Pest management science: formerly. Pest Manag Sci 58(7):649–662, PMID: , 10.1002/ps.520. - DOI - PubMed
    1. Battaglin WA, Sandstrom MW, Kuivila KM, Kolpin DW, Meyer MT. 2011. Occurrence of azoxystrobin, propiconazole, and selected other fungicides in us streams, 2005–2006. Water Air Soil Pollut 218(1–4):307–322, 10.1007/s11270-010-0643-2. - DOI
    1. Cao F, Li H, Zhao F, Wu P, Qian L, Huang L, et al. . 2019. Parental exposure to azoxystrobin causes developmental effects and disrupts gene expression in f1 embryonic zebrafish (danio rerio). Sci Total Environ 646:595–605, PMID: , 10.1016/j.scitotenv.2018.07.331. - DOI - PubMed

Publication types

LinkOut - more resources