

Fluorine Effect in the Gelation Ability of Low Molecular Weight Gelators
- PMID: 35200480
- PMCID: PMC8871896
- DOI: 10.3390/gels8020098
Fluorine Effect in the Gelation Ability of Low Molecular Weight Gelators
Abstract
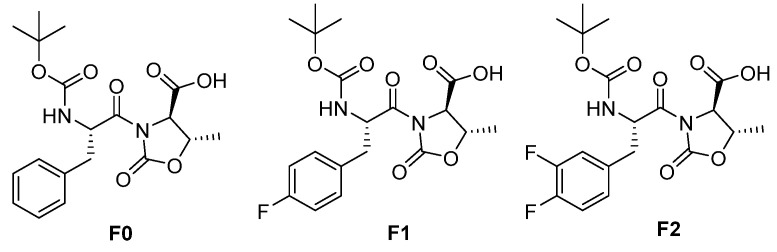
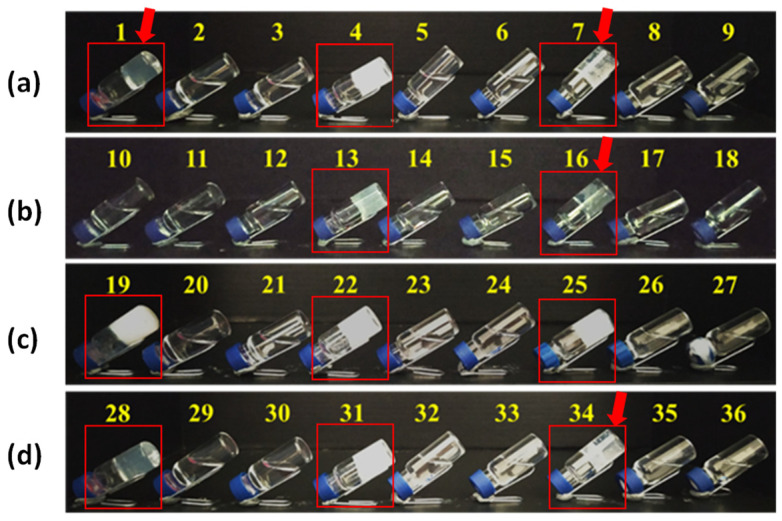
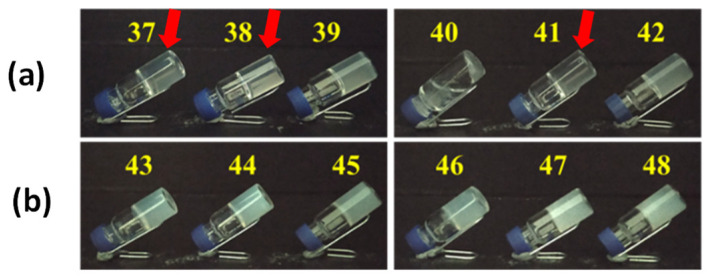
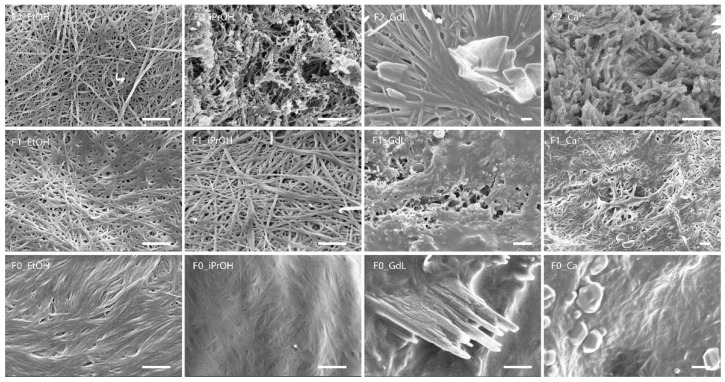
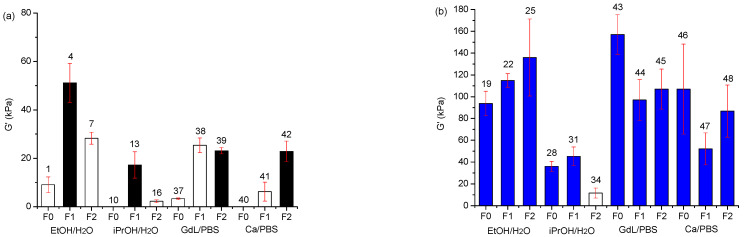
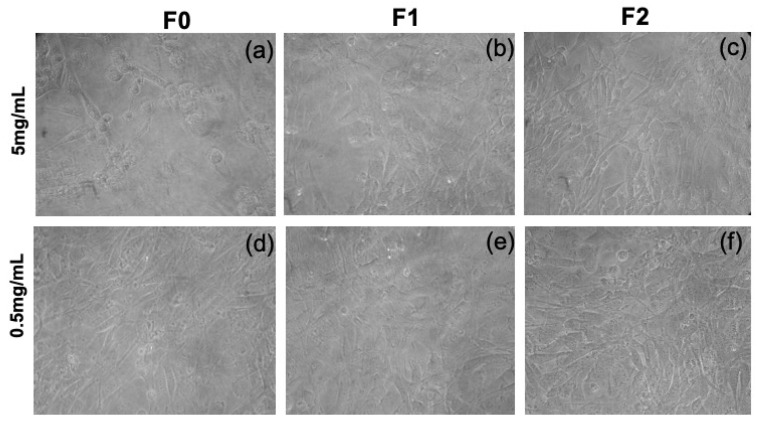
The three gelators presented in this work (Boc-D-Phe-L-Oxd-OH F0, Boc-D-F1Phe-L-Oxd-OH F1 and Boc-D-F2Phe-L-Oxd-OH F2) share the same scaffold and differ in the number of fluorine atoms linked to the aromatic ring of phenylalanine. They have been applied to the preparation of gels in 0.5% or 1.0% w/v concentration, using three methodologies: solvent switch, pH change and calcium ions addition. The general trend is an increased tendency to form structured materials from F0 to F1 and F2. This property ends up in the formation of stronger materials when fluorine atoms are present. Some samples, generally formed by F1 or F2 in 0.5% w/v concentration, show high transparency but low mechanical properties. Two gels, both containing fluorine atoms, show increased stiffness coupled with high transparency. The biocompatibility of the gelators was assessed exposing them to fibroblast cells and demonstrated that F1 and F2 are not toxic to cells even in high concentration, while F0 is not toxic to cells only in a low concentration. In conclusion, the presence of even only one fluorine atom improves all the gelators properties: the gelation ability of the compound, the rheological properties and the transparency of the final materials and the gelator biocompatibility.
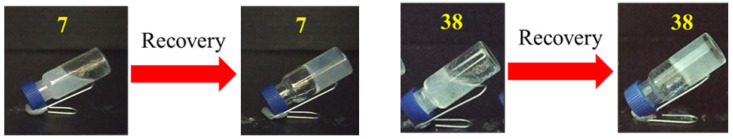
Keywords: fibers; fluorine atom; gelator; supramolecular gel; thixotropy; transparency.
Conflict of interest statement
The authors declare no conflict of interest.
Figures
Similar articles
-
Designing a Transparent and Fluorine Containing Hydrogel.Gels. 2021 Apr 8;7(2):43. doi: 10.3390/gels7020043. Gels. 2021. PMID: 33918097 Free PMC article.
-
The effect of l-DOPA hydroxyl groups on the formation of supramolecular hydrogels.Org Biomol Chem. 2017 Jul 21;15(27):5797-5804. doi: 10.1039/c7ob01026e. Epub 2017 Jun 29. Org Biomol Chem. 2017. PMID: 28660940
-
Understanding the gelation properties of the fluorophenyl glycosides of arabinoside gelators: experimental and theoretical studies.Soft Matter. 2024 Sep 18;20(36):7111-7121. doi: 10.1039/d4sm00521j. Soft Matter. 2024. PMID: 39041286
-
Supramolecular Assembly of Peptide and Metallopeptide Gelators and Their Stimuli-Responsive Properties in Biomedical Applications.Chemistry. 2018 Sep 25;24(54):14316-14328. doi: 10.1002/chem.201801247. Epub 2018 Jul 13. Chemistry. 2018. PMID: 29667727 Review.
-
Phenylalanine and derivatives as versatile low-molecular-weight gelators: design, structure and tailored function.Biomater Sci. 2017 Dec 19;6(1):38-59. doi: 10.1039/c7bm00882a. Biomater Sci. 2017. PMID: 29164186 Review.
Cited by
-
Phenylalanine-Based Amphiphilic Self-Assembled Materials: Gels or Crystals?Chemistry. 2025 Apr 22;31(23):e202404586. doi: 10.1002/chem.202404586. Epub 2025 Mar 17. Chemistry. 2025. PMID: 40047254 Free PMC article.
-
Controlled Hydrolysis of Odorants Schiff Bases in Low-Molecular-Weight Gels.Int J Mol Sci. 2022 Mar 13;23(6):3105. doi: 10.3390/ijms23063105. Int J Mol Sci. 2022. PMID: 35328526 Free PMC article.
-
Controlled Lactonization of o-Coumaric Esters Mediated by Supramolecular Gels.Gels. 2023 Apr 21;9(4):350. doi: 10.3390/gels9040350. Gels. 2023. PMID: 37102962 Free PMC article.
-
Transparent Organogels as a Medium for the Light-Induced Conversion from Spiropyran to Merocyanine.Gels. 2023 Nov 27;9(12):932. doi: 10.3390/gels9120932. Gels. 2023. PMID: 38131918 Free PMC article.
-
Solvent-Induced Transient Self-Assembly of Peptide Gels: Gelator-Solvent Reactions and Material Properties Correlation.Chem Mater. 2023 Dec 15;36(1):407-416. doi: 10.1021/acs.chemmater.3c02327. eCollection 2024 Jan 9. Chem Mater. 2023. PMID: 38222938 Free PMC article.
References
-
- Draper E.R., Adams D.J. Low-Molecular-Weight Gels: The State of the Art. Chem. 2017;3:390–410. doi: 10.1016/j.chempr.2017.07.012. - DOI
-
- Weiss R.G., Terech P. Molecular Gels: Materials with Self-Assembled Fibrillar Networks. Springer; Dordrecht, The Netherlands: 2006.
-
- Guenet J.-M. Organogels: Thermodynamics, Structure, Solvent Role and Properties. Springer International Publishing; New York, NY, USA: 2016. SpringerBriefs in Materials.
-
- Weiss R.G. In: Molecular Gels, Structure and Dynamics. Monograph in Supramolecular Chemistry. Weiss R.G., editor. The Royal Society of Chemistry; London, UK: 2018. Monographs in Supramolecular Chemistry.
-
- Hanabusa K., Suzuki M. Development of low-molecular-weight gelators and polymer-based gelators. Polym. J. 2014;46:776–782. doi: 10.1038/pj.2014.64. - DOI
LinkOut - more resources
Full Text Sources
Miscellaneous
