

Using Rheology to Understand Transient and Dynamic Gels
- PMID: 35200514
- PMCID: PMC8872063
- DOI: 10.3390/gels8020132
Using Rheology to Understand Transient and Dynamic Gels
Abstract
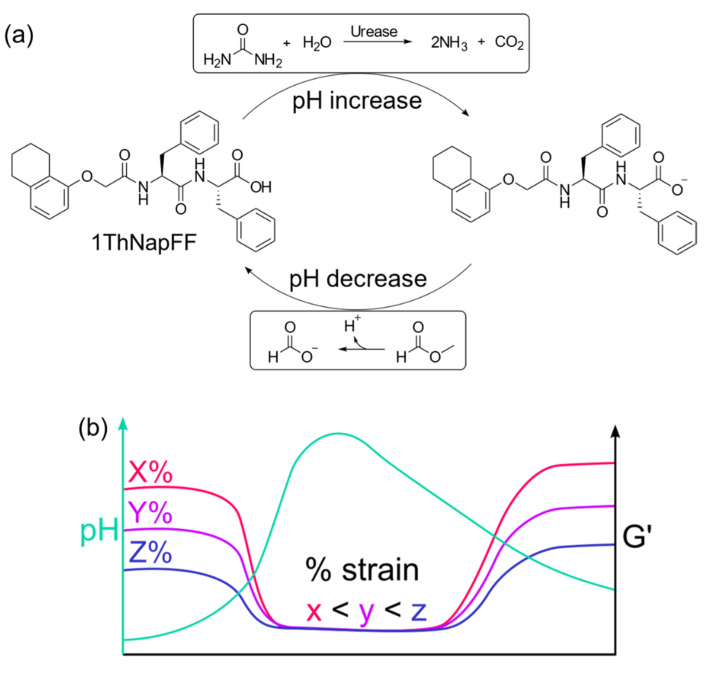
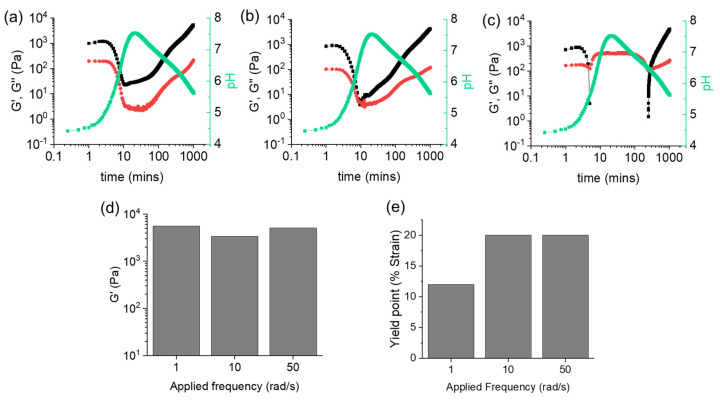
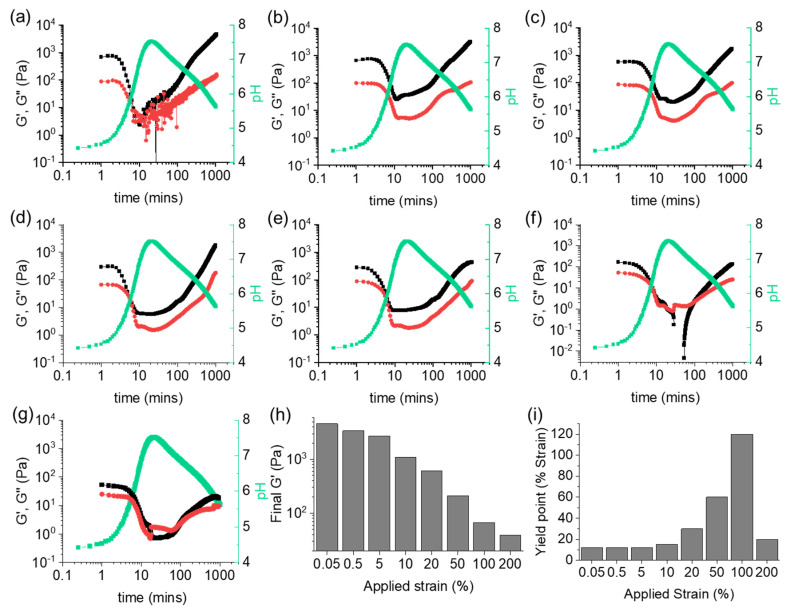
Supramolecular gels can be designed such that pre-determined changes in state occur. For example, systems that go from a solution (sol) state to a gel state and then back to a sol state can be prepared using chemical processes to control the onset and duration of each change of state. Based on this, more complex systems such as gel-to-sol-to-gel and gel-to-gel-to-gel systems can be designed. Here, we show that we can provide additional insights into such systems by using rheological measurements at varying values of frequency or strain during the evolution of the systems. Since the different states are affected to different degrees by the frequency and/or strain applied, this allows us to better understand and follow the changes in state in such systems.
Keywords: dissipative; dynamic; gel; rheology; transient.
Conflict of interest statement
The authors declare no conflict of interest.
Figures

Similar articles
-
Synergistic gelation of xanthan gum with locust bean gum: a rheological investigation.Glycoconj J. 1997 Dec;14(8):951-61. doi: 10.1023/a:1018523029030. Glycoconj J. 1997. PMID: 9486428
-
Effect of ionic liquid on sol-gel phase transition, kinetics and rheological properties of high amylose starch.Int J Biol Macromol. 2020 Nov 1;162:685-692. doi: 10.1016/j.ijbiomac.2020.06.186. Epub 2020 Jun 22. Int J Biol Macromol. 2020. PMID: 32585271
-
Gel--sol transition in kappa-carrageenan systems: microviscosity of hydrophobic microdomains, dynamic rheology and molecular conformation.Int J Biol Macromol. 1999 Oct;26(1):69-76. doi: 10.1016/s0141-8130(99)00065-3. Int J Biol Macromol. 1999. PMID: 10520958
-
Vaginal gel drug delivery systems: understanding rheological characteristics and performance.Expert Opin Drug Deliv. 2011 Oct;8(10):1309-22. doi: 10.1517/17425247.2011.600119. Epub 2011 Jul 5. Expert Opin Drug Deliv. 2011. PMID: 21728886 Review.
-
Structure and rheology of colloidal particle gels: insight from computer simulation.Adv Colloid Interface Sci. 2013 Nov;199-200:114-27. doi: 10.1016/j.cis.2013.07.002. Epub 2013 Jul 18. Adv Colloid Interface Sci. 2013. PMID: 23916723 Review.
Cited by
-
3,4-Ethylenedioxythiophene Hydrogels: Relating Structure and Charge Transport in Supramolecular Gels.Chem Mater. 2024 Mar 25;36(7):3092-3106. doi: 10.1021/acs.chemmater.3c01360. eCollection 2024 Apr 9. Chem Mater. 2024. PMID: 38617802 Free PMC article.
-
Rheological Considerations of Pharmaceutical Formulations: Focus on Viscoelasticity.Gels. 2023 Jun 7;9(6):469. doi: 10.3390/gels9060469. Gels. 2023. PMID: 37367140 Free PMC article. Review.
-
Forging out-of-equilibrium supramolecular gels.Nat Synth. 2024;3(12):1481-1489. doi: 10.1038/s44160-024-00623-4. Epub 2024 Sep 6. Nat Synth. 2024. PMID: 39664796 Free PMC article.
-
Hydrocolloids of Egg White and Gelatin as a Platform for Hydrogel-Based Tissue Engineering.Gels. 2023 Jun 20;9(6):505. doi: 10.3390/gels9060505. Gels. 2023. PMID: 37367175 Free PMC article.
-
Effect of α-Amylase on the Structure of Chia Seed Mucilage.Biomimetics (Basel). 2022 Sep 23;7(4):141. doi: 10.3390/biomimetics7040141. Biomimetics (Basel). 2022. PMID: 36278698 Free PMC article.
References
-
- Wang Q., Qi Z., Chen M., Qu D.-H. Out-of-equilibrium supramolecular self-assembling systems driven by chemical fuel. Aggregate. 2021;2:e110. doi: 10.1002/agt2.110. - DOI
-
- Rieß B., Grötsch R.K., Boekhoven J. The Design of Dissipative Molecular Assemblies Driven by Chemical Reaction Cycles. Chem. 2020;6:552–578. doi: 10.1016/j.chempr.2019.11.008. - DOI
LinkOut - more resources
Full Text Sources
