Review
. 2022 Jan 30;29(2):698-723.
doi: 10.3390/curroncol29020061.

Imaging Spectrum of Intrahepatic Mass-Forming Cholangiocarcinoma and Its Mimickers: How to Differentiate Them Using MRI

Affiliations
Review

Imaging Spectrum of Intrahepatic Mass-Forming Cholangiocarcinoma and Its Mimickers: How to Differentiate Them Using MRI

Jelena Djokic Kovač et al. Curr Oncol. .

Abstract

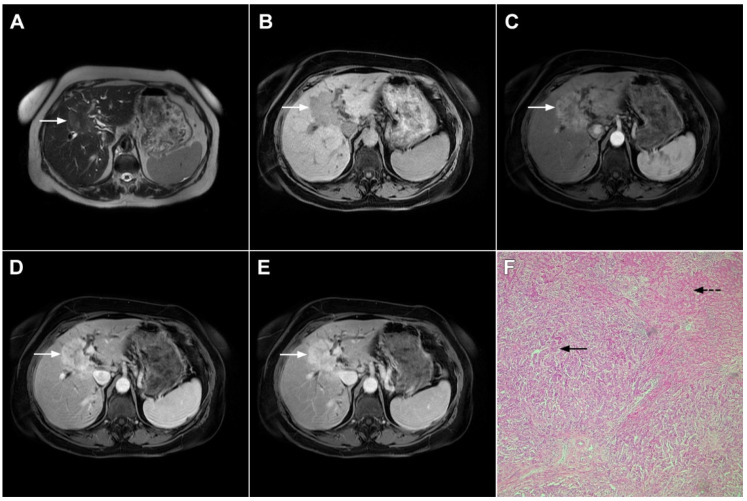
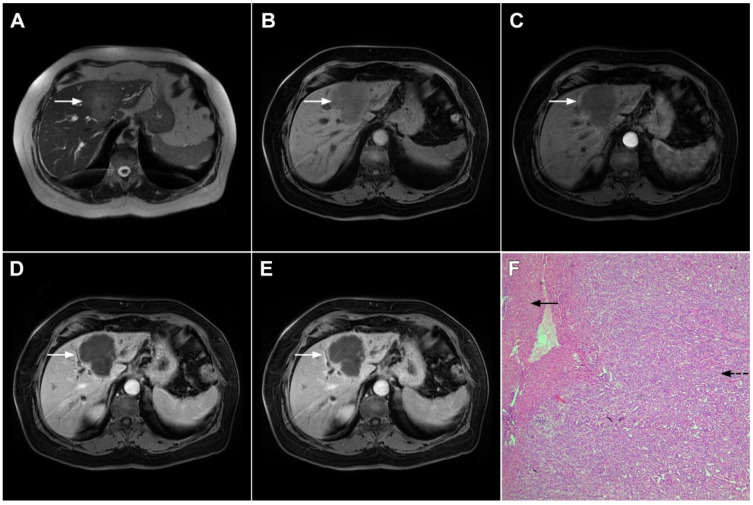
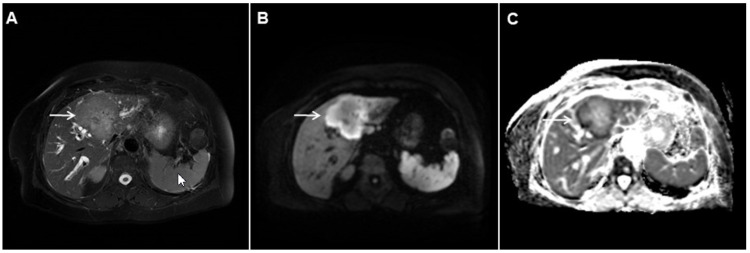
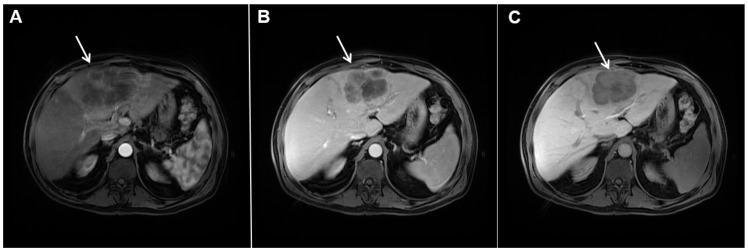
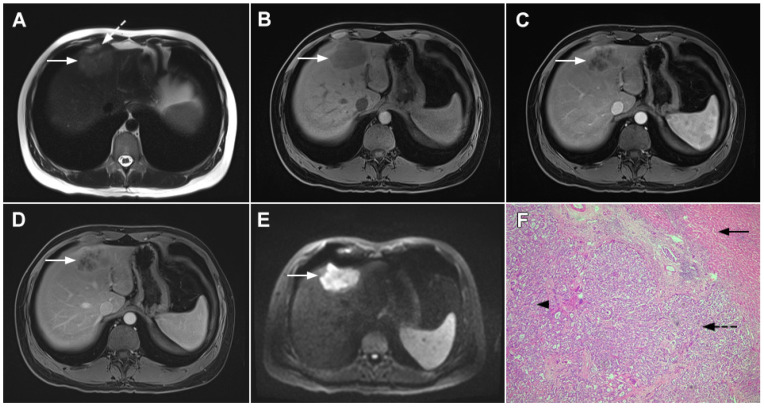
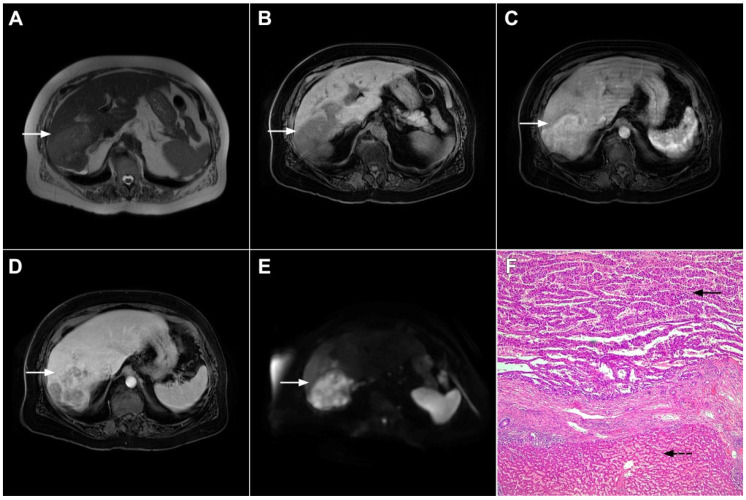
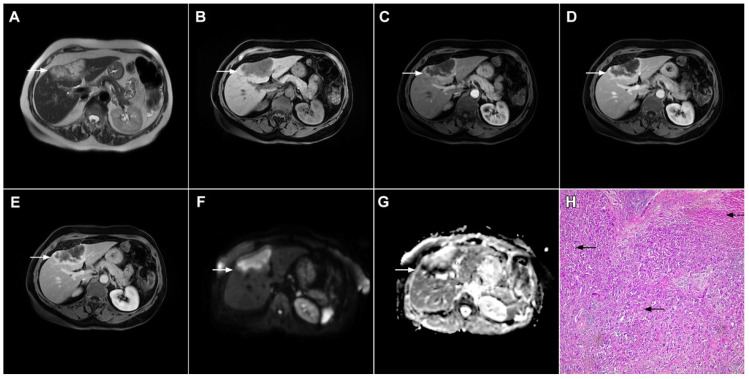
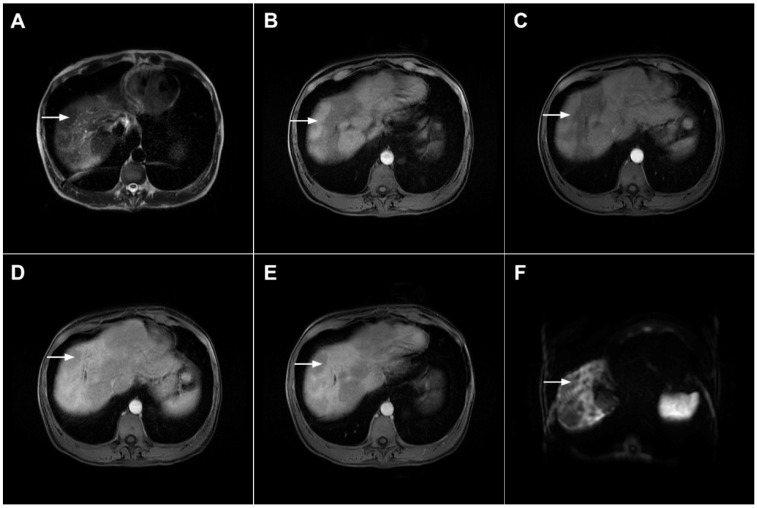
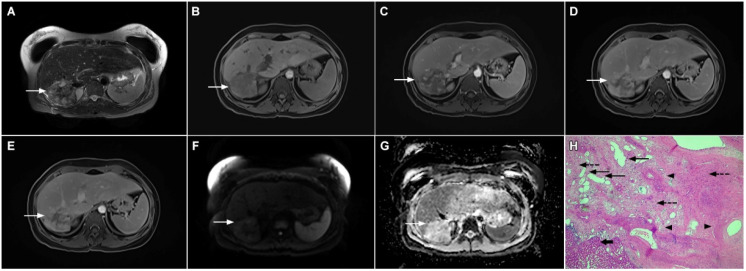
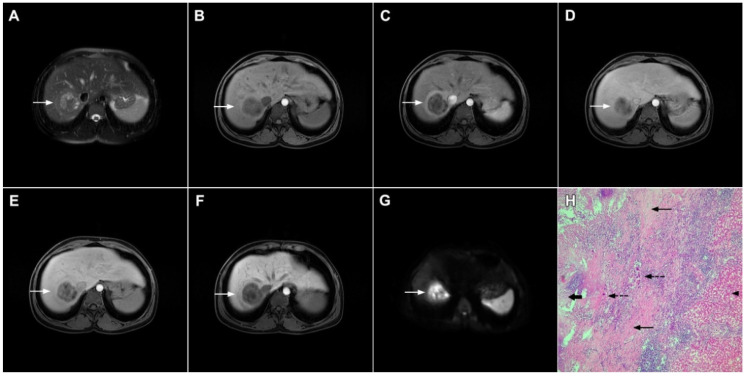
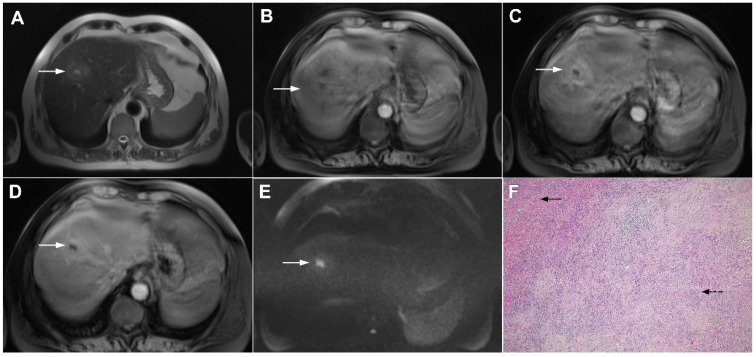
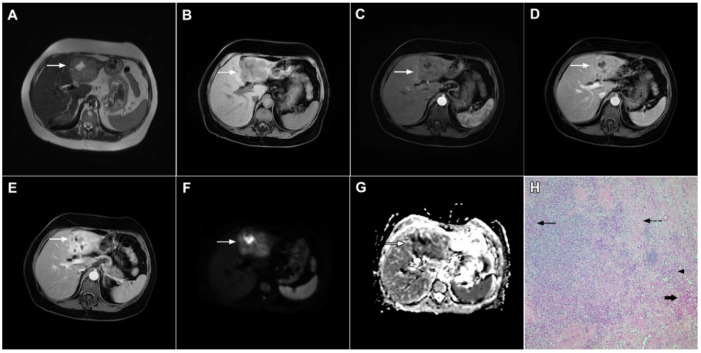
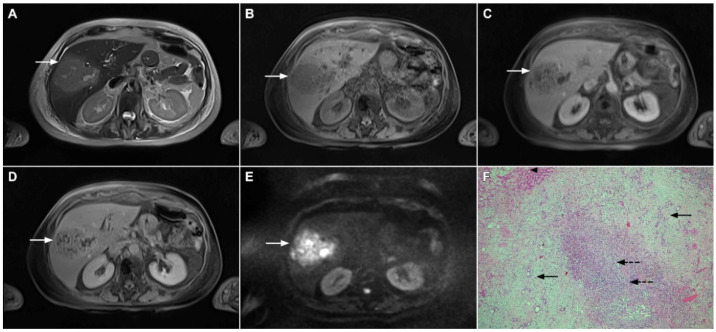
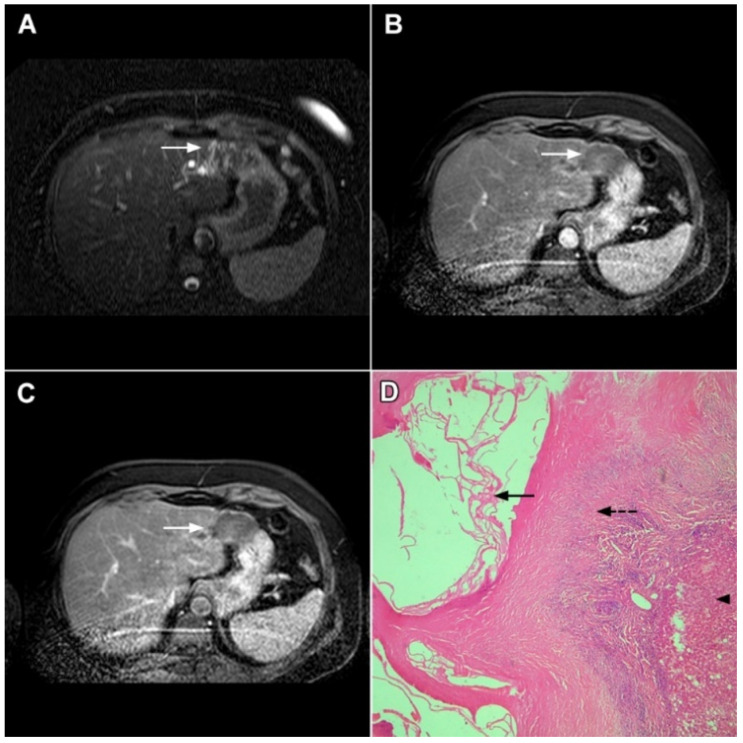
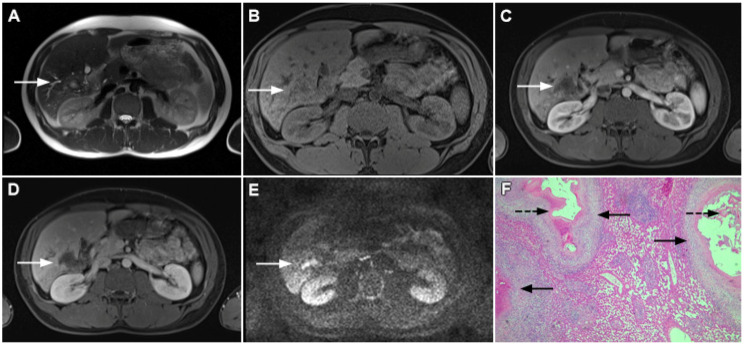
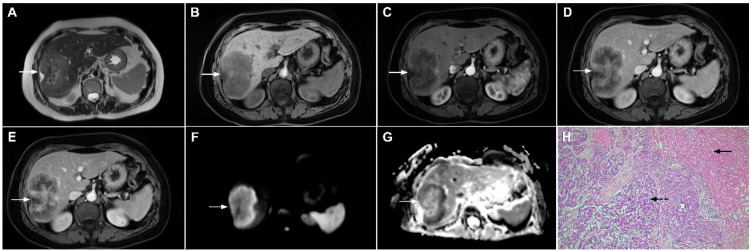
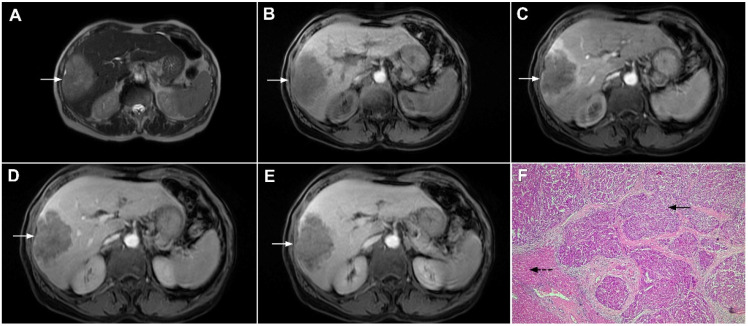
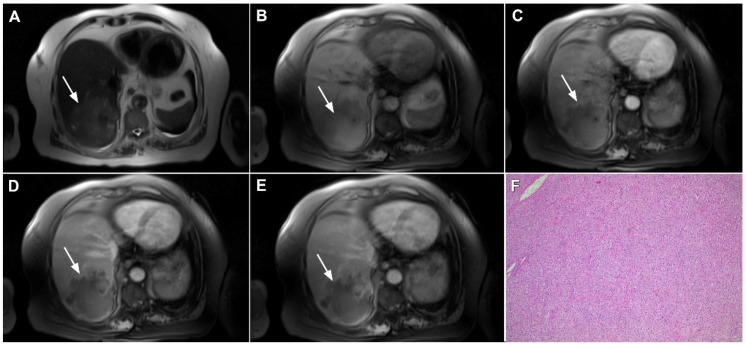
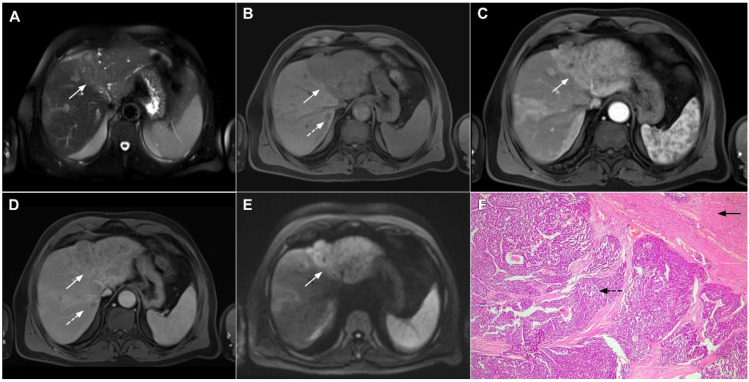
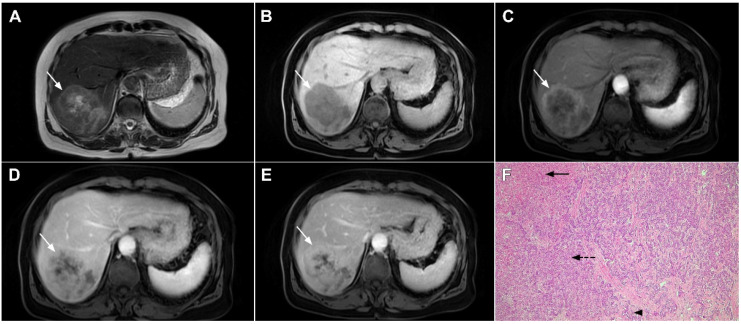
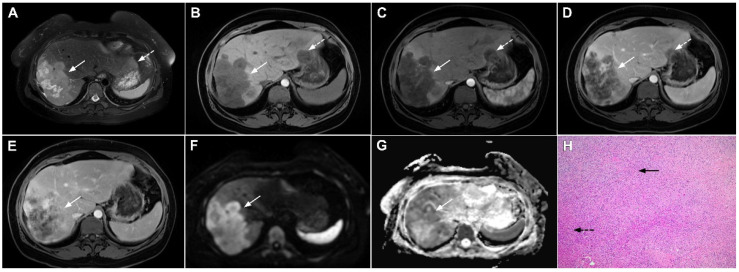
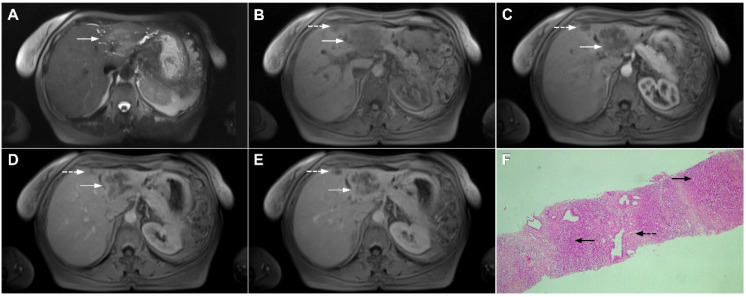
Intrahepatic cholangiocarcinoma (ICC) is the second most common primary hepatic malignancy, with mass-forming growth pattern being the most common. The typical imaging appearance of mass-forming ICC (mICC) consists of irregular ring enhancement in the arterial phase followed by the progressive central enhancement on portal venous and delayed phases. However, atypical imaging presentation in the form of hypervascular mICC might also be seen, which can be attributed to distinct pathological characteristics. Ancillary imaging features such as lobular shape, capsular retraction, segmental biliary dilatation, and vascular encasement favor the diagnosis of mICC. Nevertheless, these radiological findings may also be present in certain benign conditions such as focal confluent fibrosis, sclerosing hemangioma, organizing hepatic abscess, or the pseudosolid form of hydatid disease. In addition, a few malignant lesions including primary liver lymphoma, hemangioendothelioma, solitary hypovascular liver metastases, and atypical forms of hepatocellular carcinoma (HCC), such as scirrhous HCC, infiltrative HCC, and poorly differentiated HCC, may also pose a diagnostic dilemma by simulating mICC in imaging studies. Diffusion-weighted imaging and the use of hepatobiliary contrast agents might be helpful for differential diagnosis in certain cases. The aim of this manuscript is to provide a comprehensive overview of mICC imaging features and to describe useful tips for differential diagnosis with its potential mimickers.

Keywords: magnetic resonance imaging; mass-forming cholangiocarcinoma; mimickers.


Conflict of interest statement

The authors declare no conflict of interest.

Figures

Figure 1
Figure 1
Typical intrahepatic mass-forming cholangiocarcinoma in 68-year-old woman. On axial T2-weighted image a lobular heterogeneously hyperintense tumor (arrow) is seen, located centrally in the liver segment IVB (A). The lesion (arrow) is hypointense in a plain T1-weighted image (B) with irregular ring enhancements in the arterial phase (C) and progressive enhancement in the portalvenous (D) and delayed phase (E). Note the perilesional biliary dilatation. Hematoxylin and eosin (H&E) staining (F) showed cholangiocarcinoma (arrow) and normal liver parenchyma next to the tumor (dashed arrow); original magnification ×40.
Figure 2
Figure 2
Mass-forming intrahepatic cholangiocarcinoma in 72-year-old man. Irregular heterogeneously hyperintense lesion (arrow) on T2-weighted image (A) located in liver segments IVB and III with peripheral biliary dilatation is shown. On a plain T1-weighted image (B) the lesion (arrow) is hypointense with only discrete ring enhancement in the arterial phase (C) but without detectable enhancements in the portal venous (D) and delayed phases (E). Hematoxylin and eosin (H&E) staining (F) showed poorly differentiated cholangiocarcinoma (dashed arrow); normal liver parenchyma is also shown (arrow); original magnification ×40.
Figure 3
Figure 3
Mass-forming intrahepatic cholangiocarcinoma in the left liver lobe of a 76-year-old man. Axial T2-weighted FS image shows lobulated hetrogeneously hyperintense hepatic tumor (arrow) with perilesional biliary dilatation (A). Axial diffusion-weighted image (b = 800 s/mm2) shows target-like appearance (arrow) of the lesion that consists of a central darker area and a peripheral hyperintense area (B). Corresponding ADC map is shown on (C).
Figure 4
Figure 4
Mass-forming intrahepatic cholangiocarcinoma in a 68-year-old woman. Axial T1-weighted image after gadoxetic acid administration obtained in arterial phase (A) shows peripherally enhancing lesion (arrow). Portal venous phase in the same patient (B) shows progressive centripetal enhancement of the lesion (arrow) with cloud-like appearance in the hepatobiliary phase (C) consisting of an area of central enhancement and a thin, peripheral, hypointense rim.
Figure 5
Figure 5
Parenchymal mass-forming cholangiocarcinoma in a 36-year-old man. The lobular slightly hyperintense lesion (arrow) is seen in the liver segment IVA in a T2-weighted image (A) with subtle capsular retraction (dashed arrow). On a plain T1-weighted image (B), the tumor (arrow) is hypointense with irregular discrete peripheral and central enhancements in the arterial phase (C), mild progressive enhancement in the portal venous phase (D), and high signal intensity in DWI (E). Hematoxylin and eosin (H&E) staining (F) showed cholangiocarcinoma (arrowhead) with poorly differentiated components (dashed arrow). Normal liver parenchyma is also shown (arrow); original magnification ×40.
Figure 6
Figure 6
Hypervascular mass-forming cholangiocarcinoma in a 63-year-old woman. The axial T2-weighted image (A) shows a moderately hyperintense tumor (arrow) located in liver segments VI and VII with a subtle medial capsular retraction. The lesion (arrow) is hypointense on the plain T1-weighted image (B), hypervascular in the arterial phase (C) with washout on the portal venous phase (D). The tumor (arrow) is hyperintense on DWI (E). Hematoxylin and eosin (H&E) staining (F) showed well-differentiated cholangiocarcinoma (arrow) surrounded by normal liver parenchyma (dashed arrow); original magnification ×40.
Figure 7
Figure 7
Mucin-rich mass-forming cholangiocarcinoma in a 78-year-old woman. The axial T2-weighted image (A) shows the lobulated hyperintense lesion (arrow) located in the subcapsular region of liver segment IVB, which is associated with capsular retraction. On the plain T1-weighted image (B) the lesion (arrow) is hypointense. In the arterial phase (C), ring enhancement can be seen with slight “ragged” central enhancement in the portal venous (D) and delayed phase (E). On DWI, diffusion restriction is noted on the periphery of the lesion (arrow) while no restriction is seen in the central part of the tumor (F). Corresponding ADC map showing targetoid appearance of the lesion is shown on (G). Hematoxylin and eosin (H&E) staining (H) showed cholangiocarcinoma (arrows) adjacent to normal liver parenchyma (dashed arrow); original magnification ×40.
Figure 8
Figure 8
Focal confluent fibrosis in a 42-year-old man with long-standing primary sclerosing cholangitis. The T2-weighted image (A) shows a band like a slightly hyperintense lesion (arrow) at the dome of the liver. On the plain T1-weighted image (B) the lesion (arrow) is hypointense without arterial vascularity (C) while homogeneous progressive enhancement is seen in the portal venous (D) and delayed phases (E). The lesion (arrow) shows high signal intensity in DWI (F).
Figure 9
Figure 9
Sclerosing hemangioma in a 39-year-old woman. On T2-weighted, fat-suppressed image (A) a heterogeneous lesion (arrow) is located in liver segment VII and the upper part of segment VI is shown. Note both hyperintense and hypointese intermingled areas inside the lesion. On the plain T1-weighted image (B), the lesion is hypointense (arrow) with small, patchy areas of intense enhancement in the arterial phase (C), which enlarge in the portal venous (D) and delayed phases (E). The lesion (arrow) does not show diffusion restriction (F) and has high signal intensity in the corresponding ADC map (G). Hematoxylin and eosin (H&E) staining (H) showed sclerosing hemangioma containing multiple small blood vessels with thin walls (thin arrows), blood vessels with thick walls (arrowheads), and areas of fibrosis and sclerosis (dashed arrows). Liver parenchyma is also shown (thick arrow); original magnification ×40.
Figure 10
Figure 10
Inflammatory pseudotumor in a 38-year-old woman. On T2-weighted fat-suppressed image (A), a round lesion (arrow) is seen in the central part of liver segment VII. An isointense rind surrounding the heterogeneous central part of the lesion can be noted. The lesion (arrow) is hypointense in a plain T1-weighted image (B) with enhanced rims in the arterial phase (C). In the portal–venous (D) and delayed phases (E), slight progressive central enhancement is seen without washout on the periphery of the lesion. In the hepatobiliary phase, the lesion (arrow) is hypointense centrally while the peripheral rim is isointense with the surrounding liver parenchyma (F). The lesion (arrow) shows high signal intensity on DWI (G). Hematoxylin and eosin (H&E) staining (H) showed inflammatory pseudotumor with foreign body giant cells and Langerhans cells (dashed arrows); foci of necrosis (thick arrow) surrounded by fibro-inflammatory capsule (thin arrows). Normal liver parenchyma is also seen (arrowhead); original magnification ×40 (H).
Figure 11
Figure 11
Inflammatory pseudotumor in a 68-year-old man. In the T2-weighted image (A), a round lesion (arrow) is seen in the central part of the liver segment VIII. A central necrotic area can be seen surrounded by an irregular rim, which is isointense in the plain T1-weighted image (B), well-vascularized in the arterial phase (C), and has a persistent enhancement in the portal–venous phase (D). In the DWI, only the central necrotic part (arrow) shows high signal intensity, while the peripheral rim is isointense with the surrounding liver parenchyma (E). Hematoxylin and eosin (H&E) staining (F) showed inflammatory pseudotumors rich with myofibroblasts and inflammatory cells (dashed arrow). The normal liver parenchyma is also marked (arrow); original magnification ×40 (F).
Figure 12
Figure 12
Solid organizing liver abscess in a 44-year-old woman. A T2-weighted slightly hyperintense lesion (arrow) is seen in liver segment III (A). Note the intralesional, eccentrically located hyperintense area representing necrosis. The lesion (arrow) is hypointense in the plain T1-weighted image (B) with a subtle enhancement in the arterial phase (C) and progressive opacification in the portal venous (D) and delayed phases (E). In the DWI, the lesion (arrow) shows mild diffusion restriction except the small area representing necrosis, which displays high signal intensity (F). The corresponding ADC map is shown in (G). Hematoxylin and eosin (H&E) staining (H) showed a solid organizing liver abscess with purulent absceding inflammation (thin arrow), a hyalinized acellular fibrous capsule (dashed arrow), and multiplied biliary ductules (arrowhead). Normal liver parenchyma is also shown (thick arrow); original magnification ×40.
Figure 13
Figure 13
Focal chronic liver abscess in a 77-year-old woman. In the T2-weighted image (A), a mildly hypertentense lesion (arrow) is seen in liver segment V. Note also a few intralesional foci of high signal intensity representing necrosis. The lesion (arrow) is hypointense in the plain T1-weighted image (B) with subtle reticular internal opacification in the late arterial phase (C) and progressive enhancement in the portal venous phase (D). In the DWI (E), the lesion (arrow) shows high signal intensity with internal spots of very high signal intensity corresponding to necrosis. Hematoxylin and eosin (H&E) staining (F) showed a solid organizing liver abscess with foci of necrosis (dashed arrows) and reactive ductal hyperplasia (arrows) surrounded by normal liver parenchyma (arrowhead); original magnification ×40.
Figure 14
Figure 14
Solid-appearing liver echinococcosis in a 54-year-old woman. An axial T2-weighted FS image (A) shows a heterogeneous liver lesion (arrow) in liver segment II with internal hypointense areas. A slight biliary dilatation adjacent to the lesion can also be seen. The lesion (arrow) is hypointense in the arterial phase (B) and remains hypointense in the portal venous phase (C), simulating a hypovascular liver tumor. Hematoxylin and eosin (H&E) staining (D) showed an echinococcal cyst with germinative membranes (arrow) and the thick hyalinized wall of the cyst (dashed arrow) surrounded by normal liver parenchyma (arrowhead); original magnification ×40.
Figure 15
Figure 15
Alveolar echinoccosis in a 31-year-old man. An irregularly shaped lesion (arrow) is seen in liver segment VI, presenting as heterogeneously slightly hyperintense in the axial T2-weighted image (A) and hypointense in the plain T1-weighted image (B). Note the perilesional biliary dilatation. No enhancement is detected in the central part of the lesion (arrow), while there is subtle enhancement in the posteromedial part of the lesion in the arterial (C) and portal venous phases (D). The lesion does not show restricted diffusion (E). Hematoxylin and eosin (H&E) staining showed alveolar echinococcosis with multiple multilocular cysts (arrows) and hydatid membranes (dashed arrows) (F); original magnification ×40.
Figure 16
Figure 16
Solitary hypovascular liver metastasis in a 59-year-old woman. A slightly hyperintense lobulated lesion (arrow) with capsular retraction is seen in liver segments VI and VII in the T2-weighted image (A). The tumor (arrow) is hypointense in the plain T1-weighted image (B) with a slight peripheral enhancement in the arterial phase (C) and a progressive central enhancement in the portal venous (D) and delayed phases (E). In the DWI (F) and corresponding ADC map (G), the tumor (arrow) shows targetoid appearance. Hematoxylin and eosin (H&E) staining showed well-differentiated adenocarcinoma cells of intestinal type (dashed arrow), and normal liver parenchyma adjacent to the metastasis (arrow); original magnification ×40 (H).
Figure 17
Figure 17
Scirrhous hepatocellular carcinoma in a 68-year-old woman. The axial T2-weighted image (A) shows a moderately hyperintense subcapsular-located lesion in liver segments VI and V (arrow). Note also the capsular retraction. The tumor (arrow) is hypointense in the plain T1-weighted FS image (B), with ring enhancement in the arterial phase (C) and slight progressive central enhancement in the portal venous (D) and delayed phases (E). Hematoxylin and eosin (H&E) staining showed hepatocellular carcinoma (arrow) and normal liver parenchyma adjacent to the tumor (dashed arrow); original magnification ×40 (F).
Figure 18
Figure 18
Poorly differentiated hepatocellular carcinoma in a 69-year-old man. The axial T2-weighted image (A) shows a moderately hyperintense lesion (arrow) in liver segment VII. On plain T1-weighted image (B), the tumor (arrow) shows central hyperintensity and peripheral hypointensity, with only a slight ring enhancement in the arterial phase (C). The tumor (arrow) remains centrally hypointense in the portal venous (D) and delayed phases (E) with irregular nodular peripheral enhancement. Hematoxylin and eosin (H&E) staining showed poorly differentiated HCC; original magnification ×40 (F).
Figure 19
Figure 19
Infiltrative hepatocellular carcinoma in a 73-year-old man. The axial T2-weighted FS image (A) shows an ill-defined mass occupying the left liver lobe (arrow). Note the intratumoral biliary dilatation. The tumor (arrow) is hypointense in the plain T1-weighted image (B) and hypervascular in the arterial phase (C) with heterogeneous washout in the portal venous phase (D). In the DWI (E), the lesion (arrow) shows high signal intensity. Note also the small tumor nodule (dashed arrow) in the apical part of liver segment VII in (B,D). Hematoxylin and eosin (H&E) staining showed moderately-differentiated hepatocellular carcinoma (dashed arrow) and normal liver tissue next to the tumor (arrow); original magnification ×40 (F).
Figure 20
Figure 20
Combined hepatocellular–cholangiocarcinoma in a 59-year-old woman. In the T2-weighted image (A) a large tumor (arrow) with heterogeneously mildly increased signal intensity is seen in liver segment VII. The tumor (arrow) is hypointense in the plain T1-weighted image (B) with intense rim enhancement on the arterial phase (C), which gradually progresses centrally in the portal venous (D) and delayed phases (E). Hematoxylin and eosin (H&E) staining showed cells of hepatocellular differentiation (dashed arrow) and smaller zones of cholangiocellular differentiation (arrowhead). Normal liver parenchyma is also shown (arrow); original magnification ×40 (F).
Figure 21
Figure 21
Hepatic hemangioendothelioma in a 44-year-old woman. The axial T2-weighted FS image (A) shows a heterogeneously hyperintense lesion (arrow) in liver segment VII, which is causing a slight capsular retraction. In the plain T1-weighted image (B), the tumor is hypointense. Another smaller lesion is also seen in liver segment II (dashed arrow). After administration of intravenous contrast media, there is only subtle perilesional enhancement in the arterial phase (C) with a gradual centripetal enhancement in the portal venous (D) and delayed phases (E). The tumor (arrow) shows high signal intensity in the DWI (F) with low ADC values on the periphery in the corresponding ADC map (G). Hematoxylin and eosin (H&E) staining showed epithelioid hemangioendothelioma (arrows). Normal liver parenchyma is also shown (dashed arrow); original magnification ×40 (H).
Figure 22
Figure 22
Primary hepatic lymphoma in a 72-year-old woman. The axial T2-weighted FS image (A) shows a moderately hyperintense lesion in liver segment II (arrow). Note also the biliary dilatation on the periphery of the lesion. In the plain T1-weighted image (B), the tumor (arrow) is hypointense with a slight enhancement in the arterial phase (C) and progressive central opacification in the portal venous (D) and delayed phases (E). A small satellite lesion is also seen (dashed arrow) in (BE). Hematoxylin and eosin (H&E) staining showed non-Hodgkin liver lymphoma with T-cell histocyte-rich large B-cells (arrows). Remnants of biliary ductules are also shown (dashed arrow); original magnification ×40 (F).

Similar articles

Cited by

References

    1. Choi B.I., Lee J.M., Han J.K. Imaging of intrahepatic and hilar cholangiocarcinoma. Abdom. Imaging. 2004;29:548–557. doi: 10.1007/s00261-004-0188-1. - DOI - PubMed
    1. Lazaridis K.N., Gores G.J. Cholangiocarcinoma. Gastroenterology. 2005;128:1655–1667. doi: 10.1053/j.gastro.2005.03.040. - DOI - PubMed
    1. Shaib Y.H., El-Serag H.B., Nooka A.K., Thomas M., Brown T.D., Patt Y.Z., Hassan M.M. Risk factors for intrahepatic and extrahepatic cholangiocarcinoma: A hospital-based case-control study. Am. J. Gastroenterol. 2007;102:1016–1021. doi: 10.1111/j.1572-0241.2007.01104.x. - DOI - PubMed
    1. El-Diwany R., Pawlik T.M., Ejaz A. Intrahepatic Cholangiocarcinoma. Surg. Oncol. Clin. N. Am. 2019;28:587–599. doi: 10.1016/j.soc.2019.06.002. - DOI - PubMed
    1. Lim J.H. Cholangiocarcinoma: Morphologic classification according to growth pattern and imaging findings. AJR Am. J. Roentgenol. 2003;181:819–827. doi: 10.2214/ajr.181.3.1810819. - DOI - PubMed

MeSH terms