. 2022 Feb 2;29(2):837-847.
doi: 10.3390/curroncol29020071.

Diffusion-Weighted MRI in Patients with Testicular Tumors-Intra- and Interobserver Variability

Affiliations

Diffusion-Weighted MRI in Patients with Testicular Tumors-Intra- and Interobserver Variability

Malene Roland Vils Pedersen et al. Curr Oncol. .

Abstract

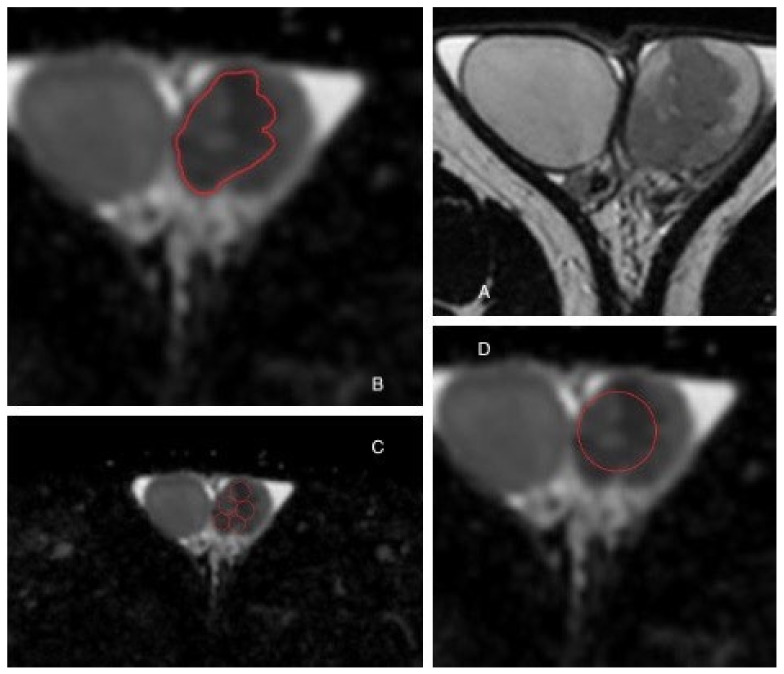
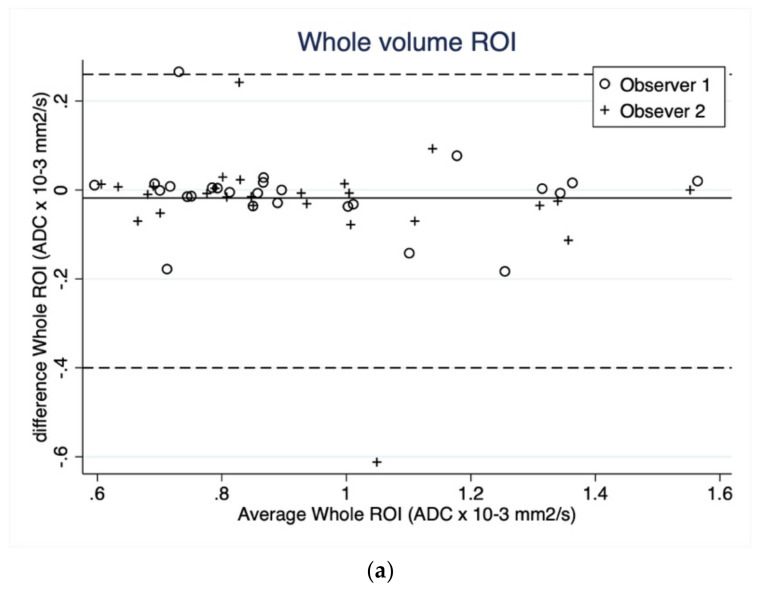
In general, magnetic resonance (MR) diffusion-weighted imaging (DWI) has shown potential in clinical settings. In testicles parenchyma, the DW imaging helps differentiate and characterize benign from malignant lesions. Placement and size of the region of interest (ROI) may affect the ADC value. Therefore, the aim of this study was to investigate the intra- and interobserver variability in testicular tumors when measuring ADC using various types of regions of interest (ROI). Two observers performed the ADC measurements in testicular lesions based on three ROI methods: (1) whole volume, (2) round, and (3) small sample groups. Intra- and interobserver variability was analyzed for all ROI methods using intraclass correlation coefficients (ICC) and bland-altman plots. The two observers performed the measurements twice, three months apart. A total of 26 malignant testicle tumors were included. Interobserver agreement was excellent in tumor length (ICC = 0.98) and tumor width (ICC = 0.98). In addition, intraobserver agreement was excellent in tumor length (ICC = 0.98) and tumor width (ICC = 0.99). The whole volume interobserver agreement in the first reading was excellent (ICC = 0.93). Round ADC had an excellent (ICC = 0.93) and fair (ICC = 0.58) interobserver agreement, in the first and second reading, respectively. Interobserver agreement in ADC small ROIs was good (ICC = 0.87), and good (ICC = 0.78), in the first and second reading, respectively. Intraobserver agreement varied from fair, good to excellent agreement. The ROI method showed varying inter- and intraobserver agreement in ADC measurement. Using multiple small ROI conceded the highest interobserver variability, and, thus, the whole volume or round seem to be the preferable methods.

Keywords: ADC; DWI; interobserver; region of interest; testicular tumor.


Conflict of interest statement

The authors declare no conflict of interest.

Figures

Figure 1
Figure 1
Testicular tumor in a 36-year old male. (A) is an MRI of both testicles. (B) is whole volume ROI. (C) is small ROIs. (D) is round ROI.
Figure 2
Figure 2
(a) Bland–Altman plot showing intraobserver agreement as average tumor length in reading 1 and 2 plotted against mean tumour length of the two readings separated on observer ID. The bold line corresponds to the mean difference (−0.06 cm) and the dashed lines corresponds to the upper and lower 95% limits of agreements (LOA) (95% LOA 0.40 to −0.90 cm). (b) Bland–Altman plot, showing intraobserver agreement as average tumor width in reading 1 and 2 plotted against mean tumour width of the two readings separated on observer ID. The bold line corresponds to the mean difference (−0.07 cm) and the dashed lines correspond to the upper and lower 95% limits of agreements (95% LOA 0.27 to −0.71 cm).
Figure 2
Figure 2
(a) Bland–Altman plot showing intraobserver agreement as average tumor length in reading 1 and 2 plotted against mean tumour length of the two readings separated on observer ID. The bold line corresponds to the mean difference (−0.06 cm) and the dashed lines corresponds to the upper and lower 95% limits of agreements (LOA) (95% LOA 0.40 to −0.90 cm). (b) Bland–Altman plot, showing intraobserver agreement as average tumor width in reading 1 and 2 plotted against mean tumour width of the two readings separated on observer ID. The bold line corresponds to the mean difference (−0.07 cm) and the dashed lines correspond to the upper and lower 95% limits of agreements (95% LOA 0.27 to −0.71 cm).
Figure 3
Figure 3
(a) Bland–Altman plot showing intraobserver agreement as average tumor apparent diffusion coefficient (ADC) measured by whole tumor volume in reading 1 and 2 plotted against mean tumour ADC measured by whole volume of the two readings separated on observer ID. The bold line corresponds to the mean difference (−0.02 × 10⁻³ mm2/s) and the dashed lines correspond to the upper and lower 95% limits of agreements (95% LOA 0.26 to −0.40). (b) Bland–Altman plot showing intraobserver agreement as average tumor apparent diffusion coefficient (ADC) measured as regions of interest (ROI) round shape in reading 1 and 2 plotted against mean tumour ADC measured as ROI round shape of the two readings separated on observer ID. The bold line corresponds to the mean difference (−0.01 × 10⁻³ mm2/s) and the dashed lines corresponds to the upper and lower 95% limits of agreements (95% LOA 0.46 to −0.68). (c) Bland–Altman plots showing intraobserver agreement as average tumor apparent diffusion coefficient (ADC) measured as region of interest (ROI) small in reading 1 and 2 plotted against mean tumour ADC measured as ROI small of the two readings separated on observer ID. The bold line corresponds to the mean difference (−0.04 × 10⁻³ mm2/s) and the dashed lines corresponds to the upper and lower 95% limits of agreements (95% LOA 0.21 to −0.29).
Figure 3
Figure 3
(a) Bland–Altman plot showing intraobserver agreement as average tumor apparent diffusion coefficient (ADC) measured by whole tumor volume in reading 1 and 2 plotted against mean tumour ADC measured by whole volume of the two readings separated on observer ID. The bold line corresponds to the mean difference (−0.02 × 10⁻³ mm2/s) and the dashed lines correspond to the upper and lower 95% limits of agreements (95% LOA 0.26 to −0.40). (b) Bland–Altman plot showing intraobserver agreement as average tumor apparent diffusion coefficient (ADC) measured as regions of interest (ROI) round shape in reading 1 and 2 plotted against mean tumour ADC measured as ROI round shape of the two readings separated on observer ID. The bold line corresponds to the mean difference (−0.01 × 10⁻³ mm2/s) and the dashed lines corresponds to the upper and lower 95% limits of agreements (95% LOA 0.46 to −0.68). (c) Bland–Altman plots showing intraobserver agreement as average tumor apparent diffusion coefficient (ADC) measured as region of interest (ROI) small in reading 1 and 2 plotted against mean tumour ADC measured as ROI small of the two readings separated on observer ID. The bold line corresponds to the mean difference (−0.04 × 10⁻³ mm2/s) and the dashed lines corresponds to the upper and lower 95% limits of agreements (95% LOA 0.21 to −0.29).

Similar articles

Cited by

References

    1. Pedersen M.R., Osther P.J., Nissen H.D., Vedsted P., Møller H., Rafaelsen S.R. Elastography and diffusion-weighted MRI in patients with testicular microlithiasis, normal testicular tissue, and testicular cancer: An observational study. Acta Radiol. 2019;60:535–541. doi: 10.1177/0284185118786063. - DOI - PubMed
    1. Schueller-Weidekamm C., Kaserer K., Schueller G., Scheuba C., Ringl H., Weber M., Czerny C., Herneth A.M. Can Quantitative Diffusion-Weighted MR Imaging Differentiate Benign and Malignant Cold Thyroid Nodules? Initial Results in 25 Patients. Am. J. Neuroradiol. 2009;30:417–422. doi: 10.3174/ajnr.A1338. - DOI - PMC - PubMed
    1. Nerad E., Pizzi A.D., Lambregts D.M.J., Maas M., Wadhwani S., Bakers F.C.H., Bosch H.C.M.V.D., Beets-Tan R.G.H., Lahaye M.J. The Apparent Diffusion Coefficient (ADC) is a useful biomarker in predicting metastatic colon cancer using the ADC-value of the primary tumor. PLoS ONE. 2019;14:e0211830. doi: 10.1371/journal.pone.0211830. - DOI - PMC - PubMed
    1. Wichtmann B.D., Zöllner F.G., Attenberger U.I., Schönberg S.O. Multiparametric MRI in the Diagnosis of Prostate Cancer: Physical Foundations, Limitations, and Prospective Advances of Diffusion-Weighted MRI. Rofo. 2021;193:399–409. doi: 10.1055/a-1276-1773. - DOI - PubMed
    1. Partridge S.C., Nissan N., Rahbar H., Kitsch A.E., Sigmund E.E. Diffusion-weighted breast MRI: Clinical applications and emerging techniques. J. Magn. Reson. Imaging. 2017;45:337–355. doi: 10.1002/jmri.25479. - DOI - PMC - PubMed