

An Extension of Reversible Image Enhancement Processing for Saturation and Brightness Contrast
- PMID: 35200729
- PMCID: PMC8878477
- DOI: 10.3390/jimaging8020027
An Extension of Reversible Image Enhancement Processing for Saturation and Brightness Contrast
Abstract
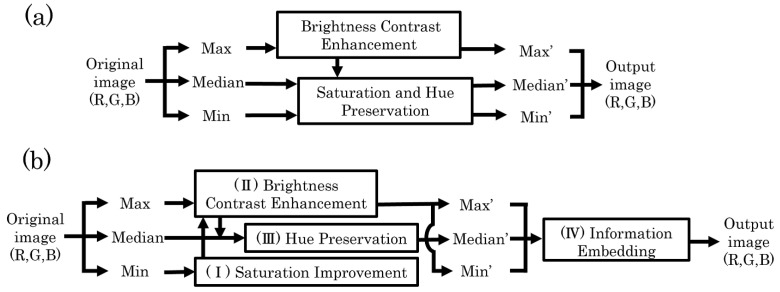
This paper proposes a reversible image processing method for color images that can independently improve saturation and enhance brightness contrast. Image processing techniques have been popularly used to obtain desired images. The existing techniques generally do not consider reversibility. Recently, many reversible image processing methods have been widely researched. Most of the previous studies have investigated reversible contrast enhancement for grayscale images based on data hiding techniques. When these techniques are simply applied to color images, hue distortion occurs. Several efficient methods have been studied for color images, but they could not guarantee complete reversibility. We previously proposed a new method that reversibly controls not only the brightness contrast, but also saturation. However, this method cannot fully control them independently. To tackle this issue, we extend our previous work without losing its advantages. The proposed method uses the HSV cone model, while our previous method uses the HSV cylinder model. The experimental results demonstrate that our method flexibly controls saturation and brightness contrast reversibly and independently.
Keywords: HSV color space; contrast enhancement; data hiding; reversibility; saturation improvement.
Conflict of interest statement
The authors declare no conflict of interest.
Figures


References
-
- Wu H.-T., Dugelay J.-L., Shi Y.-Q. Reversible image data hiding with contrast enhancement. IEEE Signal Process. Lett. 2015;22:81–85. doi: 10.1109/LSP.2014.2346989. - DOI
-
- Gao G., Shi Y.-Q. Reversible data hiding using controlled contrast enhancement and integer wavelet transform. IEEE Signal Process. Lett. 2015;22:2078–2082. doi: 10.1109/LSP.2015.2459055. - DOI
-
- Chen H., Ni J., Hong W., Chen T.-S. Reversible data hiding with contrast enhancement using adaptive histogram shifting and pixel value ordering. Signal Process. Image Commun. 2016;46:1–16. doi: 10.1016/j.image.2016.04.006. - DOI
-
- Kim S., Lussi R., Qu X., Kim H.J. Automatic contrast enhancement using reversible data hiding; Proceedings of the IEEE International Workshop on Information Forensics and Security; Rome, Italy. 16–19 November 2015; pp. 1–5.
-
- Kim S., Lussi R., Qu X., Huang F., Kim H.J. Reversible data hiding with automatic brightness preserving contrast enhancement. IEEE Trans. Circuits Syst. Video Technol. 2019;29:2271–2284. doi: 10.1109/TCSVT.2018.2869935. - DOI
Grants and funding
LinkOut - more resources
Full Text Sources
