

Visualization of Interstitial Pore Fluid Flow
- PMID: 35200734
- PMCID: PMC8879602
- DOI: 10.3390/jimaging8020032
Visualization of Interstitial Pore Fluid Flow
Abstract
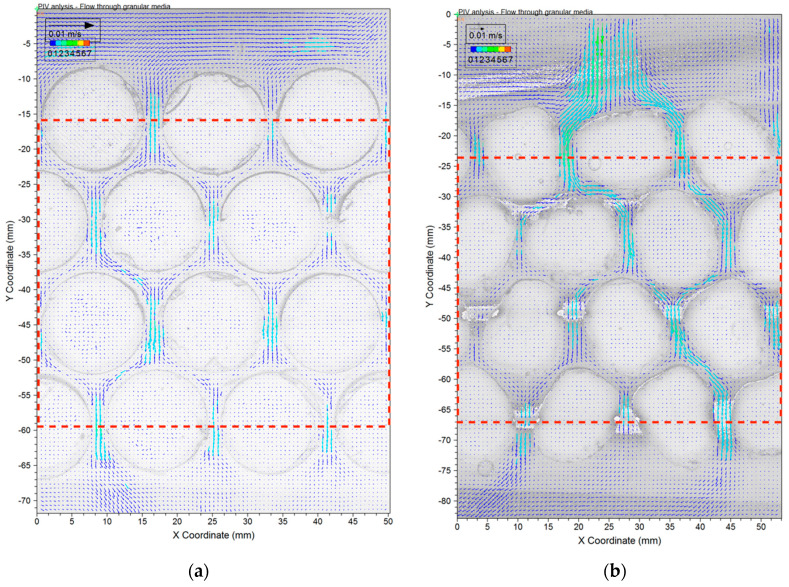
Pore scale analysis of flow through porous media is of interest because it is essential for understanding internal erosion and piping, among other applications. Past studies have mainly focused on exploring macroscopic flow to infer microscopic phenomena. An innovative method is introduced in this study which permits visualization of interstitial fluid flow through the pores of a saturated synthetic transparent granular medium at the microscale. Several representative images of Ottawa sand were obtained using dynamic image analysis (DIA), for comparison with flow through perfect cylinders. Magnified transparent soil particles made of hydrogel were cast in 3D printed molds. Custom 3D printed jigs were employed for accurate positioning of the particles to ensure that particles have the same flow area within the soil. The pore fluid was embedded with silver-coated hollow microspheres that allowed for their florescence and tracking their movement within the model when illuminated by a laser light source. Images of the flow were captured from the model using a high-speed camera. This, along with particle image velocimetry (PIV) provided for the velocity and direction analysis of fluid flow movements within the pore space of a planar 2D model. Comparison of interstitial flow through homogeneous porosity-controlled Ottawa-shaped and cylindrical particles demonstrates that the magnitude of turbulence is related to particle roundness.
Keywords: granulometry; inter-particle; microscale; roundness; shape.
Conflict of interest statement
The authors declare no conflict of interest and certify that they have no affiliations with or involvement in any organization or entity with any financial interest or non-financial interest in the subject matter or materials discussed in this manuscript.
Figures


References
-
- Hazen H.A. The Verification of Weather Forecasts. American Meteorological Journal. A Mon. Rev. Meteorol. Allied Branches Study (1884–1896) 1892;8:392.
-
- Burmister D.M. The Grading-Density Relations of Granular Materials. Volume 38. ASTM; Philadelphia, PA, USA: 1938. pp. 587–601.
-
- Mitchell J.K., Soga K. Fundamentals of Soil Behavior. Volume 3 John Wiley & Sons; New York, NY, USA: 2005.
-
- Pena A.A., Garcia-Rojo R., Herrmann H.J. Influence of particle shape on sheared dense granular media. Granul. Matter. 2007;9:279–291. doi: 10.1007/s10035-007-0038-2. - DOI
-
- Cho G.C., Dodds J., Santamarina J.C. Particle Shape Effects on Packing Density, Stiffness, and Strength: Natural and Crushed Sands. J. Geotech. Geoenviron. Eng. 2006;132:591–602. doi: 10.1061/(ASCE)1090-0241(2006)132:5(591). - DOI
LinkOut - more resources
Full Text Sources
Miscellaneous
