. 2022 Mar 7;219(3):e20211071.
doi: 10.1084/jem.20211071. Epub 2022 Feb 24.

Microglia modulate blood flow, neurovascular coupling, and hypoperfusion via purinergic actions

Affiliations

Microglia modulate blood flow, neurovascular coupling, and hypoperfusion via purinergic actions

Eszter Császár et al. J Exp Med. .

Abstract

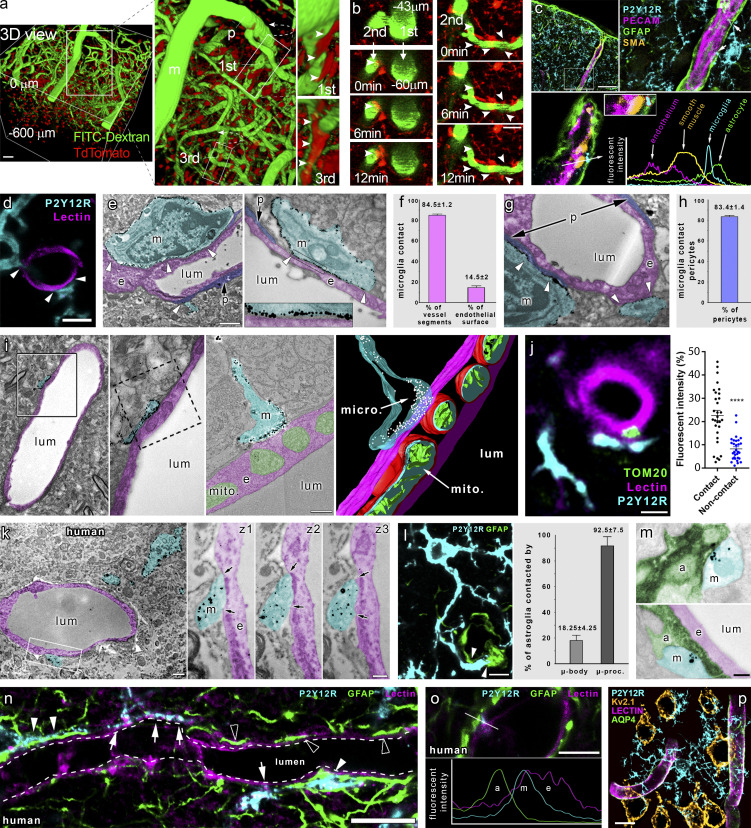
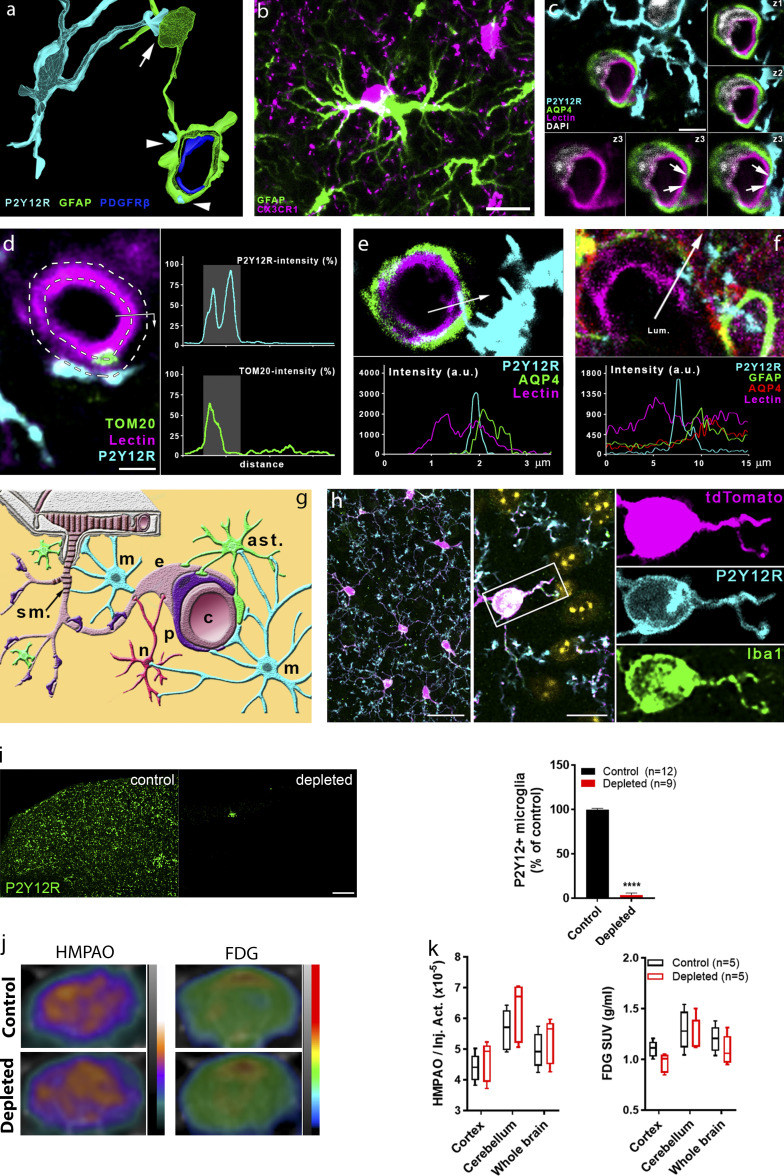
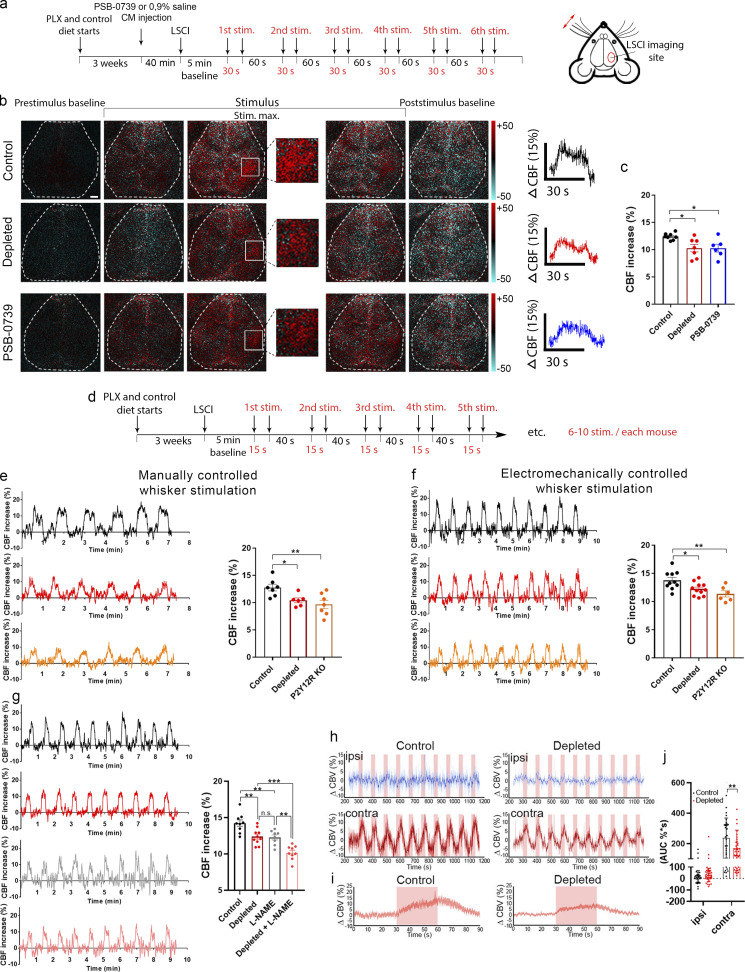
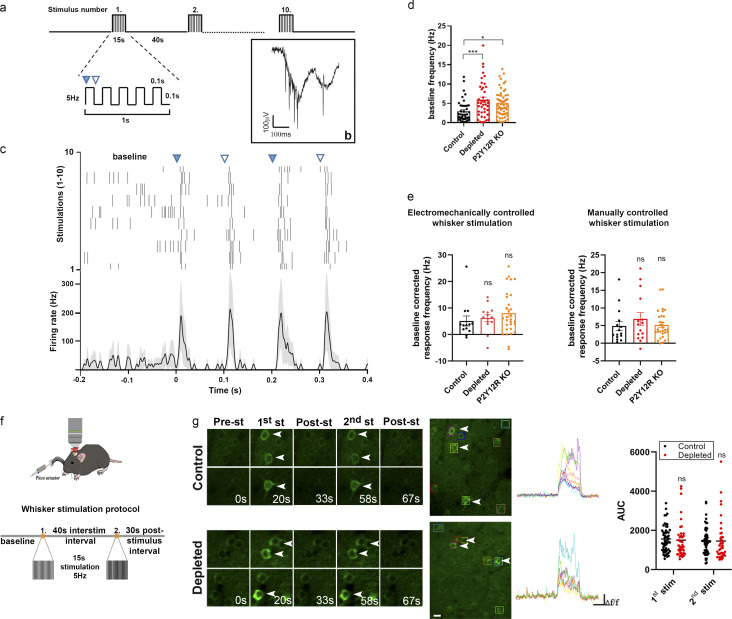
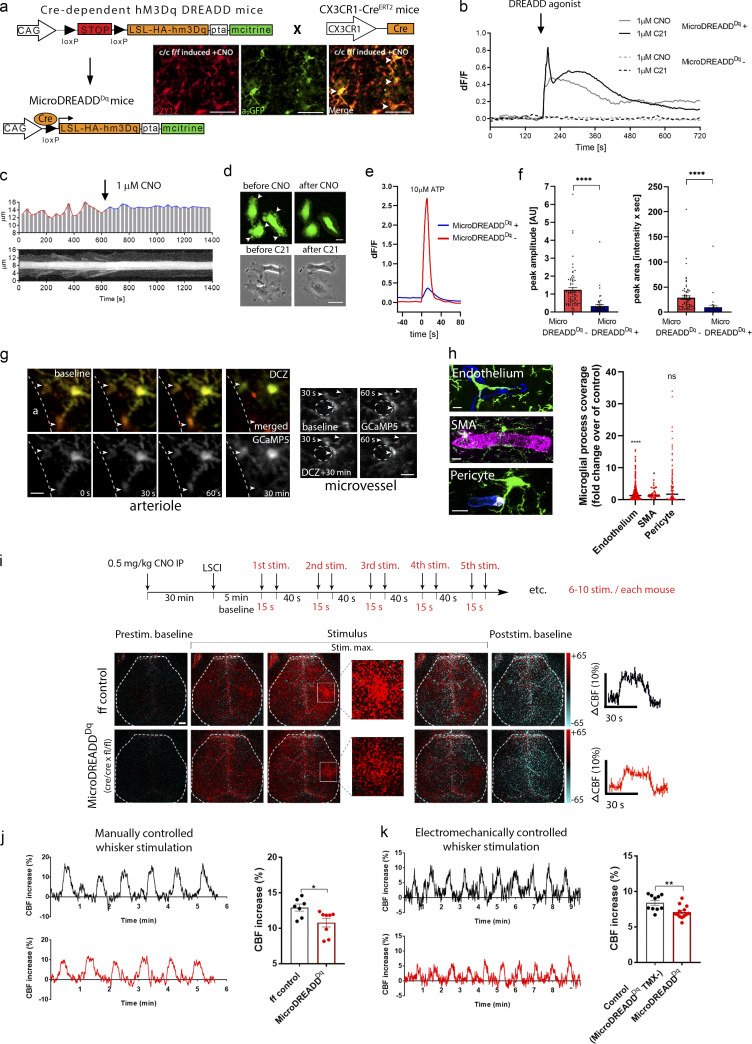
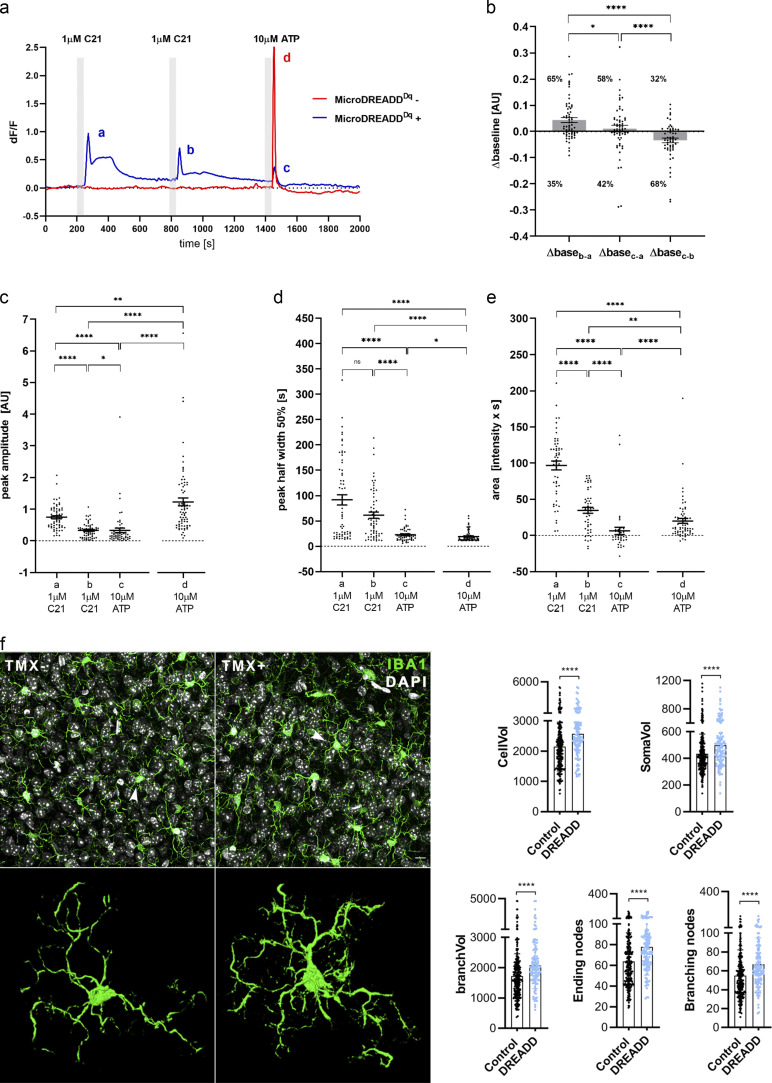
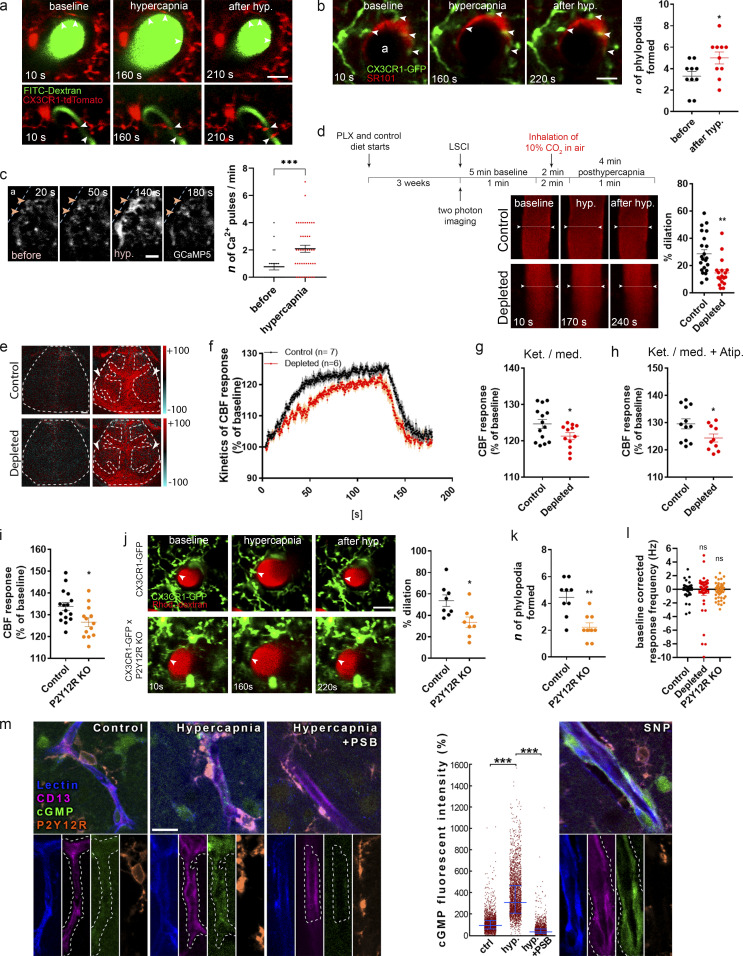
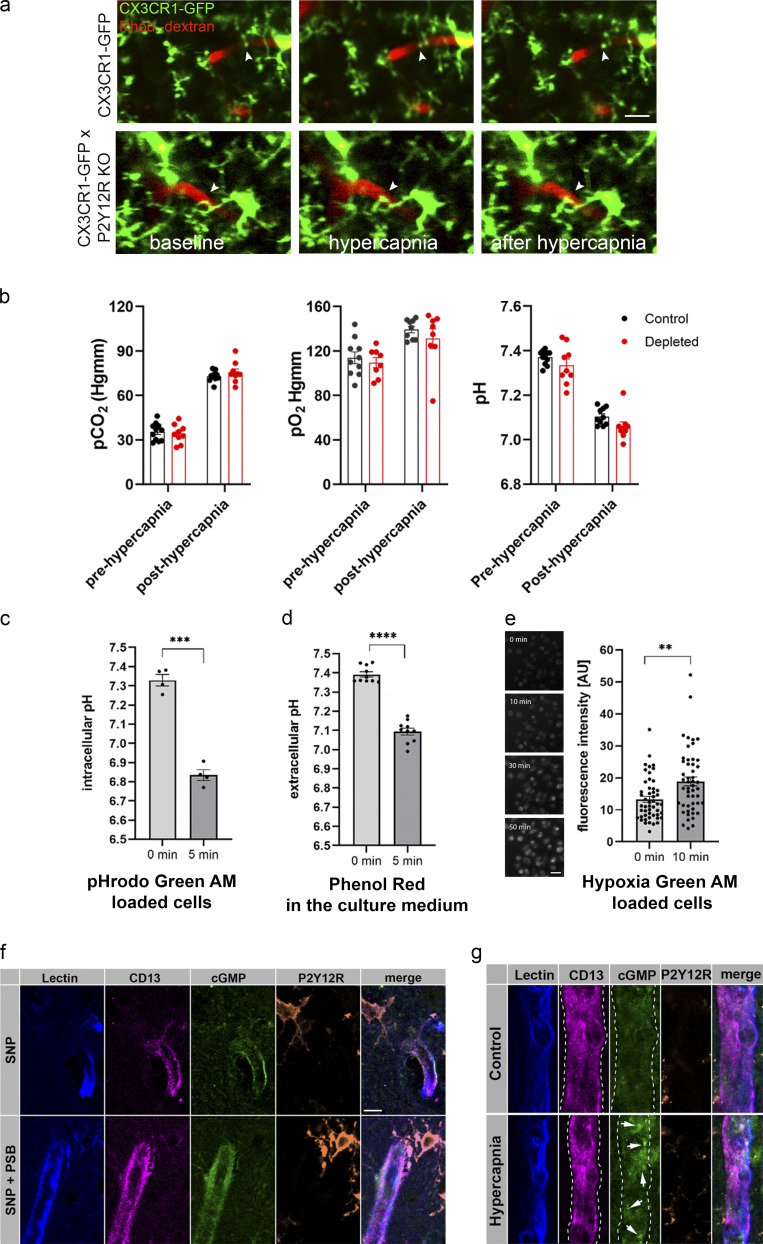
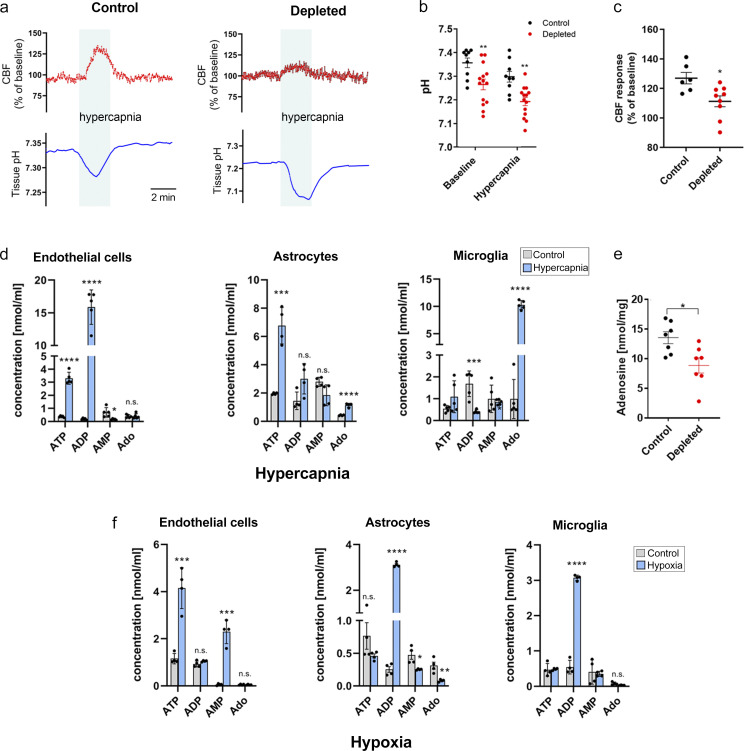
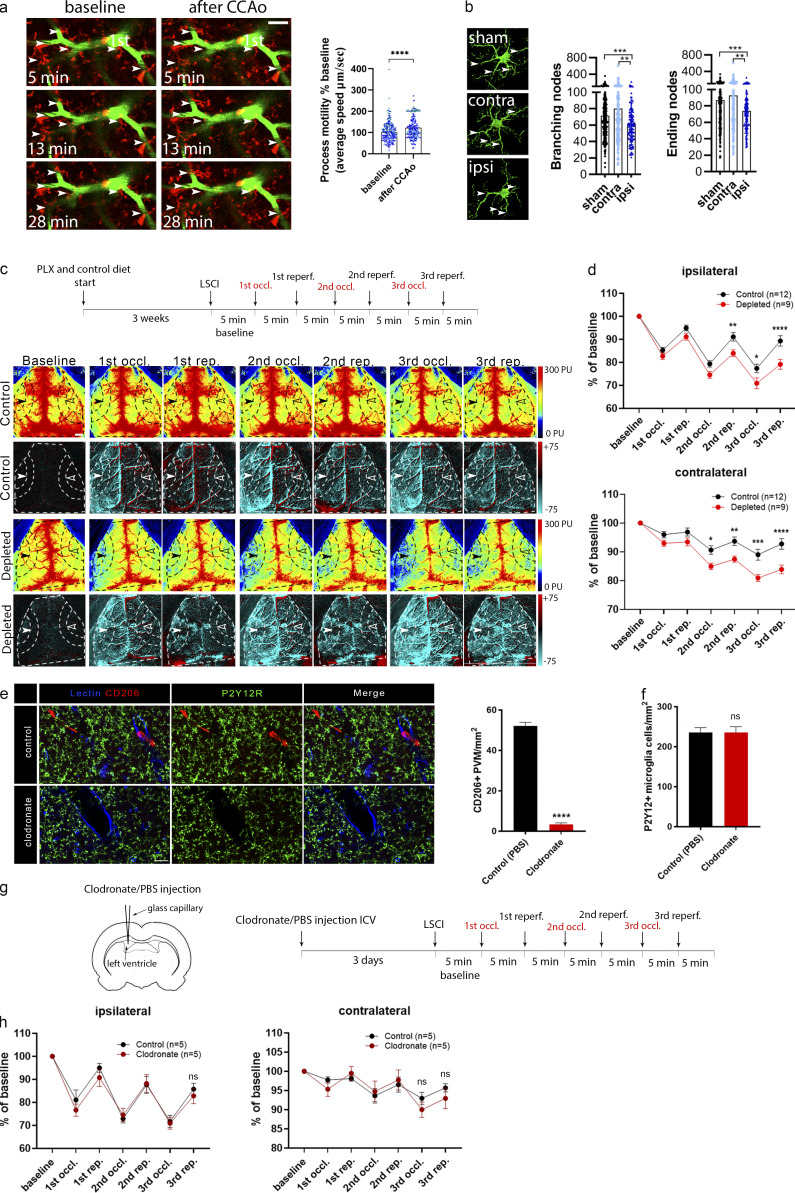
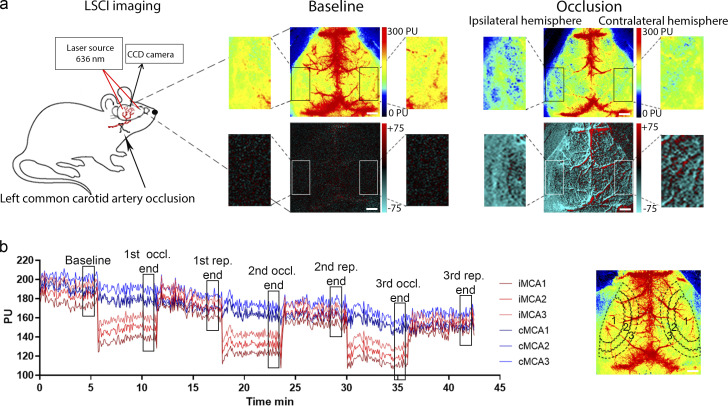
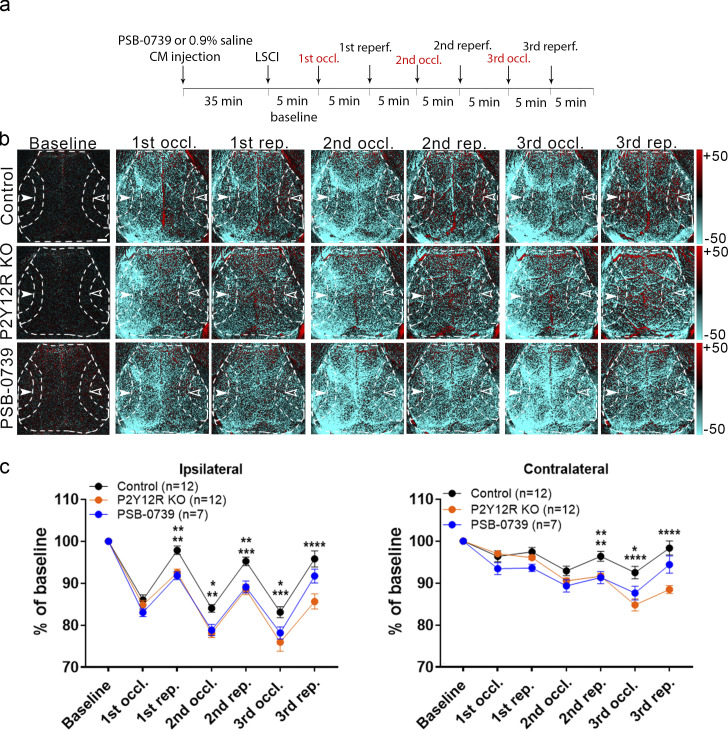
Microglia, the main immunocompetent cells of the brain, regulate neuronal function, but their contribution to cerebral blood flow (CBF) regulation has remained elusive. Here, we identify microglia as important modulators of CBF both under physiological conditions and during hypoperfusion. Microglia establish direct, dynamic purinergic contacts with cells in the neurovascular unit that shape CBF in both mice and humans. Surprisingly, the absence of microglia or blockade of microglial P2Y12 receptor (P2Y12R) substantially impairs neurovascular coupling in mice, which is reiterated by chemogenetically induced microglial dysfunction associated with impaired ATP sensitivity. Hypercapnia induces rapid microglial calcium changes, P2Y12R-mediated formation of perivascular phylopodia, and microglial adenosine production, while depletion of microglia reduces brain pH and impairs hypercapnia-induced vasodilation. Microglial actions modulate vascular cyclic GMP levels but are partially independent of nitric oxide. Finally, microglial dysfunction markedly impairs P2Y12R-mediated cerebrovascular adaptation to common carotid artery occlusion resulting in hypoperfusion. Thus, our data reveal a previously unrecognized role for microglia in CBF regulation, with broad implications for common neurological diseases.


Conflict of interest statement

Disclosures: D. Máthé reported grants from European Union H2020 HCEMM-739593 and from NRDIO, Hungary, TKP-BIOImaging-2020-4.1.1-TKP2020 during the conduct of the study. D. Máthé is CEO and stakeholder of CROmed Ltd. Z. Lenkei reported personal fees from Iconeus outside the submitted work. No other disclosures were reported.

Figures

Figure 1.
Figure 1.
Microglia form direct purinergic contact with cells in the NVU that regulate CBF. (a) 3D reconstruction of in vivo two-photon Z-stacks down to 600 μm below the dura mater in the cerebral cortex of CX3CR1tdTomato mice. Note contacting microglia (arrowheads) at meningeal (m), penetrating (p), and first- to third-order capillaries. Scale bar, 50 μm. (b) Microglial processes (arrowheads) dynamically contact different segments of the vascular tree (visualized by i.v. FITC-dextran). Scale bar, 20 µm. (c) Microglial processes are extended beyond the perivascular glial endfeet and form direct contact with smooth muscle cells (arrows) at the level of penetrating arteries. (d) CLSM images show microglia (P2Y12R, cyan) contacting endothelial cells (tomato lectin, magenta) in the cerebral cortex. (e) EM images show microglia (m, P2Y12R-immunogold labeling, cyan) directly contacting endothelial cells (e, magenta) and pericytes (p, purple). (f) Frequency of vessels receiving microglial contact, and microglial process coverage of endothelial cell surface. (g) EM images show microglia (m, P2Y12R-immunogold labeling, cyan) directly contacting pericytes (p, purple). (h) 83.4 ± 1.4% of pericytic cell bodies are contacted by microglial processes. (i) 3D reconstruction of electron tomogram shows clustering of anti-P2Y12R-immunogold on microglial processes (m) directly contacting the endothelium (e) of an arteriole/postcapillary venule. The left two panels are conventional EM images of the same area on the adjacent ultrathin section. The right panels show a tomographic virtual section and 3D reconstruction of the direct contact. (j) Unbiased anatomic analysis reveals enrichment of endothelial mitochondria (TOM20+, green), at sites of microglial contacts (P2Y12R+, cyan). ****, P < 0.0001, Mann–Whitney U test. See analysis details in Fig. S1 d. (k) EM images show microglia (m, P2Y12R-immunogold, cyan) directly contacting endothelial cells (e, magenta) in human neocortex. z1–z3 panels show the contact on three consecutive ultrathin sections; arrows mark the edges of direct membrane contact. (l) CLSM image shows microglia (P2Y12R, cyan) contacting the cell body of an astrocyte (GFAP labeling, green) and astrocytic endfeet (arrowheads). (m) EM images show direct contact between microglial (m, cyan) and astrocytic (a, green) processes. e, endothelial cell, magenta; lum, lumen. (n) CLSM images in human neocortex reveal P2Y12R+ microglial processes (cyan) contacting perivascular astrocytes (GFAP, green) on astrocyte endfeet (white arrowheads) and endothelial cells (tomato-lectin, magenta, white arrows), with astrocytic endfeet directly touching the endothelial monolayer (empty arrowheads). (o) CLSM image and fluorescent intensity plots show microglial process (m) contacting the endothelial layer (e) within the astrocytic layer (a). (p) To reveal 3D connections of individual microglial cells, a CLSM maximum-intensity plot was generated. Microglia (cyan) contact several microvessels (lectin, magenta; AQP4, green) and neurons (Kv2.1, ochre) simultaneously. For appropriate visualization of neuronal cell bodies, Kv2.1 is shown in yellow pseudocolor only with the maximal diameter planes included. Scale bars: (c) 50 µm; (d) 3 µm; (e) 2 µm; (i) 200 nm; (j) 2 µm; (k) left, 1 μm, and z3, 400 nm; (l) 10 µm; (m) 200 nm; (n) 10 µm; (o) 5 µm; (p) 10 µm.
Figure S1.
Figure S1.
Microglia form direct contacts with cells in the NVU, but microglia depletion does not disrupt cerebal perfusion or metabolism. (a) 3D reconstruction of a high-resolution CLSM Z-stack shows microglia (P2Y12R, cyan) contacting both the cell body of an astrocyte (GFAP labeling, green, arrow) and astrocytic endfeet (arrowheads) ensheathing a capillary. Pericytes are visualized by anti-PDGFRb labeling (blue). (b) Microglia (CX3CR1, magenta) are able to form direct contact by their cell body with astrocytes (GFAP labeling, green) in the cerebral cortex. Scale bar, 10 μm. (c) CLSM image shows P2Y12R-positive microglial process (cyan) contacting perivascular AQP4-positive astrocyte endfeet (green) and also extends to the endothelial layer (lectin, magenta) where astrocytic coverage is not present (arrows). z1–z3 panels show the contact area on three consecutive confocal sections. Scale bar, 3 μm. (d) The process of semiautomated unbiased analysis of fluorescent intensity area for the graph presented in Fig. 1 j is depicted. White dashed lines represent the outer and the inner profiles, based on the outline of the endothelial cell. P2Y12R intensity was measured along the outer profile and TOM20 intensity along the inner profile, starting from the arrow. The intensity values are plotted (right) along the perimeter of the vessel. Contact site (marked by the gray column in the plots) was defined automatically. Scale bar, 2 µm. (e) CLSM image and fluorescent intensity plots show microglial process extending beyond perivascular astrocytic endfeet to interact with the endothelium. The fluorescent intensity profile plot (measured along the 3.5-µm long white arrow) clearly shows the presence of the microglial process under the astrocytic endfeet. (f) CLSM image and fluorescent intensity plots show microglial processes interacting with GFAP- and AQP4-positive astrocytes in the human brain. The fluorescent intensity profile plot (measured along the 15-μm-long white arrow) clearly shows the presence of the microglial process between the endothelium and the endfeet of perivascular astrocytes. (g) Schematic summary of contacts formed between microglia (m; cyan) and different cell types of the NVU. Neurons (n; red), astrocytes (ast.; green), pericytes (p; purple), endothelial cells (e; pale crimson), and vascular smooth muscle cells (s.m.; dark crimson) are shown. (h) Characterisation of CX3CR1tdTomato mice. Parenchymal tdTomato-positive cells coexpress Iba1 and P2Y12R in the cerebral cortex. Cell nuclei stained with DAPI appear in yellow pseudocolor in the merged middle image. Scale bars, 25 µm (left), 10 µm (middle). (i) Feeding C57BL/6J mice with a diet containing PLX5622 results in an almost complete (97%) elimination of resident microglia as evidenced by the numbers of P2Y12R-positive cells in the cerebral cortex. Scale bar, 100 μm. n = 12 control and n = 9 depleted mice per group; ****, P < 0.0001 control versus depleted, unpaired t test with Welch’s correction. (j and k) HMPAO-SPECT and FDG-PET images of control and microglia-depleted mice. Proportion of measured and injected HMPAO activity (Inj. Act.) and standard uptake values (SUVs) of FDG are shown. Atlas-based ROI analysis (j) shows no significant differences between the normalized regional uptake values (k) of the two groups. n = 5 and 5 mice. Data are expressed as mean ± SEM.
Figure 2.
Figure 2.
Microglia contribute to neurovascular coupling in a P2Y12R-mediated manner. (a) Schematic showing the outline of the experiment. (b) Difference images show CBF changes in the right barrel cortex relative to baseline in response to contralateral whisker stimulation before, during, and after stimulus (stim.; white rectangle indicates the barrel field). Time course of stimulus-evoked CBF responses is shown in the right of b. Scale bar, 1 mm. (c) Absence of microglia or acute blockade of P2Y12R reduces the maximum of evoked CBF responses compared with controls. n = 7 control, n = 7 depleted, and n = 6 PSB-0739 injected mice; *, P < 0.05, one-way ANOVA followed by Dunnett’s multiple comparison test (control versus depleted, P = 0.0191; control versus PSB-0739, P = 0.0243). (d) Protocol of manually and electromechanically controlled whisker stimulation. (e and f) Representative CBF traces and quantification show impaired neurovascular coupling response in the absence of microglia and in P2Y12R KO mice. n = 7 control, n = 6 depleted, and n = 7 P2Y12R KO mice (e and f); n = 10 control, n = 11 depleted, and n = 6 P2Y12R KO mice; **, P = 0.0075 (e); **, P = 0.0058 (f), one-way ANOVA followed by Dunnett’s multiple comparison test (e: *, P = 0.0378, control versus depleted; **, P = 0.0052 control versus P2Y12R KO; f: *, P = 0.0311 control versus depleted; **, P = 0.0047 control versus P2Y12R KO). (g) Representative CBF traces and graph show changes in neurovascular coupling response in L-NAME–treated mice in both the presence and the absence of microglia. n = 9 control, n = 10 depleted, n = 8 L-NAME–treated, n = 9 L-NAME–treated depleted; P < 0.0001, one-way ANOVA followed by Tukey’s multiple comparison test (**, P = 0.005, control versus depleted; **, P = 0.0049, control versus L-NAME; **, P = 0.0026, L-NAME versus depleted + L-NAME; ***, P = 0.0008, depleted versus depleted + L-NAME). (h) fUS imaging reveals reduced CBV responses compared with controls in the ipsilateral (ipsi) and contralateral (contra) barrel cortex. Representative traces of 10 subsequent stimulations (30 s each) are shown for control and microglia-depleted mice. (i) Peak trace averages of the contralateral side in control and depleted mice, with 95% confidence intervals. (j) Averaged AUC distribution for each group, as shown in pink window in i. Data are presented as mean ± SEM; n = 30 and n = 40 stimulations from three control and four depleted mice, respectively (j); **, P = 0.0093, two-way ANOVA followed by Sidak’s multiple comparisons test. Data are presented as mean ± SEM. LSCI data have been pooled from two to three independent experiments.
Figure 3.
Figure 3.
Whisker stimulation–evoked neuronal responses in the barrel cortex do not explain altered CBF responses after microglia manipulation. (a) Schematics of the whisker stimulation protocol. Whiskers were stimulated electromechanically with 5 Hz, causing alternating passive deflections of the vibrissae in the anterior and posterior directions (filled and empty arrowheads, respectively) for 15 s, followed by a 40-s pause, repeated 10 times. (b) Raw tetrode data showing extracellular spikes recorded from the barrel cortex. (c) Example of a single neuron activated by passive whisker deflections. Top, raster plot aligned to whisker stimulation onset (black ticks, individual action potentials). Bottom, peristimulus time histogram showing mean firing responses of the same neuron (shading, SEM). (d) Baseline firing rates were significantly higher in depleted and P2Y12R KO mice compared with controls. n = 4 control, n = 3 depleted, and n = 5 P2Y12R KO mice; P = 0.001, one-way ANOVA with Dunnett’s multiple comparisons test (***, P < 0.006, control versus depleted; *, P = 0.0109, control versus P2Y12R KO). (e) Stimulus-induced firing rate changes were comparable across controls and microglia-depleted mice using either electromechanically or manually controlled whisker stimulation. Data are presented as baseline corrected response frequency (for corresponding baseline frequencies, mean ± SEM); n = 4 control, n = 3 depleted, and n = 5 P2Y12R KO mice; P = 0.2087 and P = 0.6391, Kruskal–Wallis test with Dunn’s multiple comparisons test. (f) Schematic outlines of the whisker stimulation protocol used for in vivo two-photon [Ca2+]i imaging in the barrel cortex of Thy1-GCaMP6s mice. interstim, interstimulation. (g) Representative images show stimulus-evoked neuronal [Ca2+]i responses with individual traces of neurons labeled with rectangles during baseline imaging and 15-s stimulation and after stimulation. AUC values of neuronal GCaMP6s signal changes in response to the first and second electromechanically controlled whisker stimulation in control and microglia-depleted mice. n = 4 mice per group, n = 56 neurons from control and n = 40 neurons from depleted mice from two trials; P = 0.765, two-way ANOVA with Sidak’s multiple comparisons test. Scale bar, 20 µm. st and stim, stimulation. Data are presented as mean ± SEM.
Figure 4.
Figure 4.
Chemogenetic modulation of microglial activity leads to decreased process motility and impaired neurovascular coupling response to whisker stimulation. (a) Generation of a novel chemogenetic mouse model. TMX-induced recombination was confirmed by anti-P2Y12R and anti-GFP (mCitrine) double staining (white arrowheads), allowing chemogenetic activation of microglia by CNO. Scale bar, 50 μm. (b) Representative ∆F/F calcium traces of MicroDREADDDq microglia cells responding to DREADD agonists CNO or C21. (c and d) The kymogram (c) and fluorescent/phase contrast images (d) taken from time-lapse sequences show that cell membrane ruffling is ceased upon treatment with DREADD agonists, and the cells acquire a flattened morphology. Scale bars, 5 μm, upper panel; 10 μm, lower panel. See also Video 4 and Video 5. (e and f) Analyses of calcium curves reveal an attenuated responsiveness to ATP in MicroDREADDDq+ cells previously responding to C21. See details in Fig. S2. n = 64 for MicroDREADDDq+, n = 73 for MicroDREADDDq−; ****, P < 0.0001, Mann–Whitney U test (f). (g) Microglial processes interacting with blood vessels show dynamic [Ca2+]i fluctuations (arrowheads) in the cerebral cortex of MicroDREADDDq × CGaMP5g–tdTomato mice in vivo. Microglial responses have been investigated before (baseline) and 30 min after administration of the DREADD agonist deschloroclozapine (DCZ) around arterioles (a, lumen of the arteriole is shown) and microvessels (n = 4 mice). Scale bar, 10 µm. (h) 1 h after chemogenetic activation, microglial process coverage (Iba1, green) of endothelial cells (lectin, blue), smooth muscle cells (SMA, magenta), and pericytes (PDGFRb, white) was assessed on perfusion fixed brain sections. Scale bar, 10 µm. n = 263 blood vessels, n = 66 SMA-positive vessels, and n = 291 pericytes were measured from n = 3 mice; ****, P = 0.0001 endothelium versus control and *, P = 0.026 SMA versus control, Mann–Whitney U test. (i) 6 wk after TMX, CBF was measured by LSCI during whisker stimulations in MicroDREADDDq and control mice 30 min after a single i.p. (IP) CNO administration. Representative difference images show CBF changes relative to baseline in control and MicroDREADDDq mice (white rectangle indicates the area of barrel cortex). Representative stimulus-evoked response curves are shown in the right of i. Scale bar, 1 mm. (j and k) Representative CBF curves of manually and electromechanically controlled whisker stimulation measured by LSCI. The maximum of evoked responses show a marked reduction in MicroDREADDDq mice compared with controls. n = 7 control and n = 8 MicroDREADDDq mice; *, P = 0.0401, Mann–Whitney U test (j); n = 10 control and n = 13 MicroDREADDDq mice; **, P = 0.0045, unpaired t test (k). Data are presented as mean ± SEM. LSCI data have been pooled from two to three independent experiments.
Figure S2.
Figure S2.
Microglial cells expressing DREADD (hM3Dq) respond to DREADD agonist C21 with a biphasic [Ca2+]i response and reduced ATP responsiveness. (a) Representative calcium signals of cultured MicroDREADDDq+ and MicroDREADDDq− microglia cells repeatedly exposed to 1 µM C21 and 10 µM ATP for 1 min. (b) Differences of average baseline values determined within 50 s before the onset of the responses. Mann-Whitney U test; *, P < 0.05; ****, P < 0.0001. (c–e) Peak amplitudes (c), half-width values (d), and peak areas (e) of a, b, c and d peaks denoted in the line graph (a). n = 64 for MicroDREADDDq+, n = 73 for MicroDREADDDq−; Mann–Whitney U test; ****, P < 0.0001; **, P < 0.01; *, P < 0.05 (c–e). (f) Automated analysis shows marked morphological changes in MicroDREADDDq+ microglia in TMX-treated mice 1 h after i.p. CNO administration, compared with littermates in which hM3Dq DREADD expression was not induced with TMX (control). n = 275 control (MicroDREADDDq−) and n = 122 DREADD (MicroDREADDDq+) microglia from n = 3 mice from each group were analysed. Mann–Whitney U test; ****, P < 0.0001 for cell volume (CellVol), soma volume (SomaVol), branch volume (branchVol), ending nodes, and branching nodes. Scale bar, 20 μm. Data are expressed as mean ± SEM.
Figure 5.
Figure 5.
Microglia contribute to hypercapnia-induced vasodilation. (a) In vivo two-photon resonant (32-Hz) imaging was performed in the somatosensory cortex of CX3CR1tdTomato mice during hypercapnia (by inhalation of 10% CO2 under normoxic conditions). The middle panel shows the maximal vasodilation provoked by hypercapnia. Scale bar, 20 μm. (b) Identical hypercapnic challenge and imaging protocol was performed in CX3CR1GFP/+ mice after intracortical injection of SR101 to visualize astrocytes. The number of phylopodia formed at the end of contacting microglial processes (arrowheads) increased in response to hypercapnia. n = 5 mice; *, P = 0.0316, Mann–Whitney U test. Scale bar, 20 µm. (c) Perivascular microglia respond rapidly to hypercapnia with [Ca2+]i pulses in small (arrowheads) and large processes as assessed in CX3CR1CGaMP5g–tdTomato mice. Individual processes were followed with in vivo two-photon resonant (31-Hz) imaging; see also Video 7. Scale bar, 10 µm. n = 4 mice; ***, P = 0.001, Mann–Whitney U test. (d) In vivo two-photon imaging reveals impaired vasodilation at the level of penetrating arteries in the absence of microglia. n = 22 and n = 18 vessels from eight control and six depleted mice; **, P = 0.0013, unpaired t test. The experimental protocol shown for hypercapnic (hyp.) challenge was identical for in vivo two-photon imaging (a–d and j–l) and LSCI (e–i). (e) Difference images show reduced CBF response in microglia-depleted mice to hypercapnic challenge (ROIs are labeled with arrowheads). Scale bar, 1 mm. (f) The average kinetics of hypercapnic responses show difference in depleted mice compared with controls. n = 14–12 ROIs from seven control and six depleted mice, two ROIs/mouse (f and g); ****, P < 0.0001, Mann–Whitney U test (f); *, P = 0.0472, unpaired t test (g). (g and h) Hypercapnia-evoked CBF response is markedly decreased in the absence of microglia under ketamine-medetomidine (Ket./med.; g) or Ket./med. (h) anesthesia after administration of atipamezole (Atip.). n = 12–10 ROIs from six control and five depleted mice, two ROIs/mouse; *, P = 0.0436, unpaired t test. (i) Hypercapnia-evoked CBF response is markedly decreased in P2Y12R KO mice as assessed by LSCI. n = 16 control, n = 13 P2Y12R KO; *, P = 0.0131, unpaired t test. (j) In vivo two-photon imaging reveals that elimination of P2Y12R impairs hypercapnia-induced vasodilation in double transgenic (CX3CR1GFP/+ × P2Y12R KO) mice compared with P2Y12R-competent CX3CR1GFP/+ mice. n = 8 and 8 vessels from n = 5 control and n = 5 P2Y12R KO mice; *, P = 0.0104, Mann–Whitney U test. Scale bar, 20 µm. (k) The number of phylopodia formed at the end of perivascular microglial processes in response to hypercapnia is significantly reduced in P2Y12R KO mice. n = 5 control and n = 5 P2Y12R KO mice; **, P = 0.003, Mann–Whitney U test. (l) During hypercapnic challenge, neuronal activity did not differ between control, microglia-depleted, and P2Y12R KO mice. n = 49 single units in control, n = 44 in depleted, and n = 61 in P2Y12R KO group; P = 0.4852, Kruskal–Wallis test with Dunn’s multiple comparison. (m) Single image planes for CLSM imaging show small blood vessel segments from the second to third layer of the neocortex in acute brain slices. Lectin (blue) outlines the vessels, CD13 labels contractile elements (pericytes and smooth muscle cells), microglial P2Y12R is orange, and cGMP signal can be seen in green. cGMP levels were measured within areas (outlined by white dashed line) masked based on CD13 staining. A low level of basal cGMP levels can be seen under control conditions, while hypercapnia induced a robust increase in vascular cGMP levels. Preincubation with the P2Y12R inhibitor PSB0739 abolished hypercapnia-induced cGMP elevation. As a control, application of the NO donor SNP also induced robust cGMP production. Scale bar is uniformly 15 µm. n = 3 mice; ***, P < 0.0001, Kruskal–Wallis test. Data are expressed as mean ± SEM (b–d and f–l) and median ± IQR (m). LSCI data have been pooled from two to three independent experiments.
Figure S3.
Figure S3.
Microglia modulation does not change blood gases but impacts on cGMP levels in the cerebral vasculature. (a) In vivo two-photon imaging was performed with resonant scanning (32 Hz) in the somatosensory cortex of CX3CR1GFP/+ × P2Y12R KO and CX3CR1GFP/+ (P2Y12R-competent) mice following intravenous Rhodamine B-Dextran (Rhod.-dextran) administration to visualize blood vessels. After recording 60 s of baseline, vasodilation was induced by inhalation of 10% CO2 in air for 120 s (61–180 s) under normoxic conditions, followed by 60 s of posthypercapnia recording, using a protocol identical to that shown in Fig. 5 d. Scale bar, 10 µm. (b) Arterial pCO2, pO2, and pH measurements under ketamine-medetomidine anesthesia after the administration of atipamezole performed before and after hypercapnic challenge. Blood samples were taken from the femoral artery. No significant difference was observed between control and microglia-depleted mice. n = 10 control and n = 8 depleted mice, two-way ANOVA followed by Sidak’s multiple comparison test. (c and d) Both intracellular (c) and extracellular (d) pH markedly decreases within a few minutes after exposing cells to 15% CO2/85% air gas mixture, as a model of hypercapnia. Extracellular pH was determined by Phenol Red absorbance measurements, and intracellular pH was measured as changes in pHrodo Green AM dye fluorescence in glial cells. n = 4 parallels per group; ***, P = 0.0001, 0 min versus 5 min, paired t test (c); n = 10 parallels per group; ****, P < 0.0001, 0 min versus 5 min, paired t test (d). (e) Hypoxia Green AM loaded cells exhibit significant increase in fluorescent intensity within 10 min after placing microglia cultures to hypoxic environment (1% O2/5% CO2/94% N2). The reagent begins to fluoresce when oxygen levels drop below 5%. n = 50 parallels per group; **, P = 0.0019 0 min versus 10 min, Mann–Whitney U test. Scale bar, 30 µm. Data are shown as mean ± SEM (b–e). (f) Single image planes for CLSM imaging show small blood vessel segments from second and third layer of the neocortex in acute brain slices. Lectin (blue) outlines the vessels, CD13 labels contractile elements (pericytes and smooth muscle cells), microglial P2Y12R is orange, and cGMP signal can be seen in green (arrows). Note that PSB0739 treatment has no effect on SNP-induced cGMP. (g) CLSM imaging shows small blood vessel segments from the second and third layer of the neocortex in perfusion-fixed brain sections. Hypercapnia was induced in vivo and maintained in anesthetized mice until sacrifice. Lectin (blue) outlines the vessels, CD13 labels contractile elements (pericytes and smooth muscle cells), microglial P2Y12R is orange, and cGMP signal can be seen in green (arrows).
Figure 6.
Figure 6.
Stimulus-specific release of purinergic metabolites by NVU cells parallels microglial modulation of brain pH and hypercapnia-induced adenosine production. (a) CBF by laser Doppler flowmetry and tissue pH by pH-selective electrode were simultaneously assessed during hypercapnic challenge for 2 min. (b) Depleted mice show reduced extracellular brain pH. n = 10 and n = 16 measurements from six control and nine depleted mice; P < 0.0001, two-way ANOVA followed by Sidak’s multiple comparison (**, P = 0.0093, control versus depleted baseline; **, P = 0.0028, control versus depleted hypercapnia). (c) CBF response to hypercapnia is reduced in microglia-depleted mice. n = 6 control and 9 depleted mice; *, P = 0.012, Mann–Whitney test. (d) Effect of hypercapnia on levels of purinergic metabolites (ATP, ADP, AMP, and Ado [adenosine]) in primary endothelial, astrocyte, and microglia cultures as measured by HPLC. Endothelial cells: ATP: ****, P < 0.0001; ADP: ****, P < 0.0001; AMP: *, P = 0.01226, control versus hypercapnia; astrocytes: ATP: ***, P = 0.00029; Ado: ****, P = 0.000057, control versus hypercapnia; microglia; ADP: ***, P = 0.00134; Ado: ****, P < 0.0001, control versus hypercapnia; multiple t test. (e) Adenosine levels are significantly reduced in the cerebral cortex in the absence of microglia upon hypercapnic challenge. Adenosine was measured by HPLC in cortical brain tissue homogenates. n = 7 control and n = 7 depleted mice; *, P = 0.0142, unpaired t test. (f) Effect of hypoxia on levels of purinergic metabolites (ATP, ADP, AMP, and Ado) in primary endothelial, astrocyte, and microglia cultures as measured by HPLC. Endothelial cells: ATP: ***, P = 0.00054; AMP: ***, P = 0.00011, control versus hypercapnia; astrocytes: ADP: ****, P < 0.0001; AMP: *, P = 0.0148; Ado: **, P = 0.0059, control versus hypercapnia; microglia: ADP: ****, P < 0.0001, control versus hypercapnia; multiple t test. Data are expressed as mean ± SEM.
Figure 7.
Figure 7.
Adaptation to cortical hypoperfusion is impaired in the absence of microglia. (a) In vivo two-photon imaging reveals increased microglial process motility (arrowheads) to repeated (3×) CCAo in CX3CR1tdTomato mice (1st, first-order capillary). n = 6 mice; ****, P < 0.0001, Mann–Whitney U test. Scale bar, 20 μm. (b) Automated morphological analysis demonstrates reduced number of branching and ending nodes of microglial processes ipsilaterally in CX3CR1GFP/+ mice 24 h after 3× CCAo compared with the contralateral side (contra) and sham animals in the cerebral cortex. Branching/ending nodes of n = 386–388 sham, n = 197 contralateral (contra), and n = 134 ipsilateral (ipsi) cells from n = 3 sham and n = 3 CCAo mice; ***, P = 0.0008, Kruskal–Wallis test followed by Dunn’s multiple comparisons test (branching nodes: ***, P = 0.0008, sham versus ipsi; **, P = 0.005, contra versus ipsi; ending nodes: ***, P = 0.0007, sham versus ipsi; **, P = 0.0083, contra versus ipsi). (c) Representative perfusion (first and third rows), and difference LSCI images (second and fourth rows) showing cortical perfusion changes in response to 3× CCAo (occl.) in control and microglia-depleted mice. Dashed lines indicate the area of quantification in both the ipsilateral (white arrowheads) and contralateral (empty arrowheads) hemisphere as shown in d. Venous sinuses were excluded from the analysis. Scale bar, 1 mm. reperf., reperfusion. (d) CBF responses to 3× CCAo are shown as the percentage of baseline. A significant CBF reduction is seen in the absence of microglia in both hemispheres. n = 9 control and n = 12 depleted mice; ****, P < 0.0001, two-way ANOVA followed by Sidak’s multiple comparison test (ipsilateral second reperfusion [rep.], **, P = 0.0099; third occl., *, P = 0.0270; third rep., ****, P < 0.0001 control versus depleted; contralateral second occl., *, P = 0.0233; second rep., **, P = 0.0052; third occl., ***, P = 0.0001; third rep., ****, P < 0.0001 control versus depleted). (e) ICV clodronate administration resulted in the depletion of CD206-positive PVMs but did not affect microglial cells (P2Y12R labeling, green). Blood vessels were visualized using the endothelial marker, tomato lectin (blue). Scale bar, 20 µm. Quantification of the number of PVMs after ICV clodronate liposomes or PBS injection. n = 5–5 mice control versus clodronate injected; ****, P < 0.0001, unpaired t test with Welch’s correction. (f) Quantification of the number of P2Y12-positive microglia cells after ICV clodronate liposomes or PBS injection. n = 5–5 mice control versus clodronate injected, unpaired t test with Welch’s correction. (g) PVMs were eliminated from the brain by ICV liposomal clodronate injection before LSCI measurements. (h) No difference in CBF is seen between clodronate-treated and control mice after 3× CCAo. n = 5 and 5 mice control versus clodronate injected, two-way ANOVA followed by Sidak’s multiple comparison test. Data are expressed as mean ± SEM. LSCI data have been pooled from two to three independent experiments.
Figure S4.
Figure S4.
CBF was measured during transient left CCAo through the intact skull bone by LSCI. (a) Representative perfusion (0–300 PU, on the top of a, and difference images (−75 to +75) on the bottom of a show baseline CBF and perfusion changes during CCA occlusion. Scale bar, 1 mm. (b) Representative graph showing the typical kinetics of repeated (3× CCA) occlusions on the areas (MCA1–3 areas) investigated on both hemispheres. ROIs are shown on a representative perfusion image on the right. Black rectangles on the kinetic graph display the sections of curves, which were used for detailed analysis. Scale bar, 1 mm.
Figure 8.
Figure 8.
Microglial actions on CBF require P2Y12R signaling. (a) Outline of the experimental 3× CCAo protocol (occl., occlusion; reperf., reperfusion). (b) Representative difference images show altered perfusion in both hemispheres in response to 3× CCAo in P2Y12R KO and PSB0739-injected mice compared with controls. Dashed lines show the MCA2 area both in the ipsilateral (white arrowheads) and in the contralateral hemisphere (empty arrowheads) corresponding to the quantitative analysis shown in c. Scale bar, 1 mm. rep., reperfusion. (c) A significant impairment in adaptation to hypoperfusion is seen both in the ipsilateral and contralateral hemispheres of P2Y12R KO mice and PSB0739-injected mice compared with controls. n = 12 control, n = 12 P2Y12R KO, n = 7 PSB0739-injected mice; ****, P < 0.0001, two-way ANOVA followed by Tukey’s multiple comparison test (ipsilateral first rep., **, P = 0.0042 control versus P2Y12R KO; **, P = 0.0057 control versus PSB-0739; second occl., **, P = 0.0013 control versus P2Y12R KO; *, P = 0.0214 control versus PSB-0739; second rep., ***, P = 0.0002 control versus P2Y12R KO; **, P = 0.0049 control versus PSB-0739; third occl., ***, P = 0.0001 control versus P2Y12R KO; *, P = 0.0302 control versus PSB-0739; third rep., ****, P < 0.0001 control versus P2Y12R KO; contralateral second rep., **, P = 0.004 control versus P2Y12R KO; **, P = 0.0096 control versus PSB-0739; third occl., ****, P < 0.0001 control versus P2Y12R KO; *, P = 0.0133 control versus PSB-0739; third rep., ****, P < 0.0001 control versus P2Y12R KO). Data are expressed as mean ± SEM. LSCI data have been pooled from two to three independent experiments.

References

    1. Alexander, G.M., Rogan S.C., Abbas A.I., Armbruster B.N., Pei Y., Allen J.A., Nonneman R.J., Hartmann J., Moy S.S., Nicolelis M.A., et al. . 2009. Remote control of neuronal activity in transgenic mice expressing evolved G protein-coupled receptors. Neuron. 63:27–39. 10.1016/j.neuron.2009.06.014. - DOI - PMC - PubMed
    1. Apostolova, I., Wunder A., Dirnagl U., Michel R., Stemmer N., Lukas M., Derlin T., Gregor-Mamoudou B., Goldschmidt J., Brenner W., et al. . 2012. Brain perfusion SPECT in the mouse: Normal pattern according to gender and age. Neuroimage. 63:1807–1817. 10.1016/j.neuroimage.2012.08.038. - DOI - PubMed
    1. Arnold, T., and Betsholtz C.. 2013. The importance of microglia in the development of the vasculature in the central nervous system. Vasc. Cell. 5:4. 10.1186/2045-824x-5-4. - DOI - PMC - PubMed
    1. Attwell, D., Buchan A.M., Charpak S., Lauritzen M., Macvicar B.A., and Newman E.A.. 2010. Glial and neuronal control of brain blood flow. Nature. 468:232–243. 10.1038/nature09613. - DOI - PMC - PubMed
    1. Badimon, A., Strasburger H.J., Ayata P., Chen X., Nair A., Ikegami A., Hwang P., Chan A.T., Graves S.M., Uweru J.O., et al. . 2020. Negative feedback control of neuronal activity by microglia. Nature. 586:417–423. 10.1038/s41586-020-2777-8. - DOI - PMC - PubMed

Publication types

MeSH terms

Substances